Square
Following
Hot
News
Notifications
Profile
Share your thoughts
placeholder
Article
11.22
Manual market monitoring has its limits; quantitative trading never tires.
Alpha Quant Alpha Quant
AI-powered algorithms + multidimensional risk management
Automatically capture global market opportunities 24 hours a day
Eliminate subjective emotions and human greed and fear
Replace human judgment with professional computing power
Give every trade a basis in data, strategy support, and risk management safeguards
Steady compounding, systematic arbitrage, and sustainable long-term returns!
post-image
BTC Fall below 60k
live-cover
LIVE3,040
BTC-0.67%
Trenches
IDOL
I
bade
b
IDOL
0x3b...ab07
Market Cap
$.
Change
.
24h Vol
$.
Holders
.
JAGENT
J
bade
b
JAGENT
0x8e...ae15
Market Cap
$.
Change
.
24h Vol
$.
Holders
.
PIEVERSE
P
bade
b
PIEVERSE
0x0e...25a9
Market Cap
$.
Change
.
24h Vol
$.
Holders
.
CLAUDIA
C
bade
b
CLAUDIA
2j5S...W2ZM
Market Cap
$.
Change
.
24h Vol
$.
Holders
.
Singularity
S
bade
b
Singularity
7R4M...pump
Market Cap
$.
Change
.
24h Vol
$.
Holders
.
#GoldNears3500 $XAUUSD ‌
Navigating the Overextended Gold Market from Macro to Micro"

The current market presents a classic paradox: price action is heavily overextended, yet momentum remains tantalizing. Trading on the 4-hour and 1-hour charts right now is not about chasing the trend, but about understanding why the market is stretched. We are looking at a scenario where retail traders are caught in the crossfire of institutional liquidity hunting. This analysis breaks down the structural mapping of Gold (XAUUSD), analyzing the flow from a monthly macro perspective down to the 1-hour execu
XAUUSD-2.40%
  • 3
  • 1
Who came up with instant noodles? They’re so satisfying as soon as they hit your mouth!!!!
People are selling Bitcoin and Ethereum to buy GTA 6.
From HODL to VICE CITY.
The biggest liquidity rotation in crypto history. 😂
post-image
BTC-0.67%
ETH-1.26%
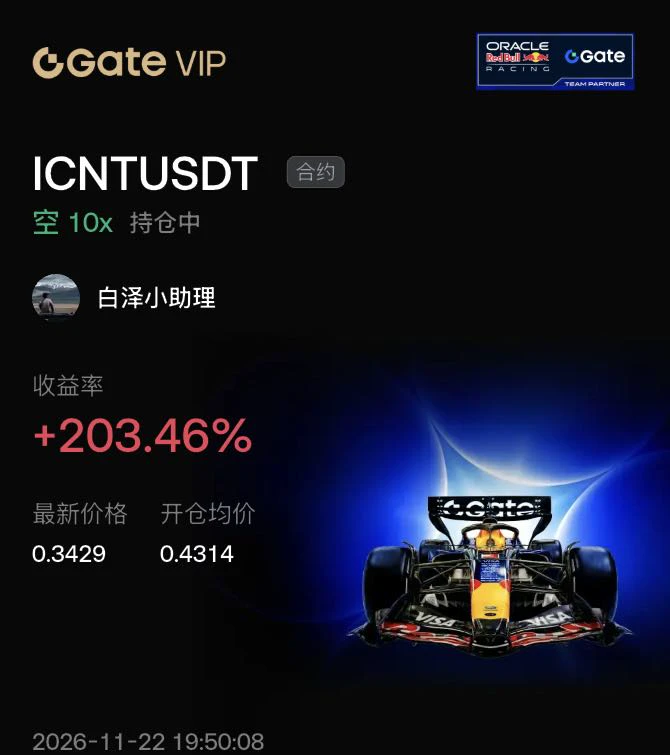
$ICNT It went live on a major European payment platform on November 17–18, and its price rose from around 0.33 to about 0.52, pushing it into the top gainers during those two days.

Your entry price is in the pullback from that peak.

It then continued lower: down 11.3% on 11/19, flat around 0.34 on the 20th and 21st, and down another 10.5% during the day today. The new users brought in by the launch were a one-off; once the hype faded, the price returned to reflecting real demand.

Today the broader market’s fear index was between 7 and 11, indicating extreme fear, and the crypto market as a
post-image
ICNT-10.47%
AKE+6.39%
  • 2
$BTC ETFs are still running, but not as hard as yesterday. BlackRock’s IBIT daily outflow narrowed to $125 million from $582 million the previous day, as selling pressure hit the brakes.

Previously, plenty of people saw headlines about “four consecutive weeks of outflows and $3.5 billion in monthly losses” and kept shorting around 56,000. But marginal outflows are slowing, and with gold and crude oil prices rising in after-hours trading, the foundation of the bearish thesis has weakened.

I didn’t wait for ETF flows to turn positive completely. I went long only after the price pulled back to
BTC-0.65%
ETH-1.23%
SNDK-0.18%
  • 1
#BTCBreaksBelow60K
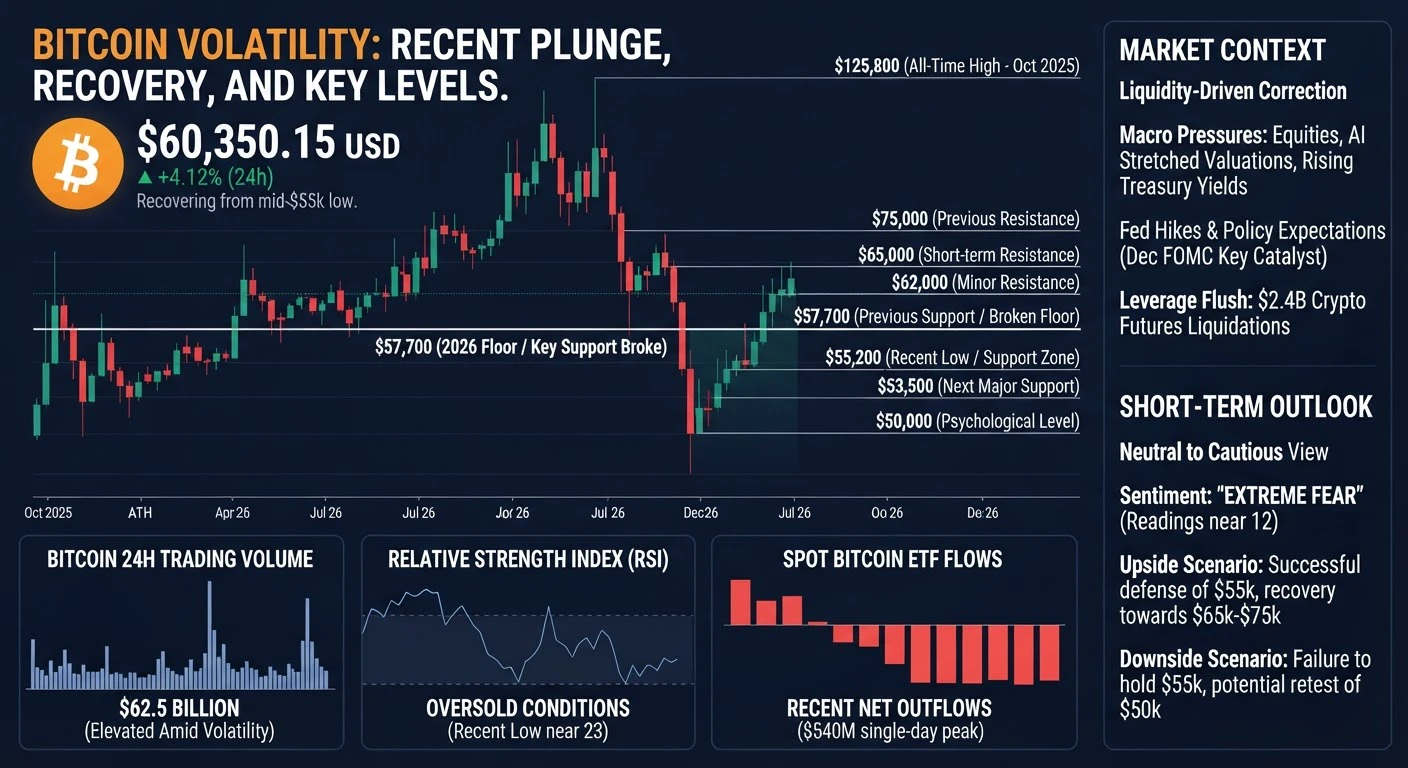
Bitcoin currently trades near the 60,000 dollar mark after a sharp decline that briefly pushed it to the mid-55,000 zone in recent sessions. This represents a recovery of roughly 8 to 9 percent from the recent low around 55,100 to 55,300 dollars, which marked the weakest levels seen since September 2024. Over the past 30 days the asset has declined approximately 26 to 28 percent, while the one-year performance shows a drop of around 28 to 34 percent depending on the exact reference point. From the all-time high near 126,000 dollars recorded in October 2025, Bitcoin now sits
post-image
BTC-0.67%
NDAQ-0.95%
ANT-8.68%
🔹 Ethereum(ETH) Surpasses 1,700 USDT with a Narrowed 1.69 Decrease in 24 Hours
live-cover
LIVE1,486
BTC-0.67%
XAUUSD-2.40%
XAU+0.38%
ETH-1.23%
NVDA-0.35%
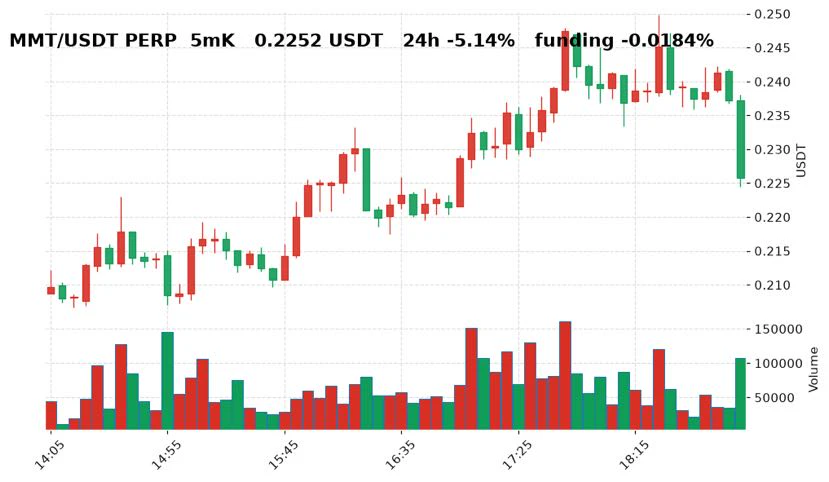
While killing time and watching the charts, I saw $MMT ‌ down 6.0% (within 5 minutes), with the current price at 0.2252. I’m not buying the dip or making a move; reviewing my own trades is more useful than making predictions. Not advice. The contract funding rate is -0.0184%; I don’t touch leverage. Honestly, I’m not sure either. A: watch from the sidelines; B: keep a log. What about you? #摸鱼看盘 #MMT
post-image
MMT-3.20%
  • 1
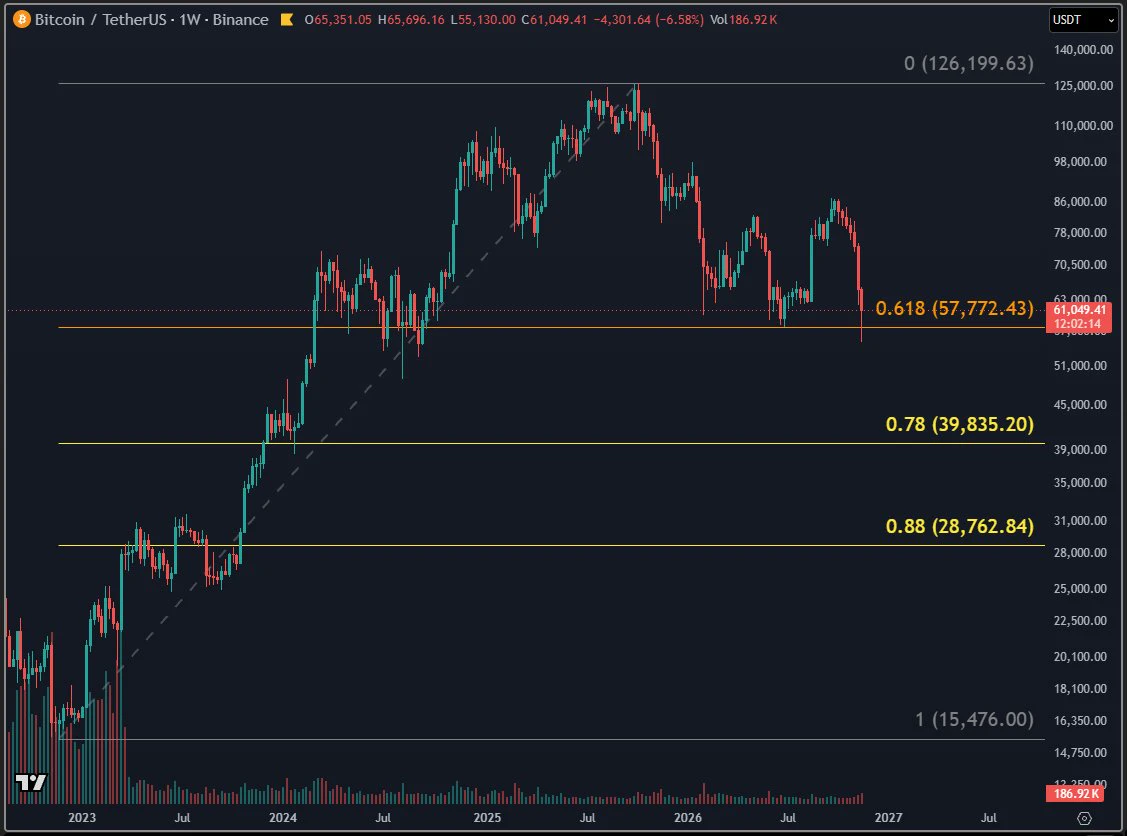
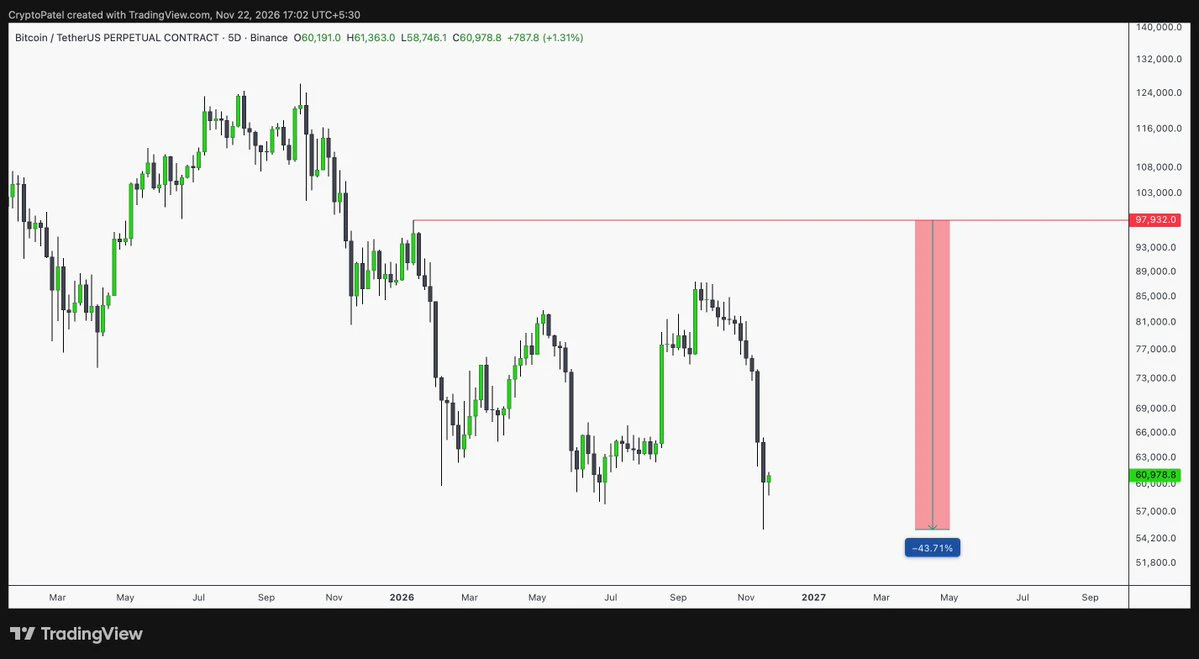
An answer to the many questions about Bitcoin’s bottom.. $BTC
Most people talking about the bottom and drawing squares and lines are making it all up
They hide the fact that they’re using Fibonacci so you won’t know why they chose that number
Bitcoin tested the golden Fibonacci level at $57777 .. 0.618 🧡
The bottoms they’re talking about are nothing but Fibonacci levels
The $39800 price is Fibonacci 0.78 💛
They believe it could extend to $28700, Fib 0.88 💛
Meaning their numbers aren’t based on trading experience or even a technical price pattern .. just free Fibonacci measurements from the
post-image
BTC-0.67%
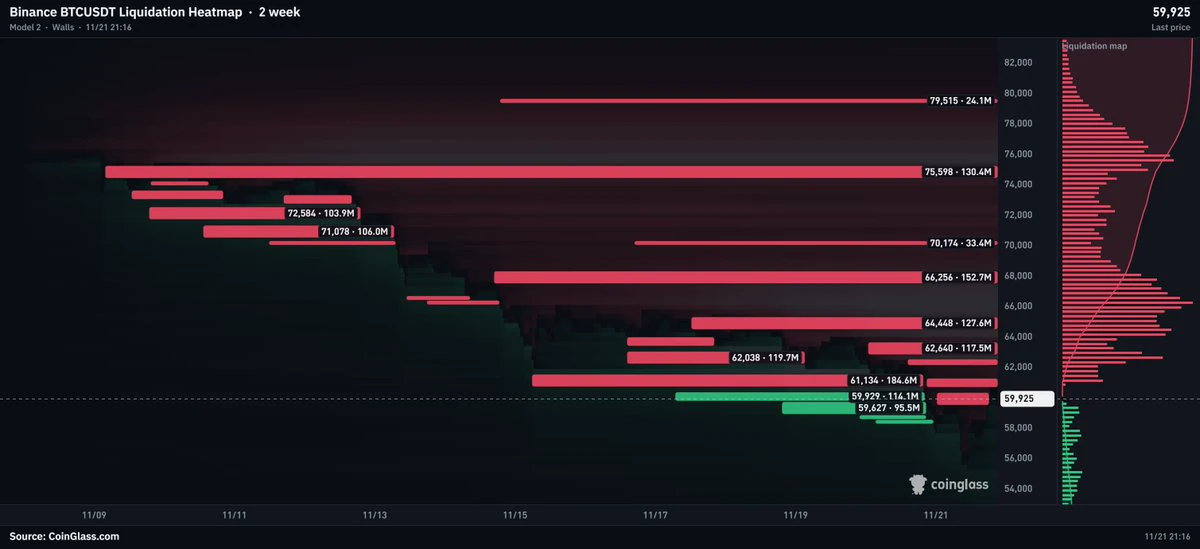
$BTC longs have been flushed, while over $700M in liquidation liquidity is stacked between $61K and $66K.
The fuel is now above the current price. A short squeeze could drive the next major move higher.
post-image
BTC-0.65%
Join the Gate 2026 Annual Gala: register to get 100 boost points and vote for your favorite stars of the year. For every 100 boost points you use, you get 1 draw chance(s) for a shot at surprise prizes. https://www.gate.com/competition/Annual-Gala?ref_type=165&ch=Direct&ref=VLFCVA8MAQ
post-image
Weekend news:
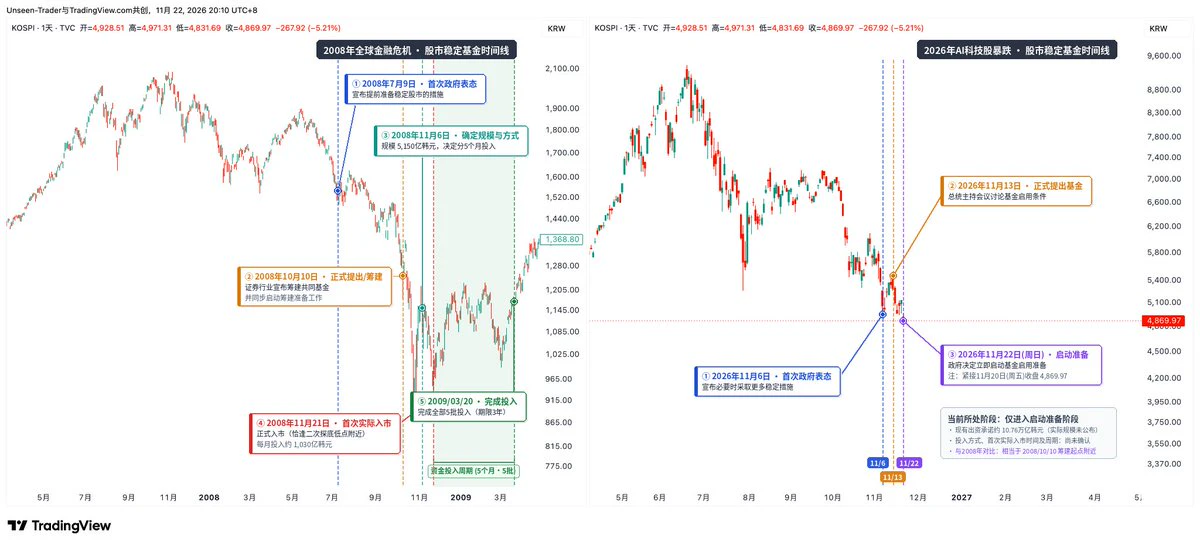
The South Korean government has decided to begin preparations for a stock market stabilization fund.
The last time South Korea deployed a stock market stabilization fund was November 21, 2008.
A comparison of the 2008 timeline with this time is listed; the K-line chart offers a clearer view.
Looking at 2008, the government’s signal that it was preparing to stabilize the market and its announcement that it would establish a stock market stabilization fund briefly boosted the market.
Ultimately, the market bottomed between the first tranche of funds entering the market on November
post-image
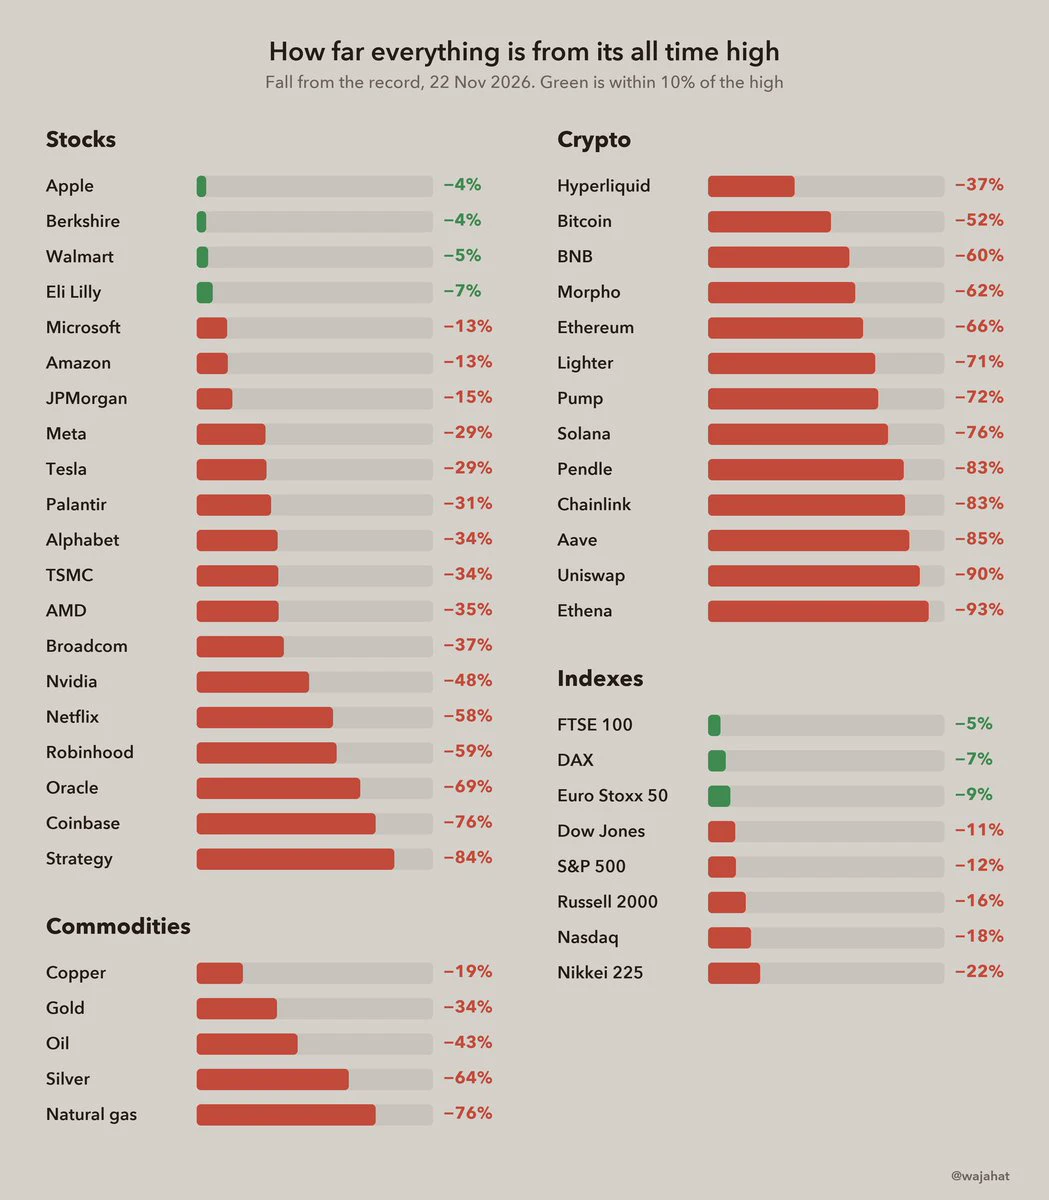
How far everything is from its all time high:
Apple -4%
S&P 500 -12%
Nasdaq -18%
Gold -34%
Hyperliquid -37%
Nvidia -48%
Bitcoin -52%
Silver -64%
Ethereum -66%
Apple and Eli Lilly, just wow.
post-image
AAPL-1.83%
SPX500+0.19%
US500-3.01%
XAU+0.38%
XAUUSD-2.40%
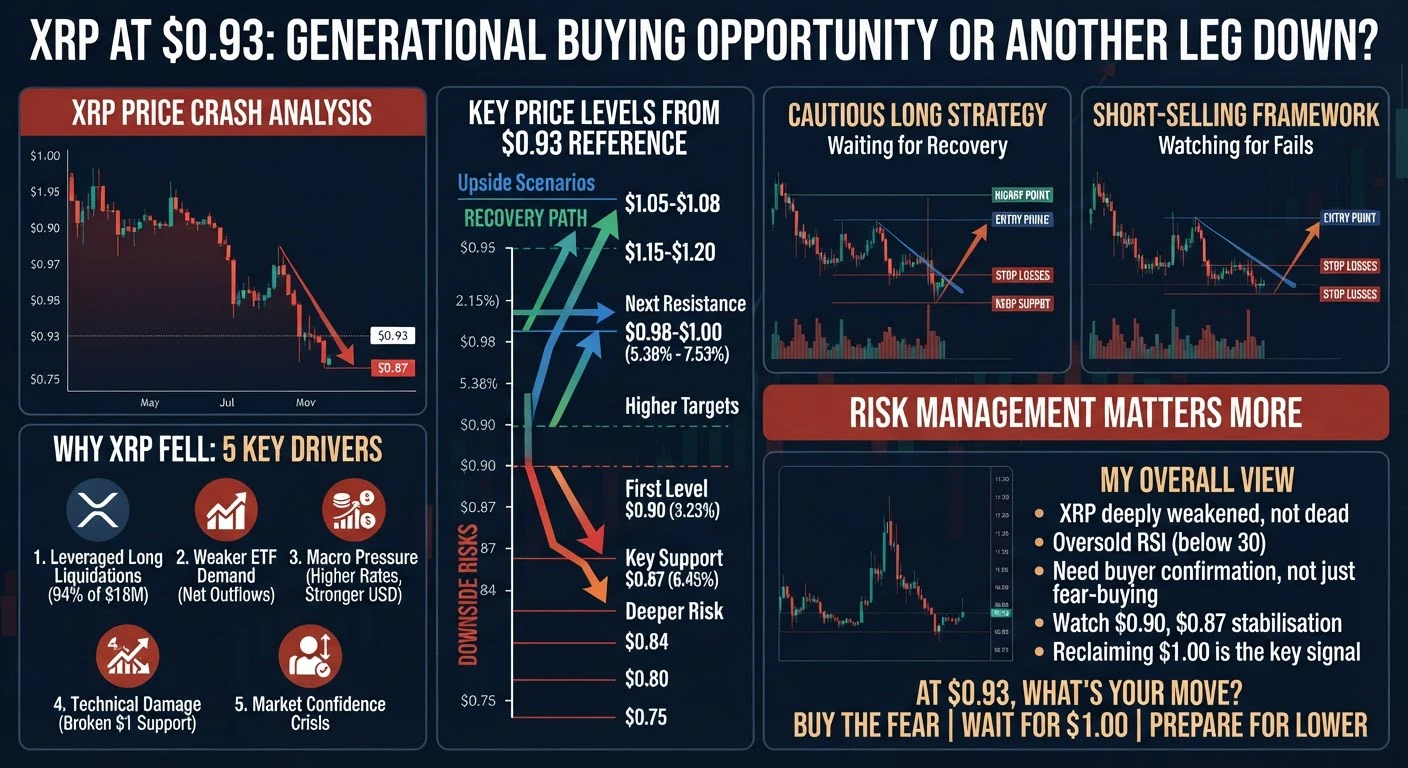
#XRP #WCTCS9
XRP near $0.93 is forcing investors to confront a difficult reality: a recognised brand and established payments network do not prevent a brutal decline when liquidity disappears and confidence weakens. The question is why sellers have taken control, what could stop the falls, and what evidence would confirm buyers are returning. The answer requires examining flows, leverage, macro pressure and technical structure before buying again.

WHY XRP HAS FALLEN SO SHARPLY

Leveraged long positions were forced out as important support levels broke. CoinDesk reported that XRP fell roughly
post-image
XRP-1.15%
BTC-0.67%
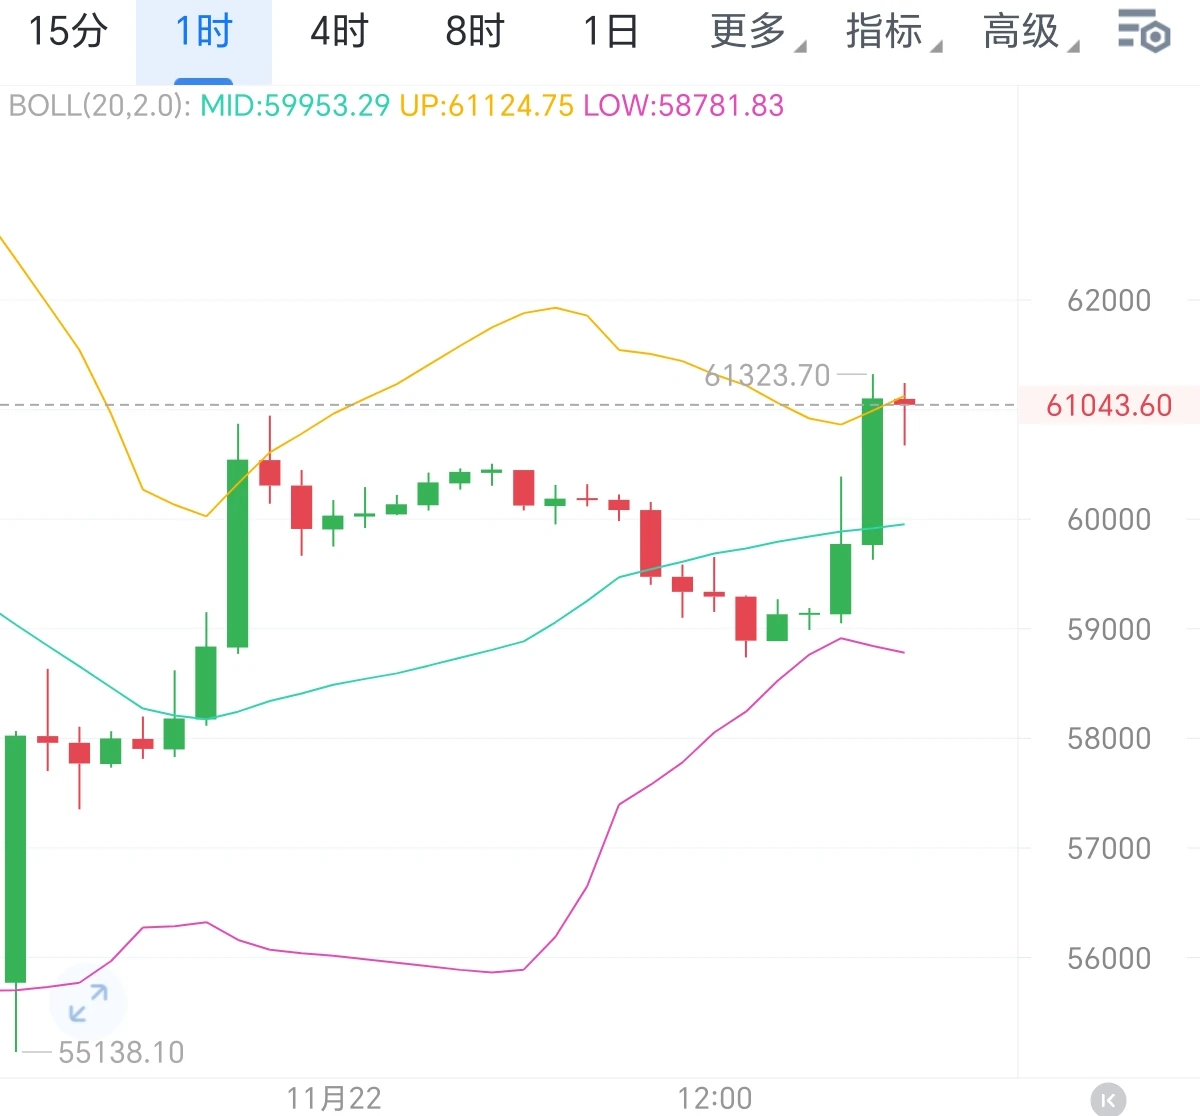
11.22 BTC Analysis

After stabilizing at lower levels on the one-hour chart, BTC staged a rebound pulse. The price met resistance near the upper Bollinger Band and formed a candlestick showing a stalled rise, while the Bollinger Bands widened upward in tandem, releasing some short-term bullish recovery momentum. However, this rebound was driven by oversold conditions, with insufficient follow-through from new capital and concentrated selling pressure overhead. The price is now approaching a previous resistance zone, intensifying the battle between bulls and bears and entering a short-term cons
post-image
BTC-0.67%
$BTC to $30k
We are almost there
No more road blocks
Trade against me and cry 😅
BTC-0.67%
  • 1
Bitcoin has fallen to around 55,000, and many people feel it’s starting to look like good value.
Market sentiment is sharply divided: some are certain it’s unlikely to fall much further and is more or less at the bottom; others are bearish, calling for a drop to 40,000.

At the end of the day, these are all bets—there’s no absolutely correct answer.
One of the market’s cruelest realities is that many market moves we subjectively regard as “definitely not impossible” often turn out to be traps that leave bold, leveraged traders completely wiped out.

Remember WTI crude oil on April 20, 2020? Th
post-image
BTC-0.67%
After Anthropic's IPO, 96% of employees became millionaires

Claude's stock market debut at a valuation of $1.76 trillion made thousands of employees wealthy:

💲 5,100 people own shares worth more than $1 million
💲2,800 people — more than $10 million
💲600 people — more than $100 million

By comparison, about 4,400 SpaceX employees became millionaires after its IPO, or 20% of the workforce. Anthropic allowed employees to sell up to 10% of their shares on the first day of trading.
ANT-8.68%
SPCX-7.38%
Load More

Join 40 M users in our growing community

⚡️ Join 40 M users in the crypto craze discussion

💬 Engage with your favorite top creators

👍 See what interests you

Trending Topics

BTCReboundFaces60KTest

2.1M Views30.1K Discussing

BTC rebounded from around $55,300 on November 21, briefly reclaiming $60,000 before pulling back to around $59,300. The $60K level is back in focus as traders assess whether the recovery can last. Is this rebound a sign of stabilization or a short-lived recovery? Would reclaiming and holding $60K be enough, or do you need confirmation from trading volume and fund flows?

PCEAndGDPDataNextWeek

259.4K Views2.6K Discussing

GateDirectIPOPhase3ANTAllocates92100Shares

834.6K Views5K Discussing

View More