

Square
Following
Hot
News
Notifications
Profile
Share your thoughts
placeholder
Article
$BTC
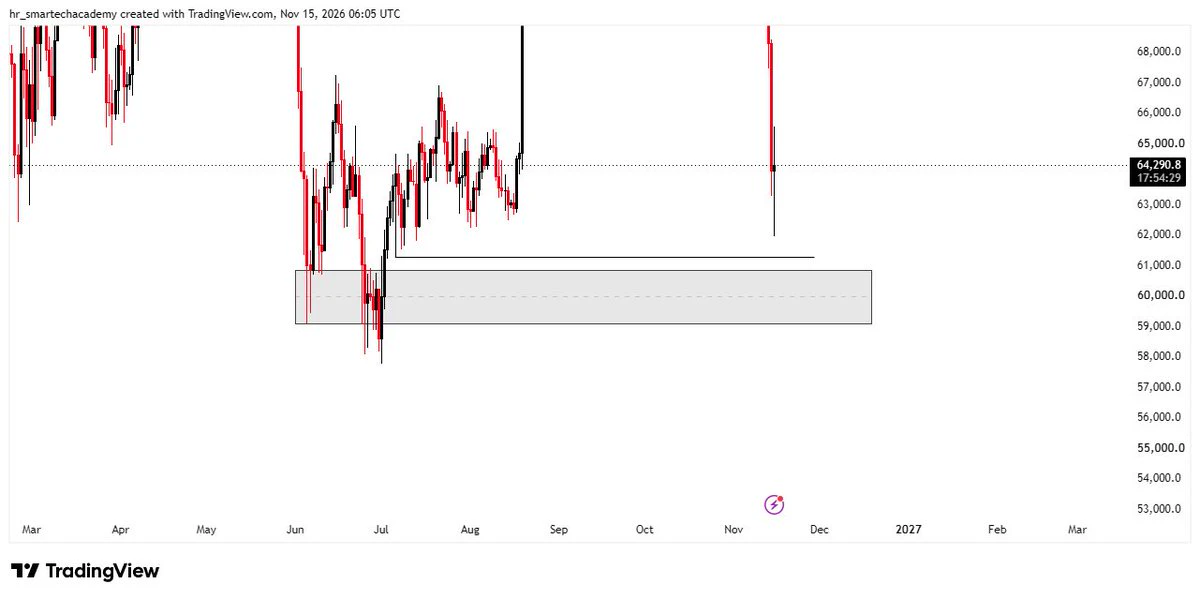
Here is the only opportunity for the Bulls to have a pull back
Lose this AOI
Sorry, $30k all the way 😀
post-image
BTC-0.67%
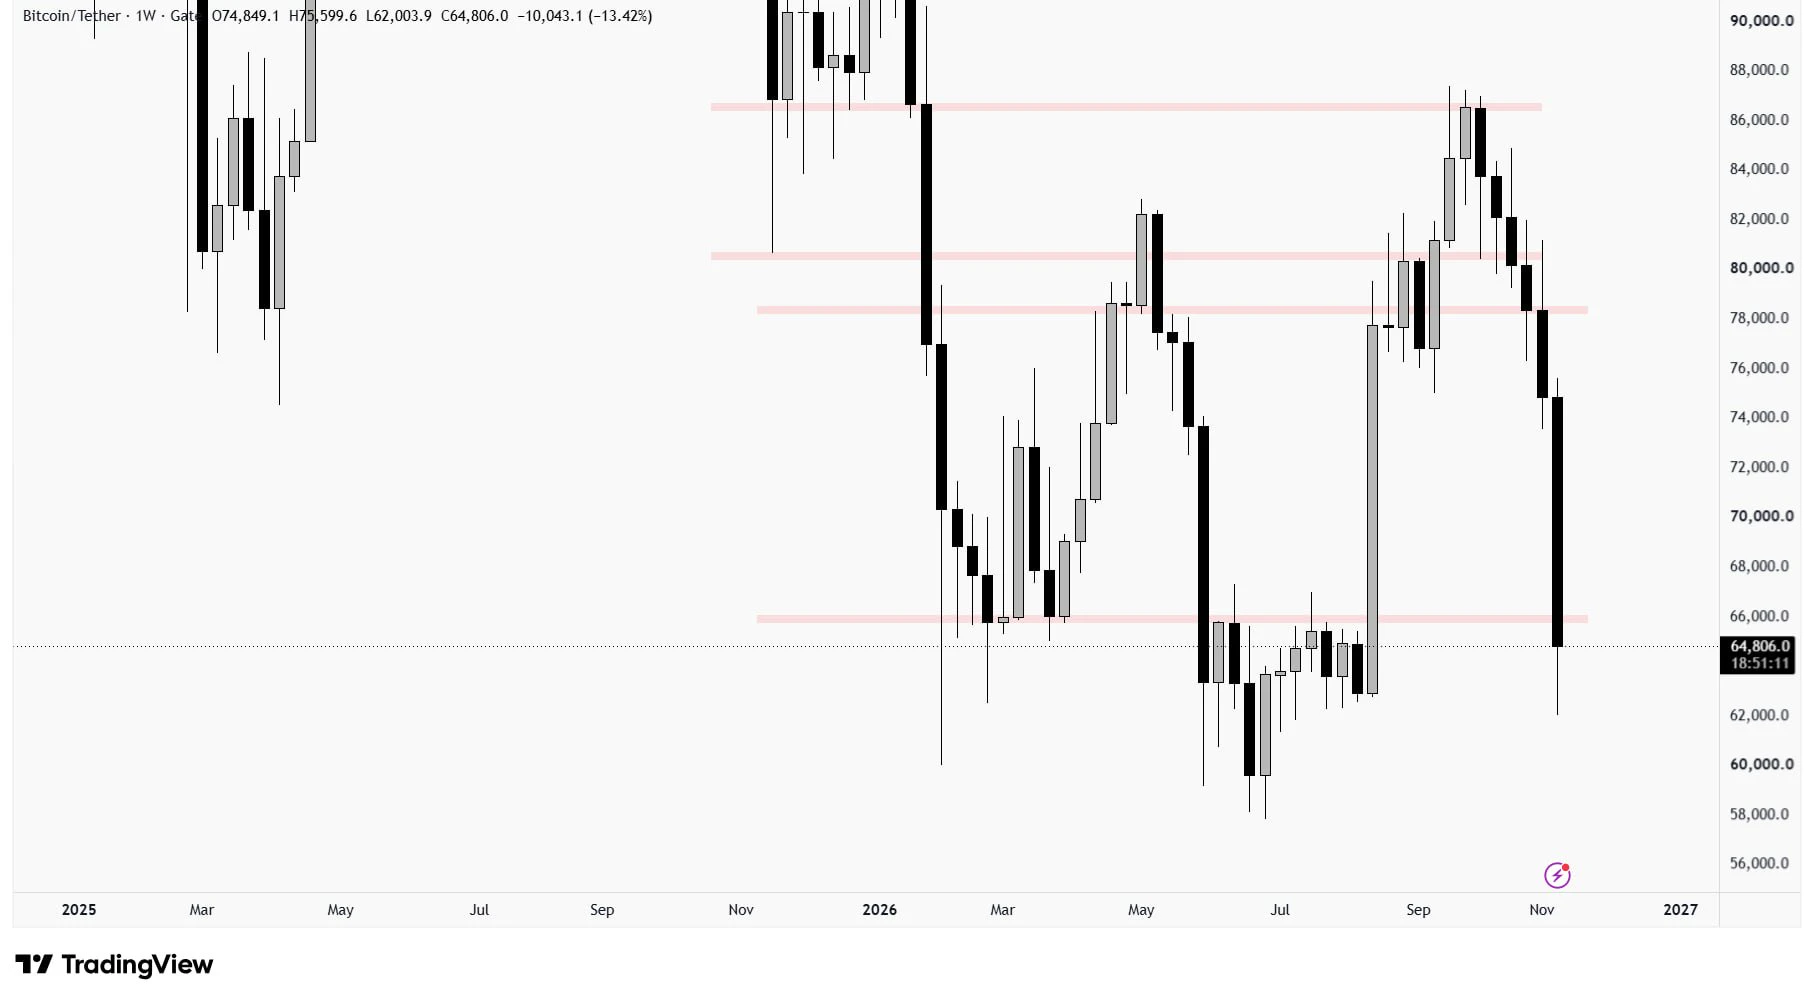
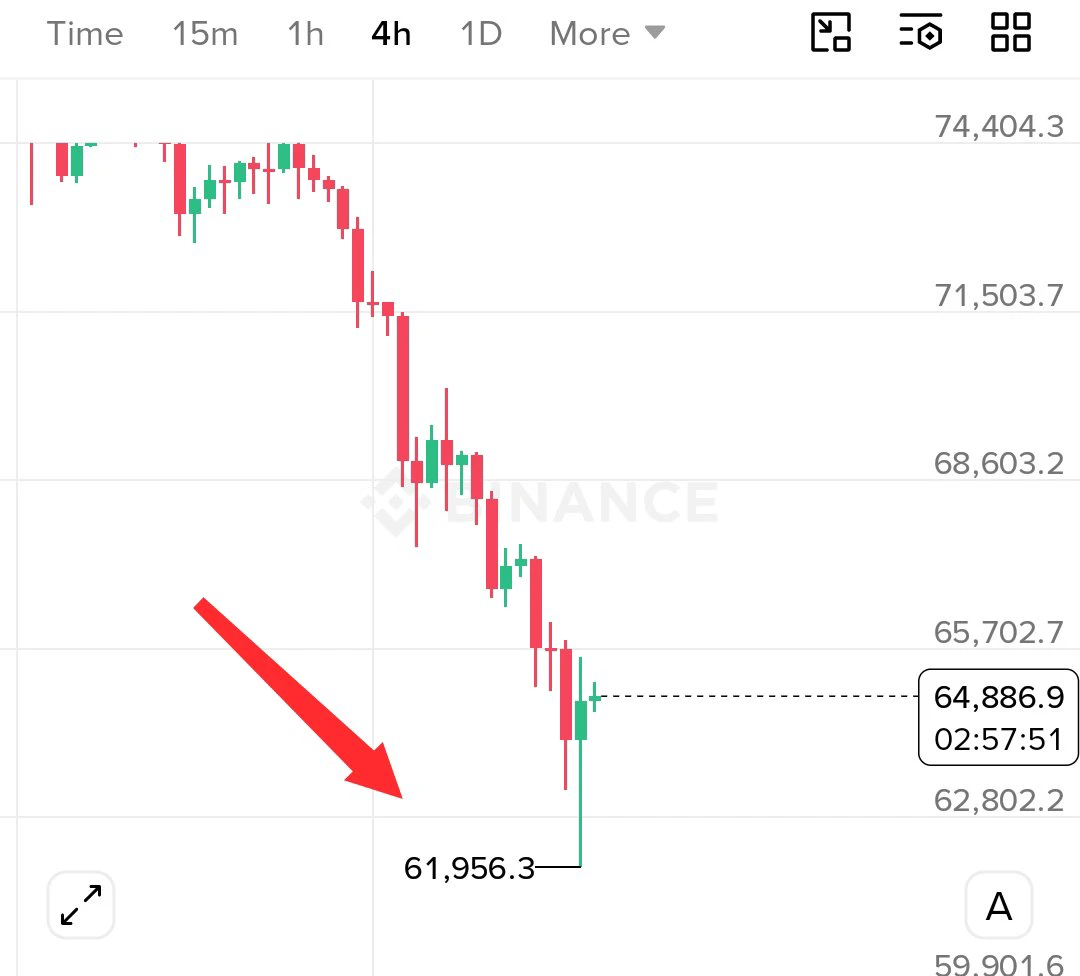
$BTC dropped hard this week and even surpassed the expected area.
Now price is closing below a weekly level, so ultimately it's bearish for next week too.

A short-term retracement is possible, so don't try to anticipate a reversal that early.

#GateIPOAccessAnthropic #GateOctoberTransparencyReport #BitcoinDropsBelow$70K
post-image
BTC-0.67%
Trenches
mihao
m
bade
b
mihao
4Cxj...pump
Market Cap
$.
Change
.
24h Vol
$.
Holders
.
Snoopy
S
bade
b
Snoopy
7mEh...47Cn
Market Cap
$.
Change
.
24h Vol
$.
Holders
.
AGT
A
bade
b
AGT
0x5d...e274
Market Cap
$.
Change
.
24h Vol
$.
Holders
.
PIEVERSE
P
bade
b
PIEVERSE
0x0e...25a9
Market Cap
$.
Change
.
24h Vol
$.
Holders
.
WASTED
W
bade
b
WASTED
GexT...pump
Market Cap
$.
Change
.
24h Vol
$.
Holders
.
WEEKEND MORNING MARKET SESSION
live-cover
LIVE2,029
11.15 ETH Midday Market Analysis

I. Market Structure: A Rebound Has Emerged, but the Trend Has Not Reversed
The cumulative pullback has been significant. The price has now rebounded to around 1814, with a rapid recovery on the 15-minute chart. The short-term KDJ has also turned up noticeably from low levels, indicating that some buying support did emerge near 1710.
However, a short-term rebound does not mean the trend has reversed.
On the 2-hour and 4-hour charts, the price is still moving within a clear descending channel. The moving average resistance has not been effectively reversed, and
post-image
ETH-1.23%
Subscribe at 2:30 for a live lesson on position management and trading strategies and tactics!#比特币跌破7万美元 $ETH
post-image
ETH-1.23%
🔥 SUI/USDT Market Update: Testing Critical Support Zones – Accumulation or Deeper Correction? 🌊

SUI has experienced a notable cooling-off period recently, currently trading around $0.7216, reflecting a 24-hour retracement of about -7.24%. Let’s dive deep into the technical landscape to analyze current market behavior, key levels, and potential setups ahead.

📊 Key Market Metrics
Current Price: $0.7216

24h High / Low: $0.7857 / $0.6755

24h Volume (SUI): 18.29M (~13.44M USDT turnover)

Performance Overview:

7 Days: -15.22%

30 Days: -28.44%

90 Days: +6.59% (highlighting that mid-term hig
SUI-1.01%
  • 3
  • 1
In line with Aoying’s assessment, the whale liquidations are over, and from here it’s nothing but a sunrise in the east. Last cycle, you didn’t dare buy when BTC was at 60,000; if you pass it up again this time, you really won’t get another chance 😂 I’ve already opened a huge short position; once this trade is done, I’m retiring $BTC $ETH
Risk warning: The above is only my personal opinion and does not constitute any investment advice. Contract trading carries extremely high risks; please make decisions with caution.
post-image
BTC-0.67%
ETH-1.26%
$PUMP Now aggressively shorting, enter later by selling at $0.002880: short at $0.002880 $PUMP 👇
post-image
PUMP-1.06%
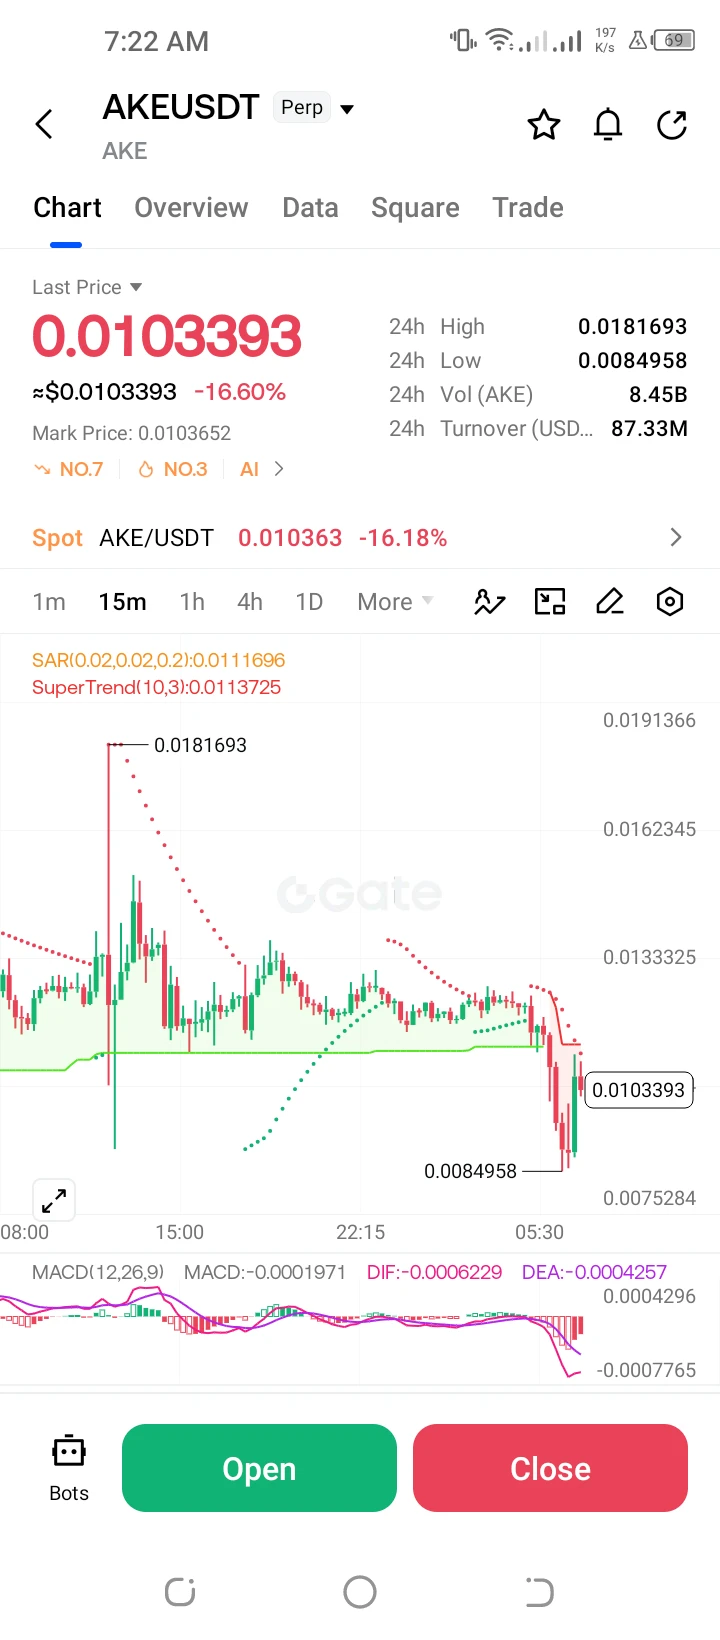
**$AKE /USDT Perp – "Extreme Volatility – Long"**
Trading Plan Long $AKE
Entry: 0.0103393
SL: 0.0084958
TP1: 0.0133325
TP2: 0.0162345
AKE is down -16.60% after extreme volatility, bouncing from the 0.0084958 low. MACD is deeply oversold; looking for a mean-reversion bounce toward 0.0133325. High risk.
post-image
AKE+6.39%
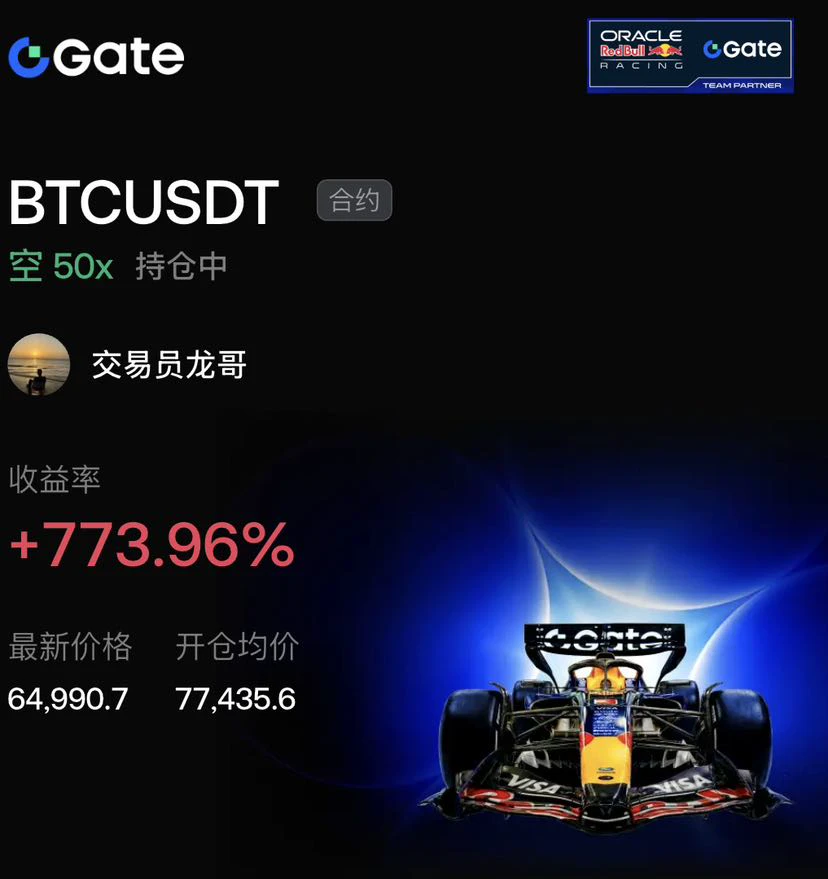
The market sold off relentlessly all day, and the bulls’ defenses completely collapsed! $BTC The 50x short was a huge success, with returns soaring to +773.96%. Opened at 77435, the position rode the waterfall drop through 64990, building a substantial profit cushion.

The entry logic was rock-solid: price repeatedly failed to break above 77k, volume and price diverged sharply, and bullish momentum had completely dried up. After a high-volume breakdown, the position decisively went all-in short at 50x, nailing the main leg down and ignoring every tempting rebound along the way.

Outlook: If t
post-image
BTC-0.65%
ETH-1.23%
GT-2.24%
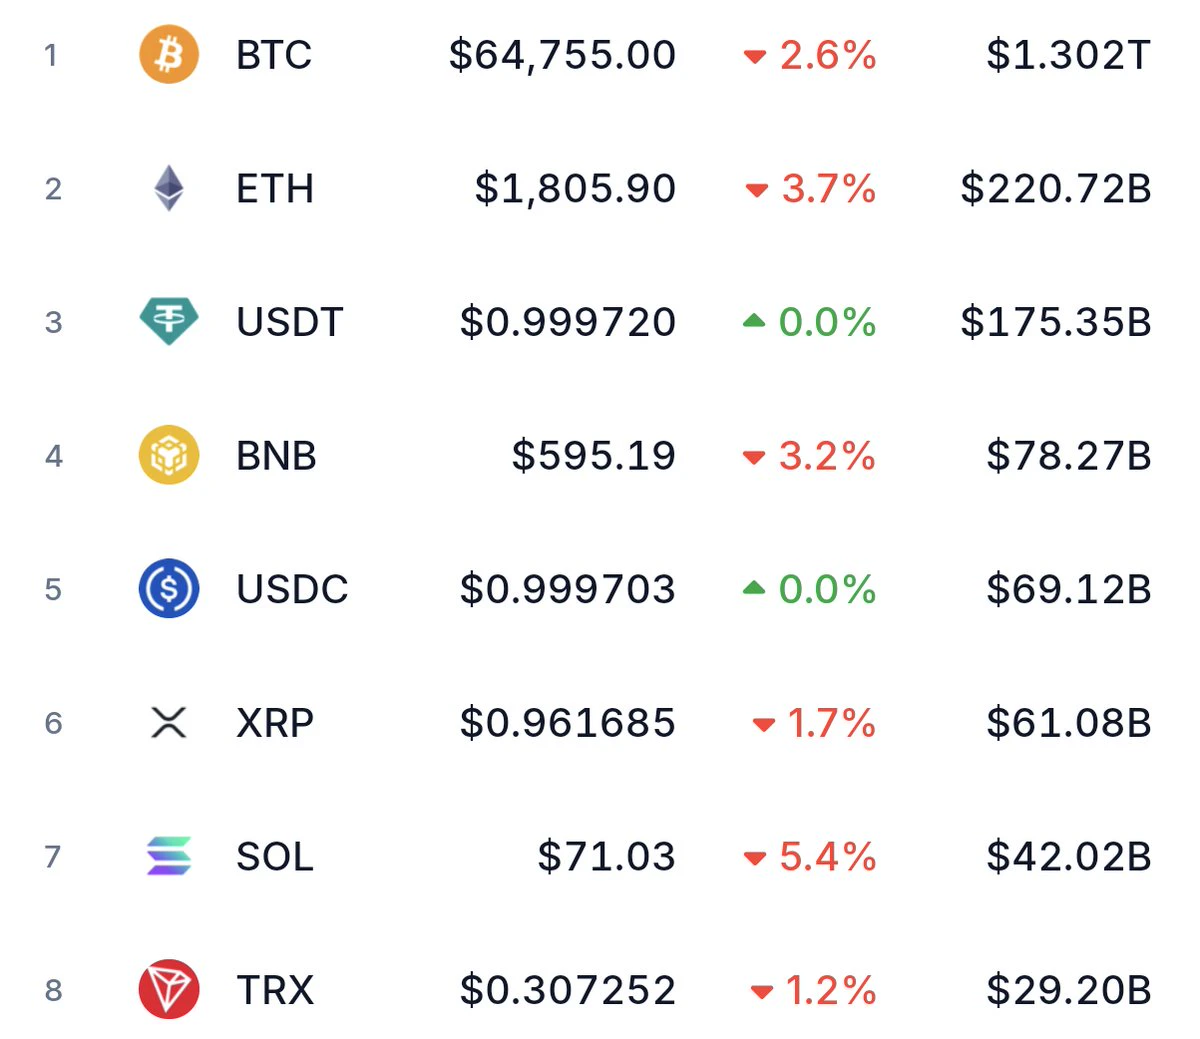
BTC has crashed below $62,000, and now everyone is remembering what I said.
I warned you every single day. Every single day!
Are you okay now?
Where are those so-called influencers and insiders? Are they standing with you?
I've spent half of my life in this market. Half of my life!
But one thing makes me genuinely happy: My entire Bull Team is 100% SAFE.
I'M UMER. 🐂
post-image
BTC-0.67%
Good morning all
Red day in crypto, but patience pays. Enjoy your Sunday.
post-image
Trade Futures to Win Prizes and Claim XAUT & SLVON Rewards https://www.gate.com/campaigns/6808?ref=VLARBF1YAG&ref_type=132
post-image
XAUT+0.30%
SLVON+0.22%
BTC Market update
live-cover
LIVE1,692
Looking back on this year, the market has given us a new reason almost every month:

January 2026 → Trade war
February 2026 → War
March 2026 → Oil price surge
April 2026 → Quantum panic
May 2026 → Inflation panic
June 2026 → Whale sell-off
July 2026 → Geopolitical conflict flares up again
August 2026 → Yields surge
September 2026 → Interest rate hikes
November 2026 → Tech AI controversy
Hardly a month went by without one.
Every month, the market needs a new reason to explain its volatility.
There’s one this month, and there’ll be another next month.
There’s never a single month that’s complete
post-image
DOGE-0.18%
SHIB-1.31%
PEPE+1.05%
  • 4
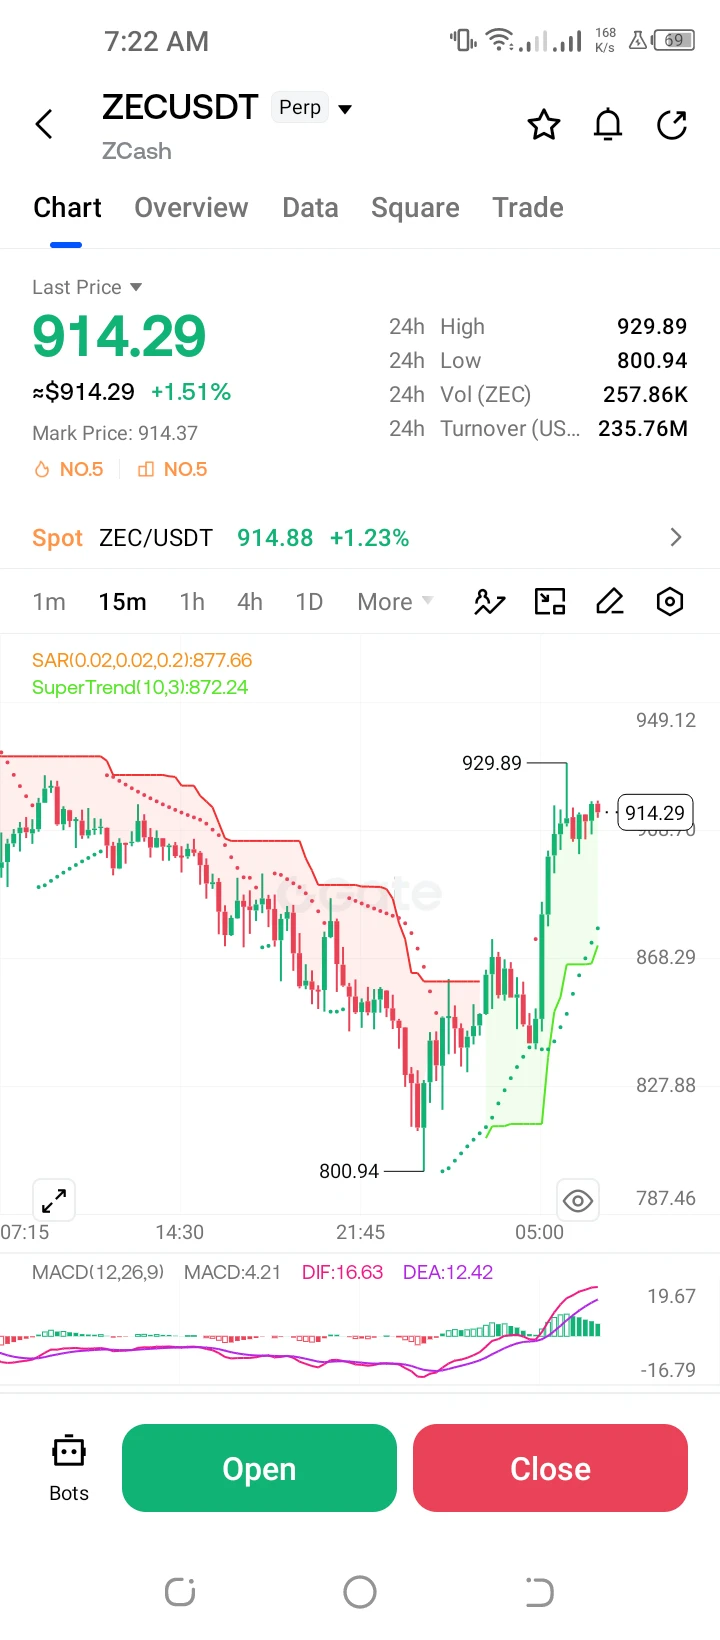
$ZEC /USDT Perp – "Aggressive Breakout – Long"**
Trading Plan Long $ZEC
Entry: 914.29
SL: 872.24
TP1: 929.89
TP2: 949.12
ZEC is up +1.51% after a huge recovery from 800.94. MACD is strongly bullish; targeting a breakout above the 929.89 high.
post-image
ZEC+1.29%
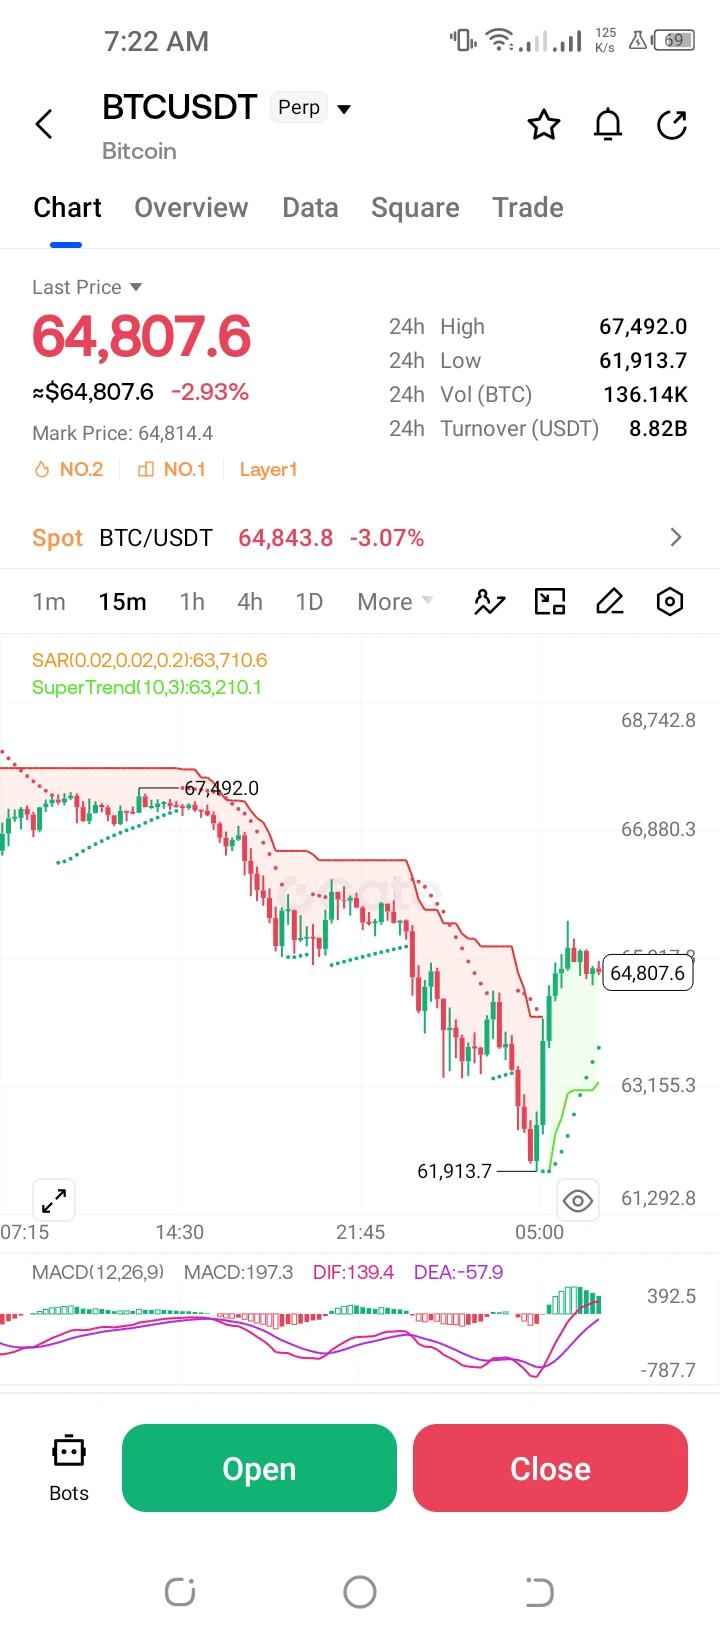
**$BTC /USDT Perpetual – "V-Bottom Rebound – Long"**
Long Trading Plan $BTC
Entry: 64,807.6
SL: 63,210.1
TP1: 66,880.3
TP2: 67,492.0
BTC is down -2.93%, but is staging a sharp rebound from its low of 61,913.7. MACD is showing a strong bullish crossover, with a target of the 66,880.3 resistance zone.
#USJoblessClaimsBeatExpectations
post-image
BTC-0.65%
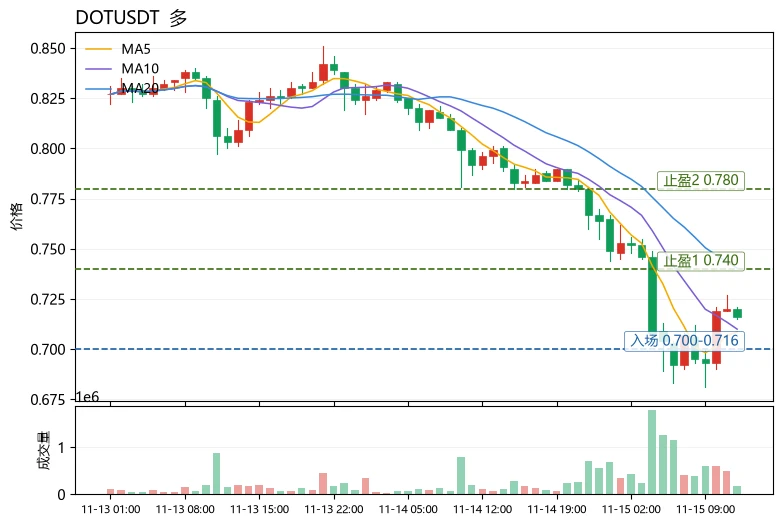
$DOT Current price: 0.716. 0.7404 (MA20) above is the first resistance, while 0.6724 (lower Bollinger Band) is the last line of defense. Down nearly 10% in 24 hours, but the funding rate is -0.0186%, meaning shorts are paying to hold positions—a classic crowded-short setup.
Technically, MA5=0.7086 is now below MA20=0.7404, and the medium-term moving average remains overhead. However, the price is tracking close to the lower Bollinger Band at 0.6724. The 30-candle range is 19.55%, so a wick-driven shakeout is quite possible. RSI=35.9 is nearing oversold territory, while the MACD histogram has
post-image
DOT-1.51%
ZEC+1.16%
TRX+0.42%
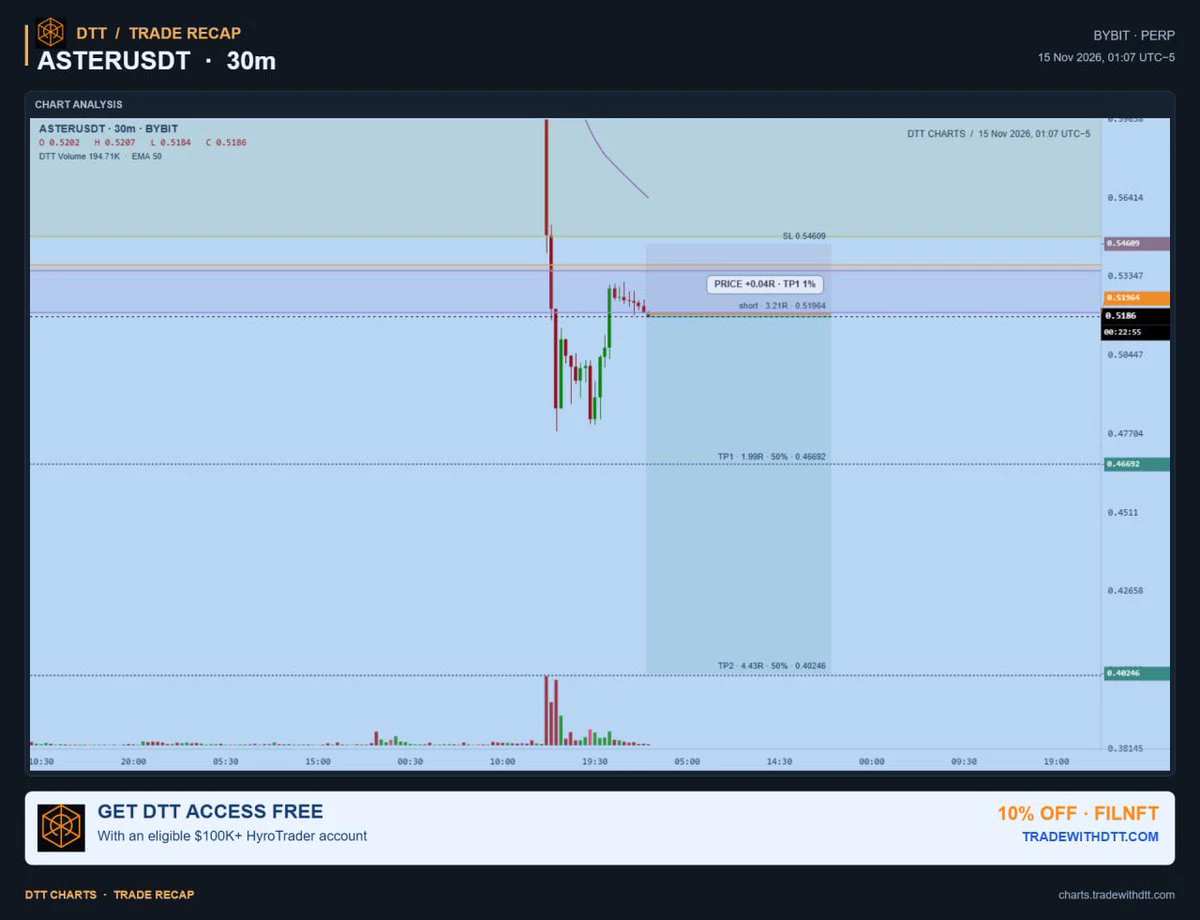
Entered a new short on $aster
Sl: $0.54609 area
Tp1: $0.46692
Tp2: $0.40246
3.21RR
— DTT
post-image
ASTER-0.07%
Load More

Join 40 M users in our growing community

⚡️ Join 40 M users in the crypto craze discussion

💬 Engage with your favorite top creators

👍 See what interests you

Trending Topics

GateIPOAccessAnthropic

341.9K Views2.6K Discussing

Gate IPO Access Phase 3 features Anthropic (ANT), with USDT subscription interest starting from 100 USDT. Successful allocations will be delivered as real shares to Gate Stock Accounts. Indicative price: $70–$78/share Subscription: Nov 12–17 (UTC+8) Allocation is not guaranteed. Please manage risk accordingly.

Dr.HanOxfordUnionSpeech

150.8K Views510 Discussing

USOctoberPPIBelowExpectations

478K Views1.4K Discussing

View More