
Square
Following
Hot
News
Profile
Share your thoughts
placeholder
Article
Trenches
STONK
S
bade
b
STONK
6GmA...UNgx
Market Cap
$.
Change
.
24h Vol
$.
Holders
.
CNPY
C
bade
b
CNPY
0xc6...ddd2
Market Cap
$.
Change
.
24h Vol
$.
Holders
.
AGT
A
bade
b
AGT
0x5d...e274
Market Cap
$.
Change
.
24h Vol
$.
Holders
.
LIGHT
L
bade
b
LIGHT
0x47...3c0e
Market Cap
$.
Change
.
24h Vol
$.
Holders
.
BTC
B
bade
b
BTC
C5xp...pump
Market Cap
$.
Change
.
24h Vol
$.
Holders
.
🐳 BITCOIN WHALES ARE MAKING MOVES!
Large holders accumulating $BTC could be a signal worth watching, but accumulation alone doesn’t guarantee a rally.
The real question is whether buyers can turn this activity into sustained upward momentum.
📊 Watch whale flows, trading volume, and key support levels.
My take: Stay alert, avoid FOMO, and let price action confirm the next move.
post-image
BTC-0.16%
Quantum computing ecosystem is getting more interesting by the day.
Today I randomly decided to download the @QuantusNetwork wallet and set up for the first time.
It was an easy onboarding process fr. I also dropped a feedback for them on Google.
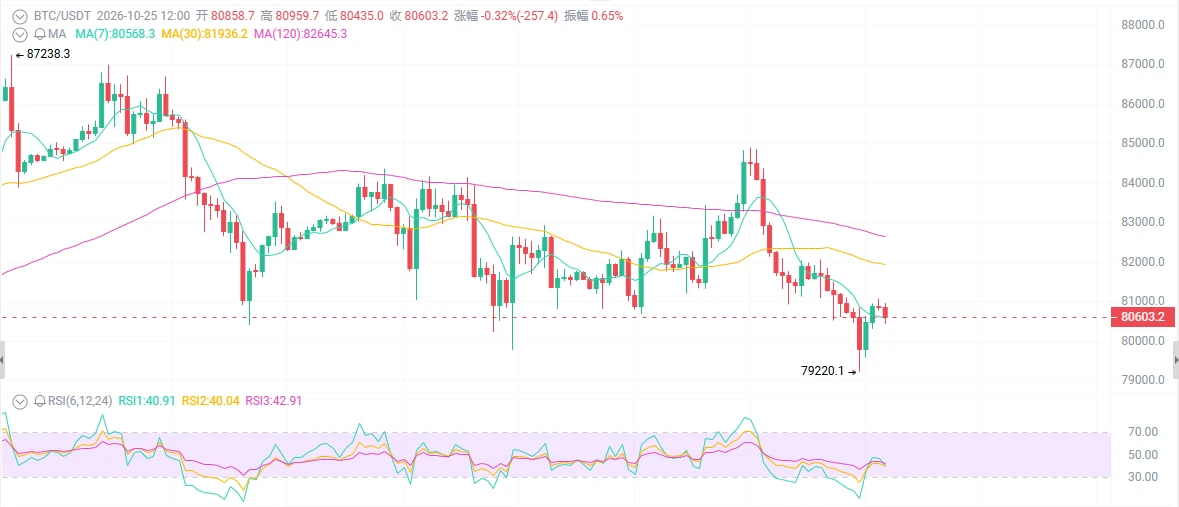
BTC at $80,600—would you still dare to buy the dip?
$689 million in long positions were just wiped out, oil surged to $117, and the Fed meets in three days—all eyes are on a break below 80k, but the price bounced back instead. Is this a dead-cat bounce or a golden buying opportunity engineered by the big players?
First, the surface picture: liquidations are over, but the price hasn't collapsed.
Weekend liquidity was thin. Longs worth $689 million were wiped out, total liquidations exceeded $800 million, and the price briefly fell below the psychological 80k level, bottoming at 79.2k. Then what
post-image
SOL-0.65%
ETH-1.12%
BTC-0.16%
chainlink partners with lg cns to advance korea’s $68b digital asset market, bringing cross-chain, data, and orchestration infrastructure to institutional solutions and digital asset standards.
#LINK #Tokenization $GATE
post-image
LINK-2.45%
LG CNS-0.13%
GM Saiyans! 🙌
“Never let fear of the unknown stop you from moving forward. The best things in life are often the ones we didn’t plan for.”
----
$BTC : 81.602 $
$ETH : 2.343 $
#BTC Fear & Greed Index: 54
#Bitcoin Dominance: 60%
post-image
BTC-0.16%
ETH-1.12%
Stablecoins Are Not Bank Deposits: 4 Differences You Need to Understand Before Using Them
In the Web3 world, stablecoins are often used for trade settlement, cross-border transfers, on-chain payments, and decentralized finance.
Since many stablecoins are pegged to the U.S. dollar, many users assume that as long as the price stays close to $1, they are much like the dollars in a bank account.
But there are several very important differences between the two.
First, a price peg is not a guarantee of principal.
Stablecoins typically use reserve assets, redemption mechanisms, or other designs to tr
post-image
  • 1
What does this mean?
Did they forget to hide the cup the student uses??
evening updates
live-cover
LIVE1,456
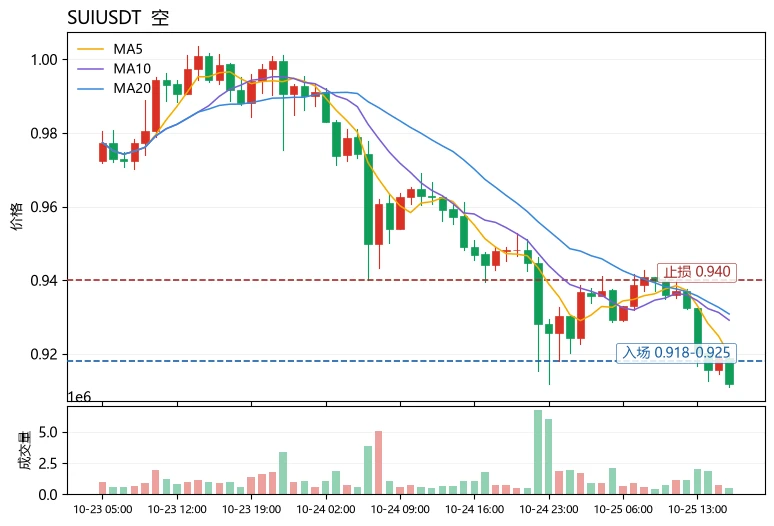
$SUI Is it time to buy the dip or keep waiting? Answer: Don’t buy the dip; wait for confirmation—the current setup is an oversold rebound window within a bearish moving-average alignment, not a trend reversal.
$SUI The current price is 0.9119, down 3.96% over 24h. MA5 at 0.91978 is below MA20 at 0.93082, indicating a bearish moving-average alignment; RSI is only 30.5, already in oversold territory, while the MACD histogram remains negative at -0.0009354, and the price is approaching the lower Bollinger Band at 0.91328. The 30-candlestick range is about 6.37%, with volatility moderately low, b
post-image
SUI-3.27%
ZBT-6.73%
STEEM+5.26%
$JCT It’s at 0.0069 now, up from 0.0026 to 0.0075 in 24 hours, a 164% gain, with 484M in trading volume—this isn’t an opportunity window; the shutter is coming down.
As your opportunity-window announcer, I’ll say this once: with a small-cap coin making a violent run on this kind of volume, the buyers chasing the rally and the dip-buyers are two different groups, but they’re making money off the same move—and the order matters. The price is now stuck at 0.0069, just 8% below the 24-hour high of 0.0075, while it’s already up 1.6x from the low of 0.0026. If you go all in here, where do you put yo
Disconnected, starting over...
live-cover
LIVE1,549
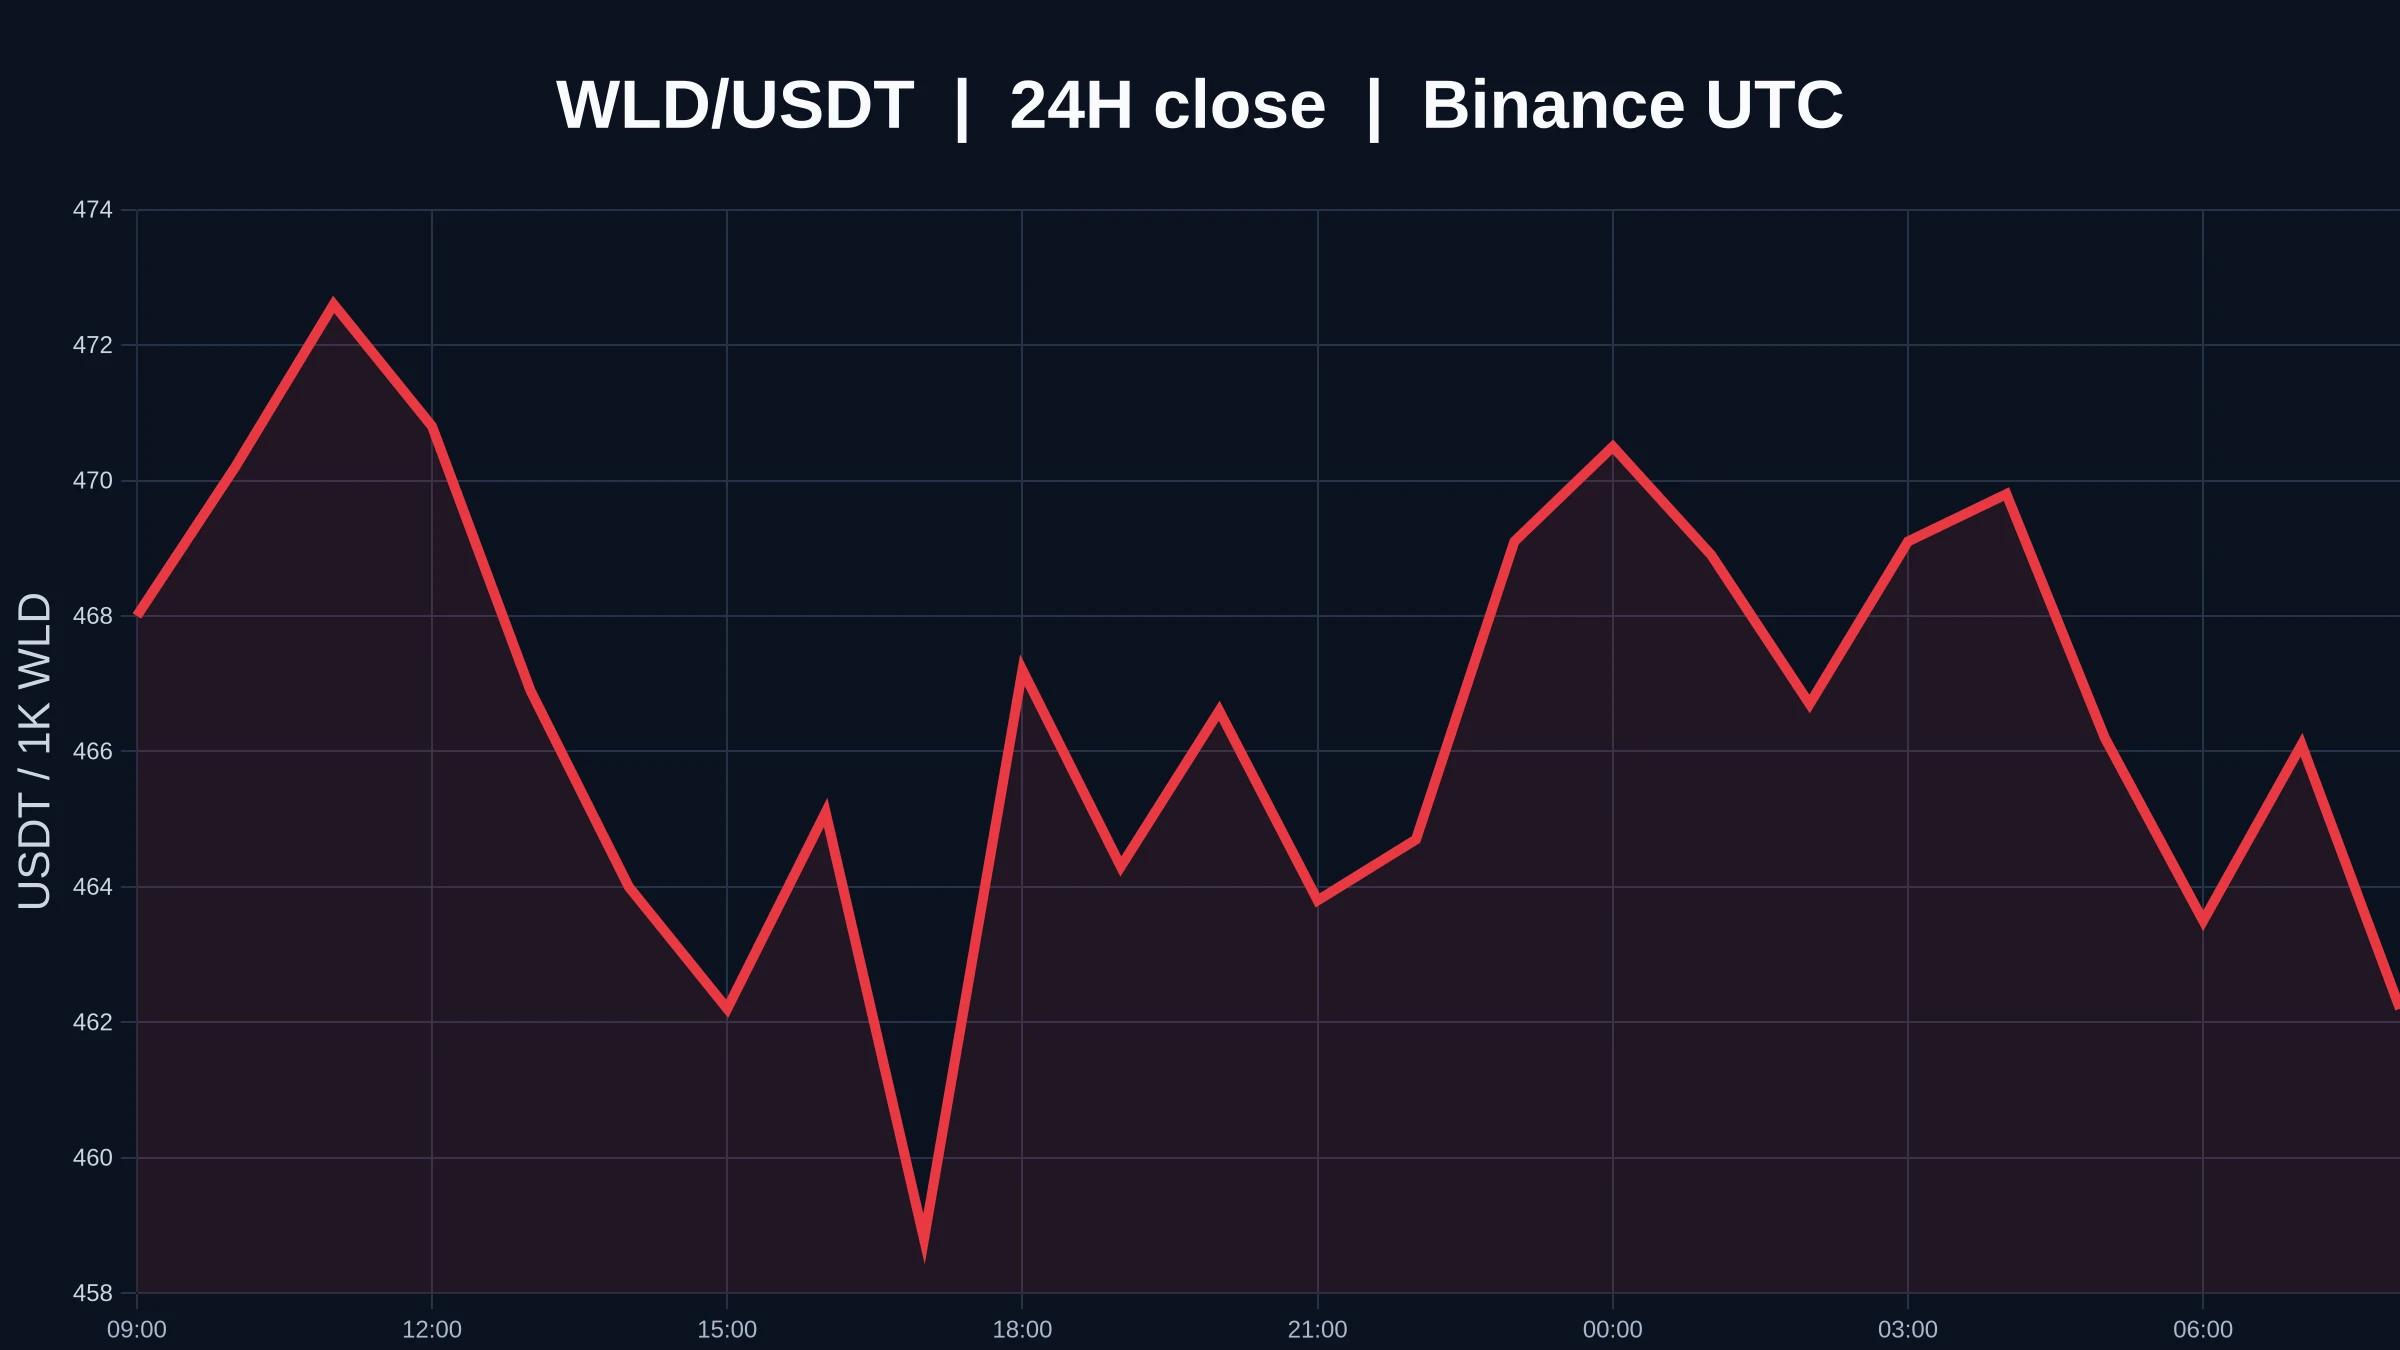
$WLD rebounds from oversold territory, but why I’m still not willing to call a bottom
$WLD is currently at 0.4644 USDT, down 1.49% over 24 hours, after trading between 0.4577 and 0.4747. The 1-hour support is at 0.4577, with resistance at 0.4742. Both the 1-hour and 4-hour trends are weak, and trading activity is only 0.07x. The price has already approached its 24-hour low, but the trend hasn’t reversed on either timeframe, and volume hasn’t signaled a change either, leaving the price moving sideways in a narrow range.
Oversold does not mean a bottom is in—that’s the first thing I want to mak
post-image
WLD-2.99%
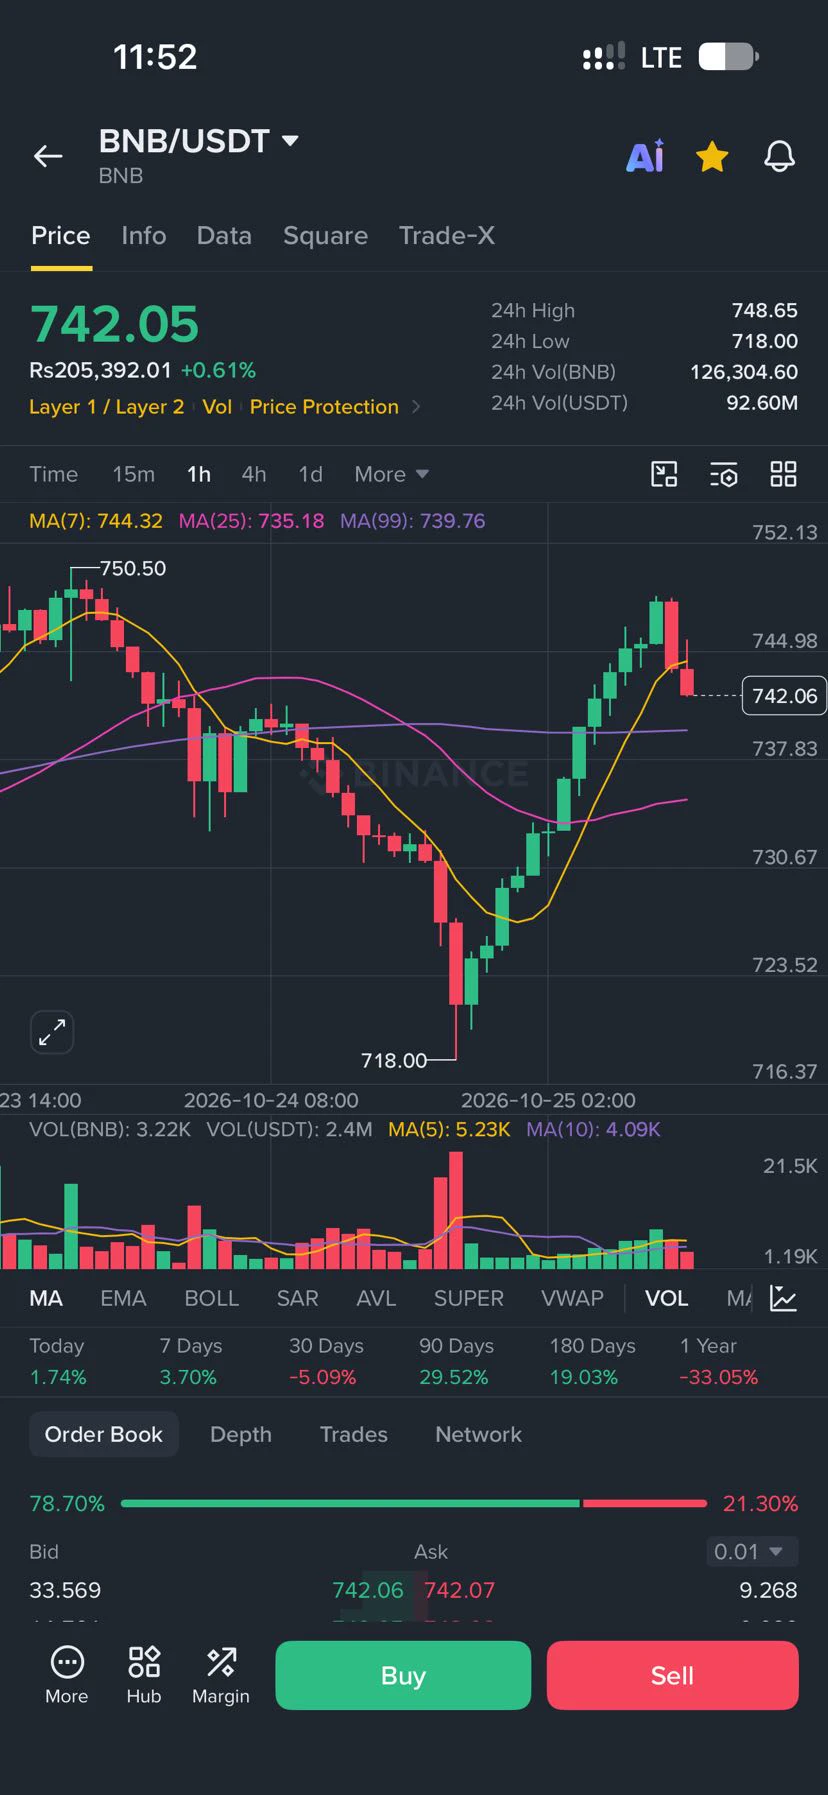
$BNB 1h
Low was 718, now 742.05, sitting just under the 7.
MAs: 744.32 right above price, 735.18 and 739.76 underneath.
Volume showed up on the dip and the recovery. Range today 718–748.65.
Watching 744 as the line. Lose it clean and the 99 is next. Hold it and 750 stays the reference.
Just the chart. Not a call.
#USEarningsSeason #GateWCTCS9GlobalTradingCompetition
post-image
BNB+1.10%
BITCOIN IS 9 DAYS AWAY FROM A MAJOR HISTORICAL TEST.
The U.S. midterm elections are set for November 3.
Look at what happened around previous midterm cycles:
2014: BTC dropped 65%
2018: BTC dropped 52%
2022: BTC dropped 27%
Now 2026 is approaching, and traders are watching the $73,000 support zone.
History points to serious downside risk, but those crashes weren't necessarily caused by elections.
Will Bitcoin break the pattern this time, or is another brutal correction waiting?
BTC-0.16%
Is Chainlink (LINK) about to break down, or is this the perfect short-squeeze trap?
Currently trading at $11.360, LINK is showing heavy bearish pressure on the intraday (1H) timeframe. The asset is trapped below its key moving averages, but a closer look at the momentum indicators reveals a conflicting story.
$LINK ‌
Here is the technical breakdown and the actionable trade plan .
📉 K-Line Analysis: The Bearish Structure
1. Trend & Moving Averages:
The chart is in a clear downtrend. The price is trading below both the EMA 20 ($11.570) and the EMA 50 ($11.727). Furthermore, the EMA 20 has cros
LINK-2.45%
Good moornings chat <3
Time to lock in and get some work and house chores done before the new week starts.
post-image
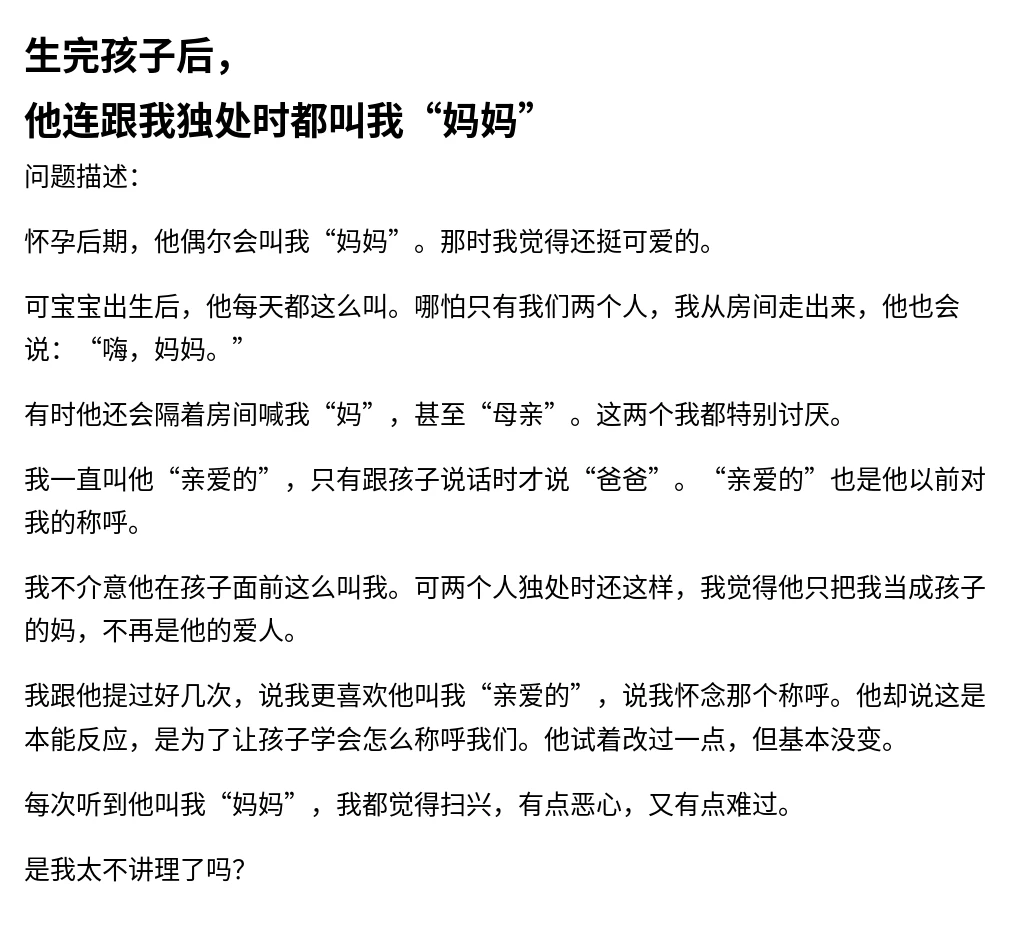
How many women have had their partner start calling them “Mom” after they’ve had a child?
Sometimes, being called that can actually create more distance between partners. What do you think?
post-image
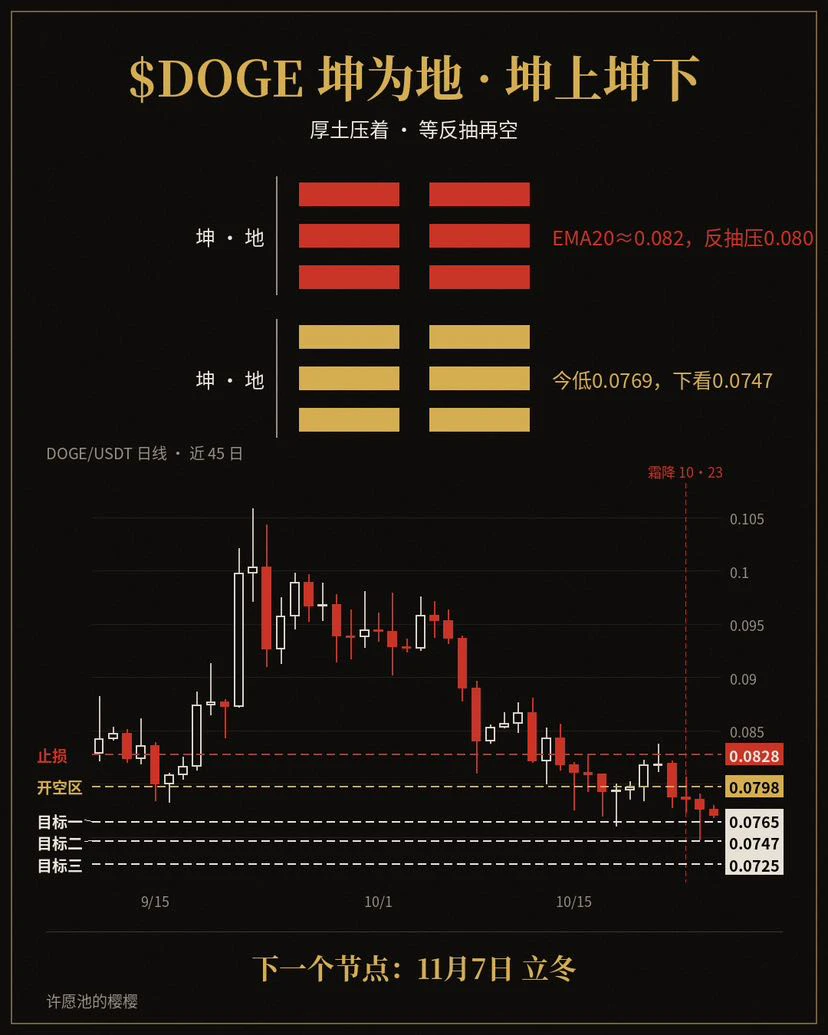
$DOGE Kun is Earth, with Kun above and Kun below. All six lines are yin, with heavy earth pressing down. The hexagram speaks of sinking and being unable to rise; over the past week, the price has slid from around 0.084, and the daily chart has remained firmly below the moving averages, reflecting that momentum.
The current price is around 0.0771, down about 1.7% in 24 hours. Yesterday, it plunged to 0.0747 before a weak bounce. Today, it opened at 0.0776, reached a high of 0.0780 and a low of 0.0769, and is still hovering near the floor. The daily EMA20 is around 0.0823 and the EMA50 around 0.
post-image
DOGE-1.33%
Load More

Join 40 M users in our growing community

⚡️ Join 40 M users in the crypto craze discussion

💬 Engage with your favorite top creators

👍 See what interests you

Trending Topics

USEarningsSeason

83.49k Views3.4k Discussing

The U.S. Q3 earnings season is in full swing, with major tech companies including Tesla and Meta reporting results. Market focus is shifting beyond revenue and profit toward AI spending, capital expenditure, margins and forward guidance. Which company’s earnings are you watching most closely?

GateWCTCS9GlobalTradingCompetition

674.15k Views7.98k Discussing

USConsumerSentimentNearRecordLow

8.72k Views259 Discussing

View More