
Square
Following
Hot
News
Notifications
Profile
Share your thoughts
placeholder
Article
Trying to punch above our weight failed
IG got completely crushed, 3:0
Time to start grinding points again
Good morning, recap
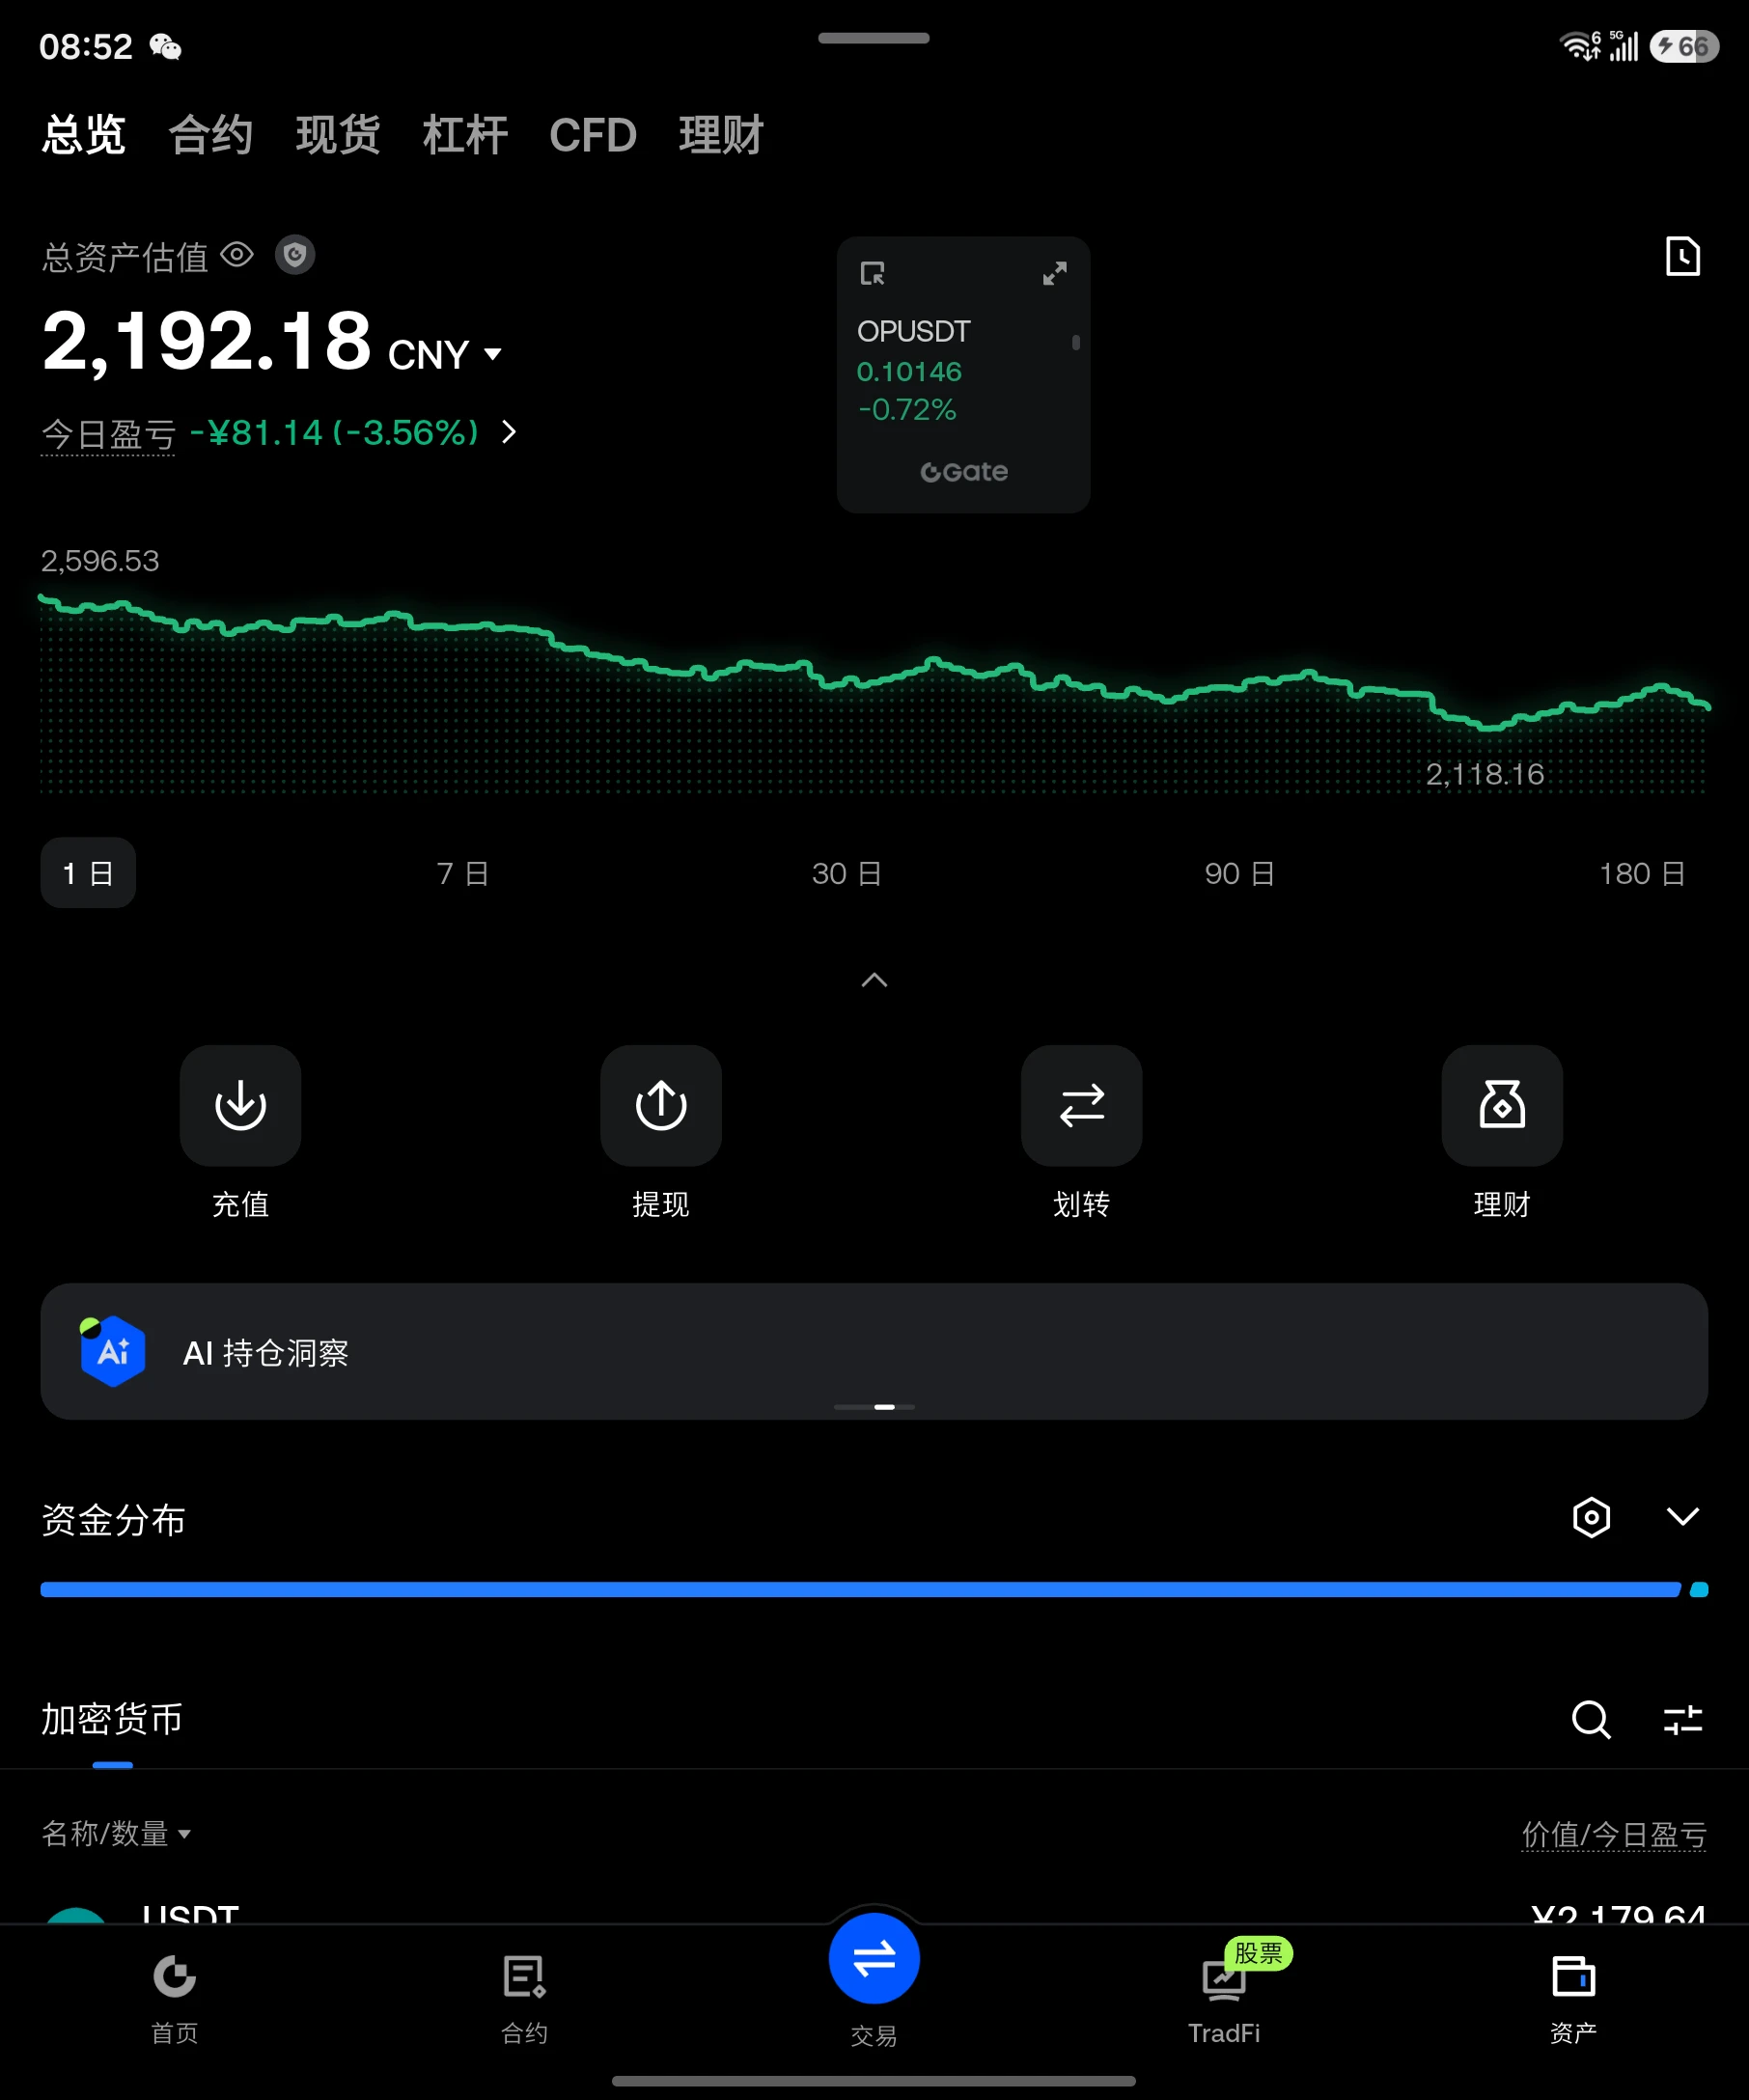
Continue holding the OP long position; the broader market, ETH, and OP are all showing a short-term bearish trend
Stay the course
Stay the course
post-image
OP-1.31%
ETH-1.26%
  • 2
Trenches
ZIG
Z
bade
b
ZIG
0x8c...1145
Market Cap
$.
Change
.
24h Vol
$.
Holders
.
STONK
S
bade
b
STONK
6GmA...UNgx
Market Cap
$.
Change
.
24h Vol
$.
Holders
IDOL
I
bade
b
IDOL
0x3b...ab07
Market Cap
$.
Change
.
24h Vol
$.
Holders
.
FLOAT
F
bade
b
FLOAT
Bv1a...BMmr
Market Cap
$.
Change
.
24h Vol
$.
Holders
.
CLAUDIA
C
bade
b
CLAUDIA
2j5S...W2ZM
Market Cap
$.
Change
.
24h Vol
$.
Holders
.
🌈 Gate Live Streaming Inspiration - November 8

Trending Topic Recommendations:
🔹 Vitalik Buterin Says SHIB Donation Worth Hundreds of Millions of Dollars Exceeded Expectations
🔹 Bitcoin Doesn’t Need Banks, but Strategy Wants to Become a Bitcoin Bank
🔹 Former FBI Agent Admits Stealing $2.47 Million in Cryptocurrency, Faces Up to 20 Years in Prison
🔹 Cyber Bought Back Approximately $13 Million Worth of CYBER Tokens Over the Past Year
🔹 Bitcoin ETFs See $412 Million in Net Outflows, with BlackRock IBIT Seeing $403 Million in Net Outflows
🔹 Prediction Markets Put the Odds of Bitcoin Rising
post-image
SHIB-1.28%
BTC-0.67%
CYBER-5.40%
BLK+0.60%
GNO-1.28%
  • 8
  • 2
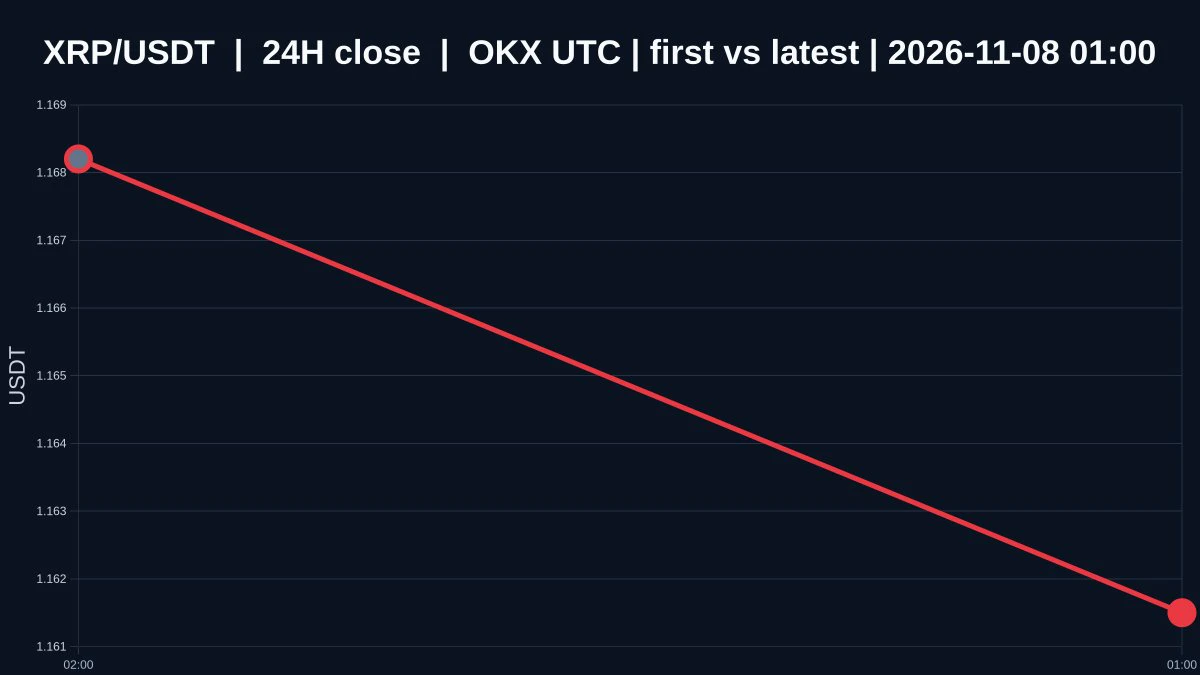
After $XRP falls to 1.1615, “oversold” describes a condition; “bottoming” is a confirmed outcome

$XRP is currently priced at 1.1615, down 1.5928153859188332% over 24 hours, with an intraday low of 1.1495 and a high of 1.1821. The 1-hour and 4-hour trends are both weak, and the volume ratio is 0.016443218238901016. A sharp drop only shows that selling pressure has occurred; it doesn’t automatically mean the price is cheap, much less prove that buyers are actually defending the area around 1.1495. A rebound may be due, but until the structure stops weakening, I won’t call oversold conditions a
post-image
XRP-1.15%
Support and resistance levels are among the most fundamental and practical concepts in technical analysis. Many traders study candlesticks and indicators every day, yet overlook an important question: at which price levels are buying and selling pressure likely to shift?
First, a support level is an area where buying pressure may increase as the price falls. When the price approaches this level, some buyers may start entering the market, slowing the decline. But a support level does not mean the price definitely won’t break below it.
Next, a resistance level is an area where selling pressure m
BTC-0.67%
The first earthquake of magnitude 5 or higher in Aichi Prefecture, Japan, since 1997
We all know that tectonic plates drift and pressure in the Earth’s crust builds up slowly over many years; earthquakes generally don’t happen easily,
but when one does occur, it may be a precursor to an even larger earthquake.
Does this mean a major wave of earthquakes is coming,
including the Nankai Trough megathrust earthquake—the one Japanese people fear most, which has been forecast for over 30 years—
Is it finally coming?
post-image
#Ahr999EntersBottomBuyingZone
The Ahr999 index has dropped back below 0.45.
As of November 7–8, 2026, the reading sits around **0.43**, placing Bitcoin firmly in the historical “bottom-fishing” or accumulation zone for the first time since late August. Bitcoin itself is trading near **$75,000–$76,000**, down sharply from recent levels amid broader risk-off pressure from the AI-stock selloff.

This is not a casual signal. For long-term Bitcoin accumulators, especially those who use dollar-cost averaging with a timing overlay, Ahr999 crossing back under 0.45 has historically marked periods of d
BTC-0.67%
  • 4
$SOXL Copy the bot below for free to increase returns and reduce risks.
SOXL-1.16%
Trump’s counterattack is here! He orders an investigation into Democrats and wants the UFC president to storm the White House with world fighting champions!
Just after the U.S. midterm elections, Trump publicly called on the Justice Department to investigate Democrats, accusing them of threatening government officials and Republican supporters with impeachment, imprisonment and other tactics. He even singled out Democratic Senator Elissa Slotkin and called for her to be held accountable for alleged “extortion.”
Americans’ sense of humor is unbeatable. At a time like this, Trump was still fucki
When all the political news has settled and become clear, the semiconductor sector may already have made a move. But that still isn’t a reason to buy the dip today. $SOXX
Market prices never patiently wait for projects to be fully implemented and every risk to be conclusively proven to have disappeared before they start moving. If subsequent developments turn out better than initially feared, buyers may return early. In other words, caution itself comes at a cost: by the time you have enough evidence, the entry price may already have risen considerably. This cost must be acknowledged; you can
post-image
SOXX-0.31%
$SOL Can it make it back to $200? This question has been asked a lot lately. First, let’s look at some real data: one trader shared a portfolio showing $SOL down 1.32% and $GIGGLE down 2.25%, yet the cumulative PnL was +1,042.83 USDT—showing that they rely not on simply holding one coin, but on timing and position management. Back to SOL itself: $200 won’t happen just because people call for it. It depends on whether on-chain activity can remain strong, whether ecosystem projects have new narratives, and whether broader market liquidity is favorable. SOL’s last rally was driven by the meme
post-image
GIGGLE-1.51%
Great, $AIN continues to rebound. I want to follow the momentum and go long again; the uptrend is quite clear😍😍😍$AKE $KOMA 😍😍😍
post-image
AIN+3.85%
AKE+6.07%
KOMA-3.91%
$PI Whenever you buy, it's the peak
post-image
PI-0.60%
  • 1
BTC market update
live-cover
LIVE2,882
As everyone knows, when you travel, you either split the costs (AA) or use the AB method.
post-image
morning ubdate
live-cover
LIVE1,481
Wall Street Suddenly Changes Its Tune! BTC ETFs See $870 Million in Outflows in One Week—Are Institutions Fleeing or Just Stepping Out to Use the Bathroom?

Bitcoin has been in an awkward spot lately. We thought Wall Street was here to give it a lift, but before the ride had even gotten underway, institutional investors started pulling their money out!
U.S. spot BTC ETFs recorded nearly $870 million in cumulative net outflows this week—not a small amount. Institutional capital, once seen as the engine behind Bitcoin’s rise, now seems to have suddenly sensed something was off and slammed on the
AMD+11.55%
#TRX

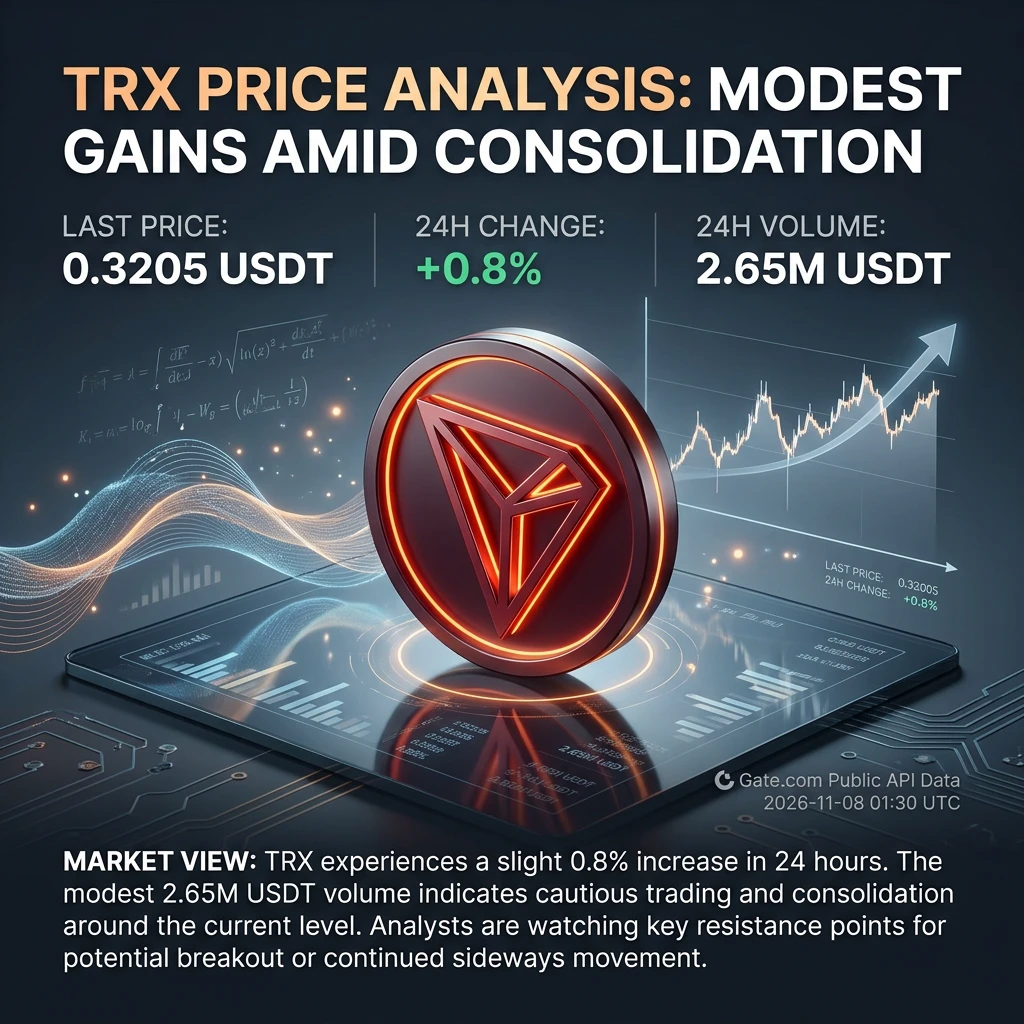
TRX Holds Near $0.32: What Is Supporting the Price, and What Could Change the Picture?

A Small Move, but What Does It Tell Us?

Imagine checking your crypto portfolio in the morning and seeing TRX slightly higher than the previous day. The price has not made a dramatic jump, but it is moving in a positive direction. Is this the beginning of a stronger recovery, or simply a period of normal market movement?

As of November 8, 2026, at 01:30 UTC, TRX/USDT was trading at $0.3205, recording a 24-hour increase of 0.8%. Its 24-hour trading volume was approximately $2.65 million USDT.

This i
post-image
TRX+0.42%
BTC-0.67%
Can you imagine?
This is your boss’s eldest son.
He knew how it started, but not how it would end.
Is anyone really still selling
$GTC here? It feels like we’ve been watching this support line for a long time, waiting for a rebound that never seems to start. You’d think sellers should be running out of steam by now, but the chart is just stuck in this strange, quiet cycle.
Take profit: 0.16839 Stop loss: 0.15136 Market movers:
$SOL : Current price 89.37 - 24-hour change: -0.84%
$SWARMS : Current price 0.007535 - 24-hour change: +19.13%
post-image
GTC
GTC芝麻币
Gate.Fun
MC:$0.1Holders:1
0%
SOL-0.77%
SWARMS-3.61%
Load More

Join 40 M users in our growing community

⚡️ Join 40 M users in the crypto craze discussion

💬 Engage with your favorite top creators

👍 See what interests you

Trending Topics

USCPIDataIncoming

188 Views1.46k Discussing

The U.S. October CPI report will be released on November 10 at 8:30 a.m. ET. September CPI came in at 3.7% year over year, and markets will be watching closely for signs that inflation is cooling, especially in core CPI. A softer-than-expected reading could strengthen rate-cut expectations, while hotter inflation may pressure risk assets through higher Treasury yields and a stronger dollar. How do you think this CPI print will move $BTC, U.S. stocks and gold?

USAIStocksHitHard

23.2k Views3.69k Discussing

USNonfarmPayrolls

39.23k Views4.37k Discussing

View More