
Share your thoughts
placeholder
Article
【$BUS Signal】Go long on 1H pullback support
$BUS The buy/sell order book depth ratio is 1.13, with buy-side order volume leading. The 1H RSI is 62.23, while the 4H candlestick surged and retraced to 0.1774, with MA20 providing support. The 1H MACD histogram turned negative, but buy-side depth remains strong, with clear support around 0.1768.
🎯 Direction: Long
⚡ Entry/Limit Orders: Scale in within the 0.176868-0.177400 range
🛑 Stop Loss: 0.175626
🚀 Target 1: 0.180061
🚀 Target 2: 0.181391
🛡️Trade Management:
- Execution Strategy: After reaching Target 1, reduce the position by 50% and mov
post-image
BTC-0.03%
ETH+0.91%
SOL+1.59%
【$BULL Signal】Long|1H middle-band convergence, high funding-rate pressure
$BULL 1H is converging along the middle band, with RSI at 71.54 on 4H and 69.02 on 1H; MACD histogram bars are shortening on both timeframes. Volume plunged from 1.5B to 0.07B, showing a break in buying momentum. The funding rate is 0.1175%, indicating high leverage costs. Order book depth imbalance is -0.51%, with bids and asks nearly balanced.
🎯Direction: Long
⚡Entry/limit order: 0.08422457 - 0.08447800
🛑Stop-loss: 0.08363322
🚀Target 1: 0.08574517
🚀Target 2: 0.08637876
🛡️Trade management:
- Execution strategy: Aft
post-image
BTC-0.03%
ETH+0.91%
SOL+1.59%
I originally wanted to cut my losses as a sacrifice to heaven, but heaven never got its offering—the meat cooked itself.

When I checked the charts after lunch, TSLAX surged again. I stared at the price action for quite a while. The resistance above was obvious, and every push higher fell just short—the bull-trap smell was far too strong. Not shorting it here would have let myself down after watching the chart for so long.

Putting risk control first is called rationality; cutting after taking a loss is called heroically cutting off a limb.

The script afterward was easy to guess: after ent
post-image
TSLAX+0.96%
XRP+1.22%
BNB+7.19%
Men just want one thing...
post-image
Most traders think XLM is dead—what if the range itself is the trap?

$XLM /USDT - SHORT

Trade Plan:
Entry: 0.18423 – 0.18501
SL: 0.18837
TP1: 0.18181
TP2: 0.17993
TP3: 0.17712

Why this setup?
- 4h bias is SHORT with 55% confidence—not a slam dunk, but a lean.
- Price sits at 0.18462, right at the range midpoint—no momentum, just indecision.
- RSI 15m at 58 shows weak bounce, but ATR 1h (0.00156) says volatility is shrinking—breakouts will be sharp.
- Targets: TP1 at 0.18181, TP2 at 0.17993—that's a 2.5% drop from here. In a range, the middle is the worst place to be long.

Debate:
post-image
XLM+2.63%
Most traders just watched $LINK /USDT break 12.00—but the 4h tape says the real squeeze hasn't even started.

$LINK /USDT - LONG

Trade Plan:
Entry: 11.981 – 12.031
SL: 11.764
TP1: 12.188
TP2: 12.309
TP3: 12.490

Why this setup?
Why now? The 1D trend is bullish, and 1h ATR (0.10) is tight—a classic coil. RSI 15m at 60.04 leaves room to run, not overbought. Entry 12.006 with TP2 at 12.309 is only +2.5% away, but the structure (SL at 11.764, invalidation at 11.372) gives a 4:1 reward-to-risk. The 95% confidence isn't noise; it's the 4h timeframe confirming the daily bias.

Debate:
Is $LINK /
LINK+2.52%
MARKET ALERT - PEPE/USDT
analysis and trading opportunities.
​4-Hour Timeframe Analysis (TF 4H)
​Market Condition: The price is at 0.000003631, above the 20 EMA (0.000003567) and 50 EMA (0.000003583). This indicates a short-term rebound and positive consolidation above the 200 EMA (0.000003337), which is acting as strong support.
​Trading Opportunity: Potential Long (Buy) if the price holds above the 50 EMA. The nearest resistance target is in the 0.000004153 to 0.000004558 range. Set the Stop Loss (SL) below the 200 EMA, around 0.000003300.
​1-Day Timeframe Analysis (TF 1D)
​Market Condition:
post-image
PEPE+0.95%
BTC-0.03%
ETH+0.89%
  • 3
Everyone’s cheering DOGE at 0.0908, but the 4H tape just whispered a secret the crowd missed.

$DOGE /USDT - SHORT

Trade Plan:
Entry: 0.09055 – 0.09123
SL: 0.09417
TP1: 0.08843
TP2: 0.08679
TP3: 0.08432

Why this setup?
Why now? The 1D is range-bound, not trending—so rallies are rentals, not ownership. RSI on the 15m is hot at 60, but that’s exhaustion fuel, not ignition. With ATR at 0.0013, the squeeze is coiled. The primary path targets 0.0884 (TP1) then 0.0867 (TP2)—a 4.5% drop from here. The alternate longs only trigger if we break 0.0912 with force, but confidence sits at 55% SHORT, m
DOGE+7.17%
This move doesn't even require me to think—the account is dancing on its own. When the screen was all green, everyone was selling at a loss, but I didn't panic watching the market. It was bottoming without breaking support, while funds quietly entered—the signal worked better than any analysis.

$SNDK $LAB
post-image
SNDK+2.07%
LAB+1.90%
Everyone’s staring at the green ticker, but the 4H chart just whispered a 95% secret about $LAB /USDT.

$LAB /USDT - SHORT

Trade Plan:
Entry: 0.07439 – 0.07489
SL: 0.07700
TP1: 0.07287
TP2: 0.07169
TP3: 0.06992

Why this setup?
- The daily trend is **bearish**, and confidence is a rare 95/100—this isn’t a coin flip.
- Price is hovering at 0.07464, but the real gravity pulls toward TP1 at 0.07287 and TP2 at 0.07169.
- RSI on the 15m (51.65) shows zero bullish momentum—just a lazy pause before the next leg down.
- Why now? The 1h ATR (0.000984) is tight, meaning the breakdown will be e
LAB+1.90%
BTC and ETH Face Another Important Resistance Test After Recent Price Gains
live-cover
LIVE371
Fed Cut Hopes May Strengthen if the Labor Market Shows Further Signs of Cooling
live-cover
LIVE370
I just came across a post on Facebook made by the FCT Police Command.
​The parents abandoned the child, so I don't see any reason for them to ask for information about the parents just to give the child back to them.
​If they had the mind to abandon the child in the first place, why assume they would take the child back and care for him or her?
​Unless they are just using this as a tactic to track down, arrest, and prosecute the person who abandoned the child.
post-image
Most traders will ignore HOME/USDT right now—that’s exactly why I’m watching it.

HOME/USDT - SHORT

Trade Plan:
Entry: 0.0061 – 0.0061
SL: 0.0062
TP1: 0.0060
TP2: 0.0060
TP3: 0.0059

Why this setup?
Why now? The 4h signal screams SHORT with 95% confidence, but the 15m RSI (51.28) hasn’t confirmed weakness yet. That’s the trap—waiting for exhaustion that already happened on the 1D bearish trend. Entry at 0.0061, TP1/TP2 stacked at 0.0060, TP3 at 0.0059. The ATR (4.4e-05) says moves are tight, but the trend says they’re relentless. Price is sitting at a pivot—if 0.0061 breaks, the slide is m
HOME+1.00%
This is everything you need to know
#晒出我的持仓收益 You can enter first, or check yesterday’s post and wait for a wick to enter#BTC收复8万美元
post-image
BTC-0.03%
Everyone’s chasing the 15m RSI bounce on $ESPORTS /USDT—but that’s exactly where the trap snaps shut.

$ESPORTS /USDT - SHORT

Trade Plan:
Entry: 0.01484 – 0.01492
SL: 0.01527
TP1: 0.01459
TP2: 0.01439
TP3: 0.01410

Why this setup?
- Daily trend is **bearish**, and the 4h setup is screaming SHORT at 95% confidence.
- The 15m RSI at 56.89 is a weak pullback, not a reversal—price is stalling under the 0.01488 pivot.
- Why now? ATR (0.000163) shows tight coils; the next leg down targets 0.01459 (TP1) and 0.01439 (TP2) before the daily close.
- The invalidation at 0.01530 is clear—risk is
ESPORTS+1.29%
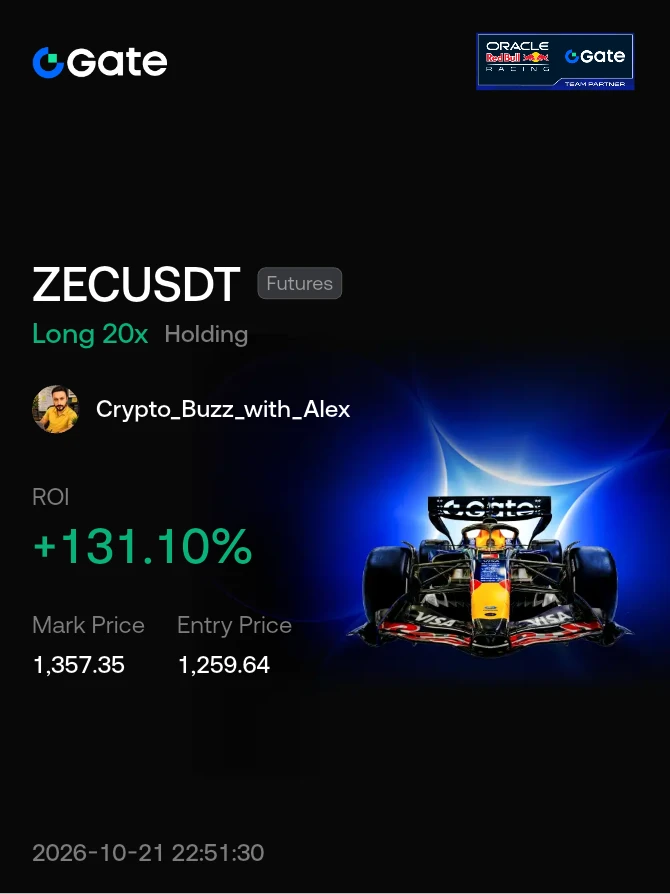
While everyone else crowds into the fishing ponds of hot coins to fight over scraps, I chose to cast my net in the backwater of $MUBARAK USDT. With 50x leverage, an entry price of 0.02822, and the latest price at 0.03292—an ROI of +802.64%! This isn’t fishing; it’s blowing up the pond with a torpedo.
Some say obscure coins are garbage dumps. I say they’re forgotten treasure vaults. MUBARAK traded sideways like a dead fish for a while, shaking out every impatient retail trader. I crouched in the corner, silently reciting Wyckoff theory: “Selling pressure exhausted, smart money entering.” In rea
post-image
MUBARAK+10.36%
BTC-0.03%
ETH+0.89%
SKYAI’s 95% short signal is screaming, but the 15m RSI just hit 65—who’s buying this fake bounce?

$SKYAI /USDT - SHORT

Trade Plan:
Entry: 0.06033 – 0.06095
SL: 0.06357
TP1: 0.05844
TP2: 0.05698
TP3: 0.05478

Why this setup?
Why now? The 4h timeframe is loading a bearish cannon, and the daily trend confirms the floor is giving way.
- Entry zone: 0.06064 (tight range 0.06033–0.06095) is your launchpad.
- Targets: TP1 at 0.05844, TP2 at 0.05698—that’s a 6% drop from here.
- Stop at 0.06357 is wide enough to breathe, but tight enough to punish dreamers.
- ATR (1h) at 0.001221 means vo
SKYAI+5.45%
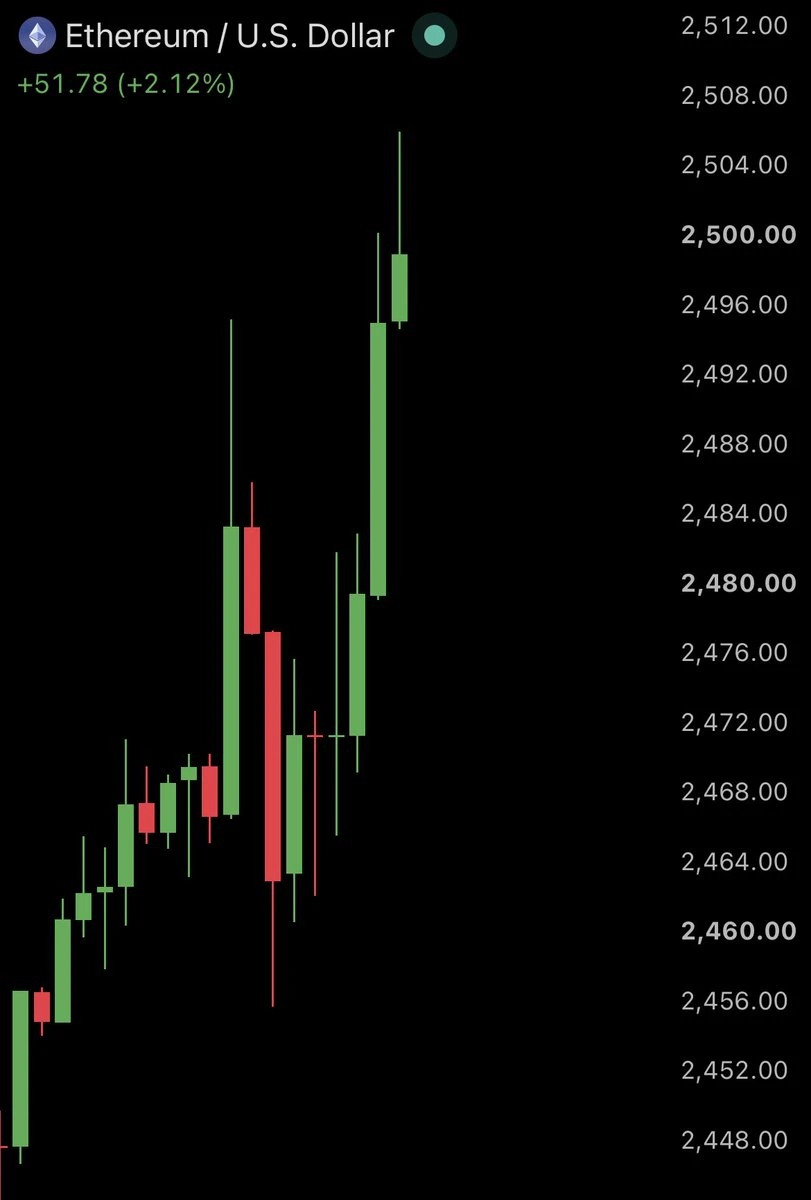
Feels good, brothers. But the position management is still the same: take profit on 80% first—don’t be greedy for the last bite. Move the stop-loss on the remaining 20% closer to the entry price and let it run; however much profit it makes is pure profit. Don’t turn unrealized gains into losses.

$ETH $LAB
post-image
ETH+0.89%
LAB+1.90%
Load More

Join 40 M users in our growing community

⚡️ Join 40 M users in the crypto craze discussion

💬 Engage with your favorite top creators

👍 See what interests you

View More