Square
Following
Hot
News
Notifications
Profile
Share your thoughts
placeholder
Article
$AKE I don't know if I can withstand the next needle
post-image
AKE+6.07%
☀️ GM. Weekend countdown: charts or chill?
US October PPI drops today at 13:30 UTC. After a volatile week, will you keep watching the markets or take a breather?

📌 Today's topic: What's your weekend mode?
📈 Watching: Which asset is on your radar? What signal are you waiting for?
📝 Reviewing: Which trade deserves a second look? What did you learn this week?
☕ Relaxing: Logging off—or still sneaking a peek at the charts?

🎁 Post to claim a red packet. Share your weekend plans or trading stories on Gate Square, with bigger bonus red packets dropping at random. Quality posts may also get feat
  • 1
Trenches
mihao
m
bade
b
mihao
4Cxj...pump
Market Cap
$.
Change
.
24h Vol
$.
Holders
.
IDOL
I
bade
b
IDOL
0x3b...ab07
Market Cap
$.
Change
.
24h Vol
$.
Holders
.
FOOD
F
bade
b
FOOD
FTu5...pump
Market Cap
$.
Change
.
24h Vol
$.
Holders
.
AGT
A
bade
b
AGT
0x5d...e274
Market Cap
$.
Change
.
24h Vol
$.
Holders
.
NIO
N
bade
b
NIO
7SL2...pump
Market Cap
$.
Change
.
24h Vol
$.
Holders
.
Water buffalo pure milk—I’ve always wondered where they get so many water buffalo to produce milk.
After checking the ingredients, I finally understood: raw buffalo milk makes up only 20%!!!!
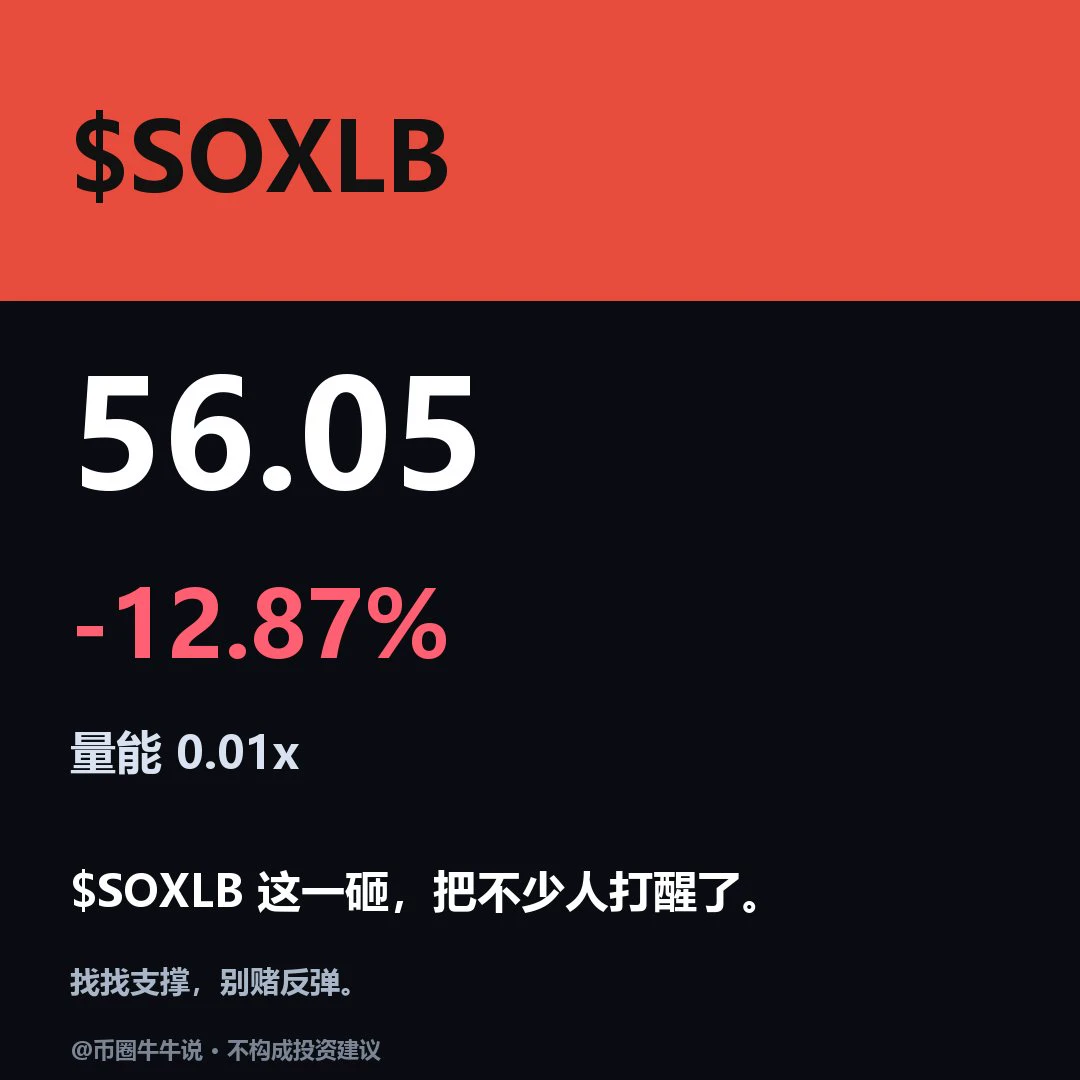
$SOXLB Currently at 56.05, down 12.87% over 24 hours. The 1H trend is weak: RSI 21.27, EMA20 57.19, support at 52.43, resistance at 66.91. The 4H trend is weak: RSI 40.74, EMA20 59.30, support at 51.01, resistance at 69.71. If it holds above the 66.91 resistance level, a short-term rebound may follow; if it breaks below the 52.43 support level, it may test lower levels. In the next review, watch whether it can hold above 66.91 and whether it can recover after losing 52.43. Volume is only 0.006 times average, so a single break above or below a level needs confirmation of participation. Market v
post-image
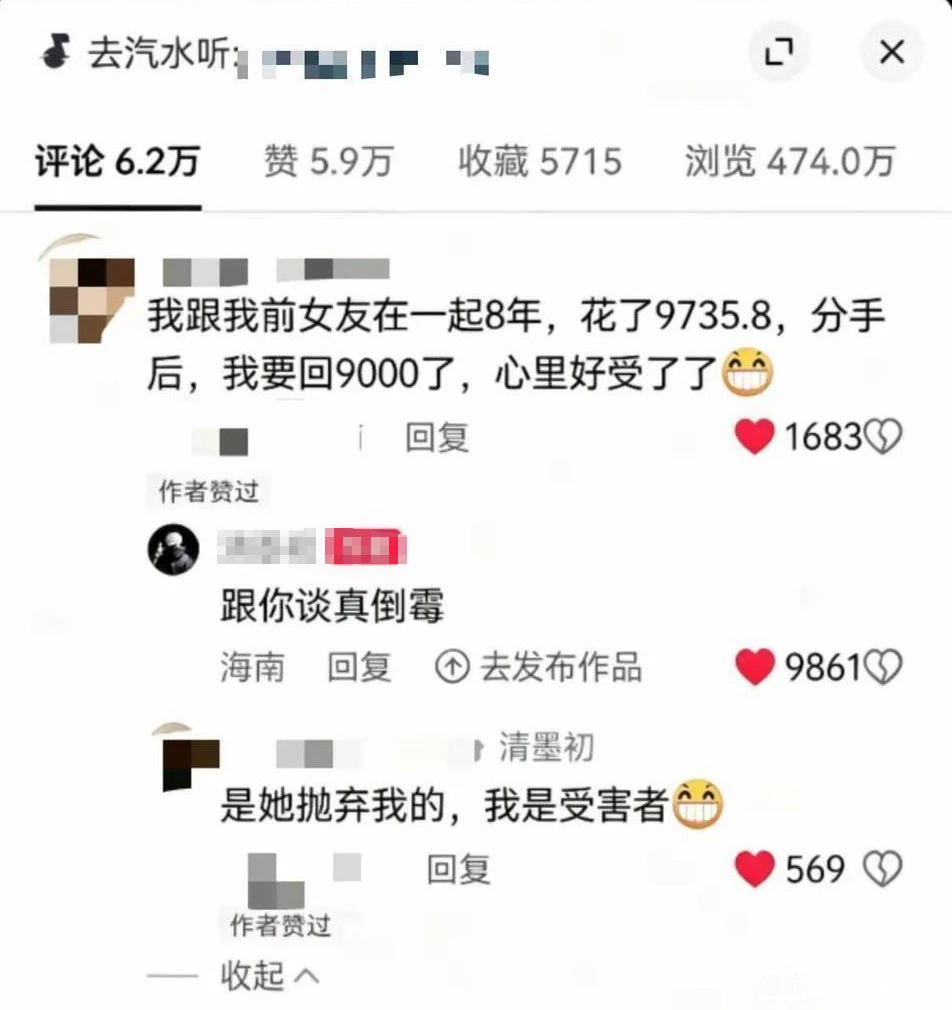
I can't even imagine
how you'd face your family after doing something like this in front of everyone.
Oh my God! How did he get this woman to dump him only after 8 years?
post-image
new market update
live-cover
LIVE1,899
#AnthropicIPO6xOversubscribed Anthropic IPO Is 6x Oversubscribed: What This Powerful Investor Demand Really Means for AI, Technology Stocks and Global Markets

Anthropic's reported six-times-oversubscribed IPO has become one of the most important signals of investor appetite for artificial intelligence in 2026. The message is clear: demand for a leading AI business is exceptionally strong, and investors are competing for access to its shares.

1. Anthropic's IPO demand is six times greater than the available supply
Imagine a company offers 100 million shares to investors. If valid orders are
  • 11
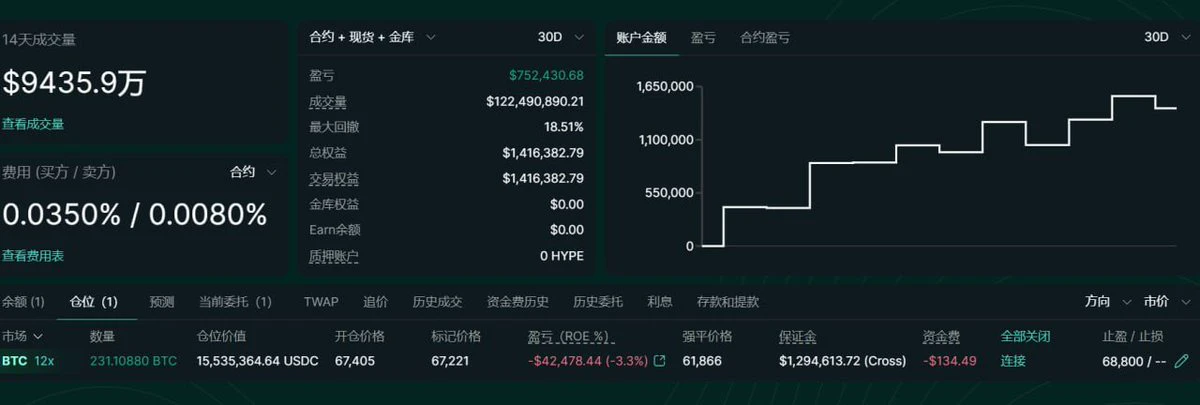
A whale has opened 231 BTC long positions at 67405, with take-profit at 68800 and liquidation at 61866. The whale really believes in 8 😂
post-image
BTC-0.65%
To sum up the current $BTC data: In terms of contract leverage, longs are still adding positions and haven't given up yet. The funding rate briefly turned negative during trading yesterday afternoon, then turned positive again before the market closed this morning. (Figure 1) Looking at the spot holder cost structure, the 2–3 million BTC held by buyers who entered in the 750000 to 85000 range have only seen a slight amount of selling at a loss, indicating that the current downturn has had a relatively limited shakeout effect on spot investors. (Figure 2) The Bitcoin Ahr999 Index shows that Bi
post-image
BTC-0.67%
PENGU is trending but has no bids; I'm going long against the 0.872 long/short ratio
It's trending on CoinGecko, but the bids haven't followed through—$PENGU 24h is still down 4.035%, and the current price of 0.005827 is near the floor. I'm bullish at this level.

The 30-day range position is down to just 0.014. The 7-day loss of 9.14% and 30-day loss of 23.49% are already in—this is an accumulation zone with nowhere left to fall.

The long/short account ratio is 0.872, the funding rate is near zero with no one rushing in, and OI is still up 2.08% versus yesterday's snapshot—the accounts are l
PENGU+0.40%
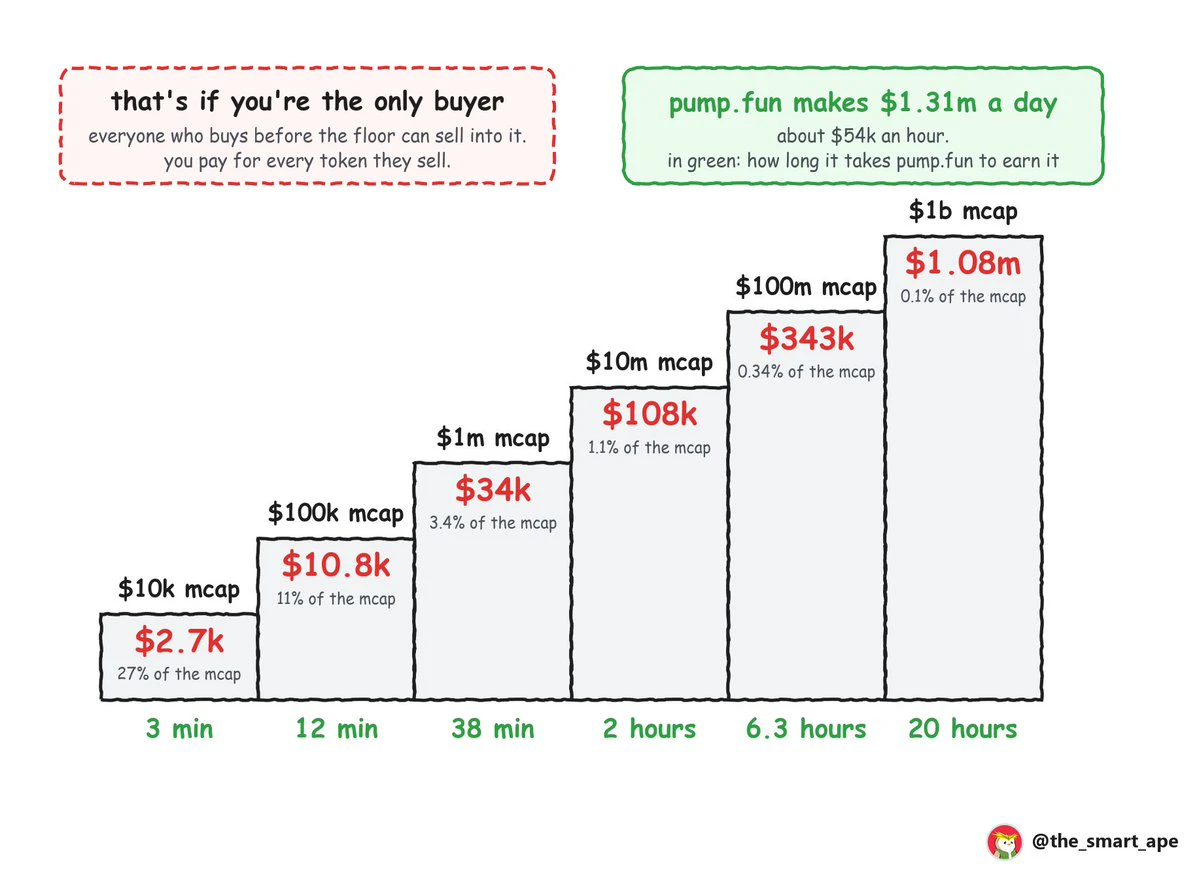
how much does it cost to put a floor under a @Pumpfun coin at:
$10k mcap → $2.7k
$100k mcap → $10.8k
$1m mcap → $34k
$10m mcap → $108k
$100m mcap → $343k
$1b mcap → $1.08m
that’s if you’re the only buyer.
now compare that with pumpfun’s revenue:
> pumpfun made $1.31m yesterday. that’s ~$54k an hour
> 38 minutes of revenue is enough to hold a coin at $1m
> 20 hours of revenue holds one at $1b
> one full day holds a coin at $1.46b
post-image
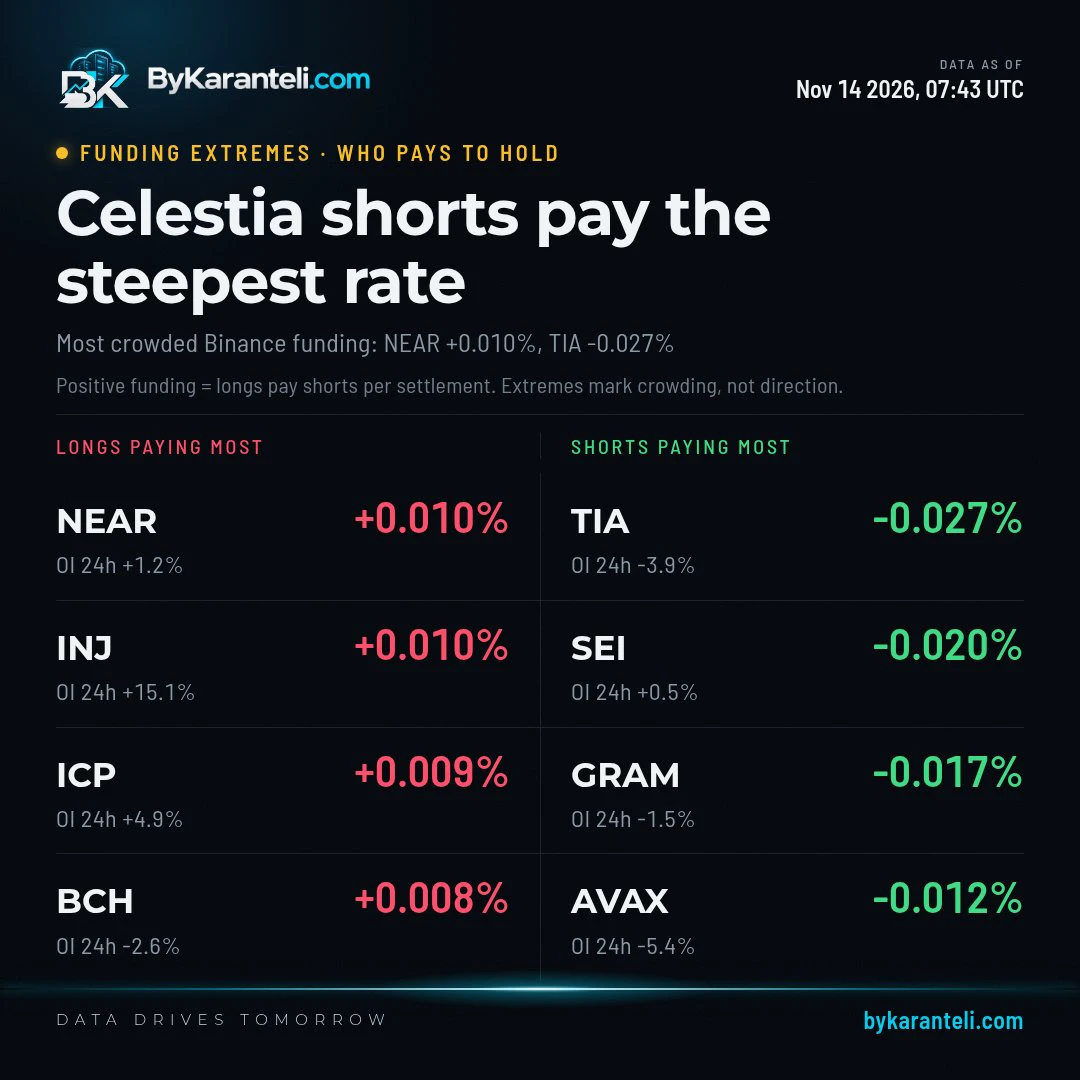
Betting against $TIA costs more than on any other coin on our board, a -0.03% funding rate that shorts pay longs, and yet open bets shrank 3.86% in 24 hours. Fewer positions are left carrying that bill.
post-image
TIA-0.57%
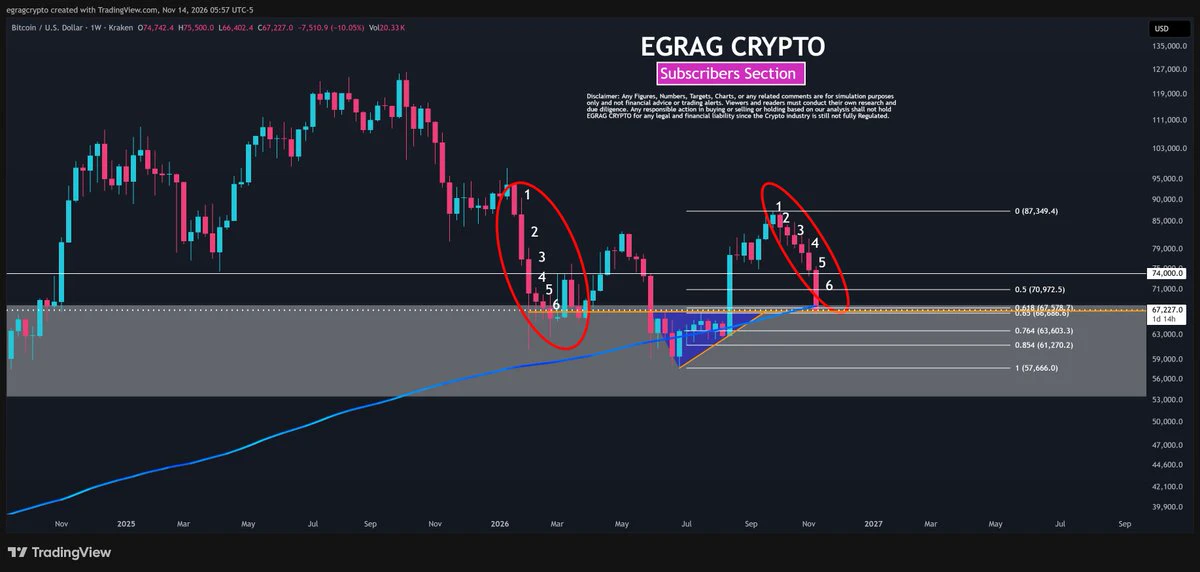
#BTC – IN JUST 1 DAY & 13 HOUR:
THE 6TH CONSECUTIVE RED WEEKLY CANDLE COULD BE CONFIRMED! 🔴
post-image
BTC-0.67%
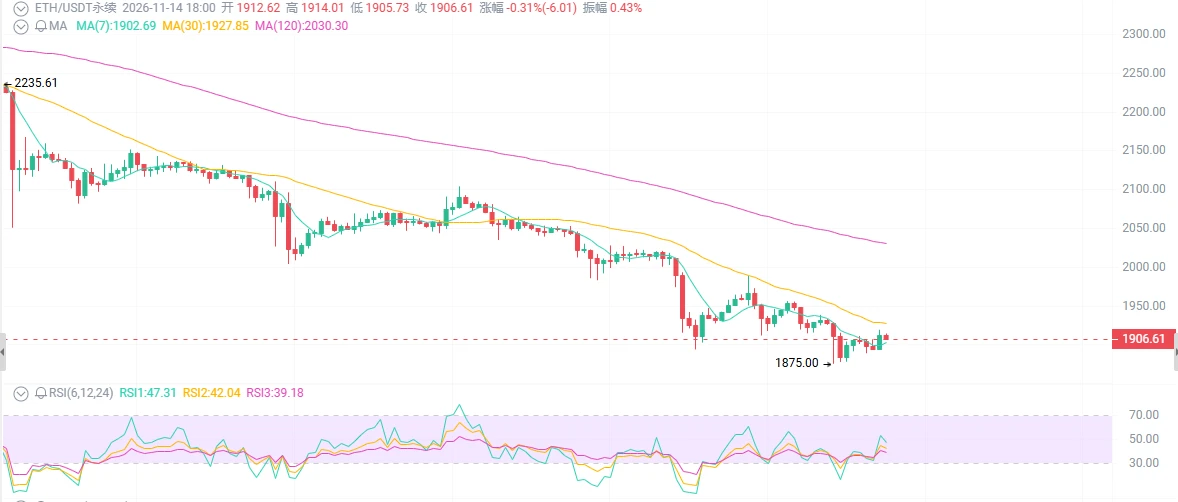
ETH at $1906—are you panicking?
RSI has plunged to 23, down over 15% in 7 days, ETFs are seeing outflows, the Foundation is selling, and an upgrade has been delayed—but just as everyone is calling ETH garbage, the amount staked has hit a record high, with 43.6 million ETH locked on-chain. Is this the final dip, or is the abyss only just beginning?

First, the surface: it’s all bad news, each item more painful than the last.

The price has fallen below $2000, the “ironclad floor” everyone believed in, and is now at $1906. It’s down 1.5%-4% in 24 hours, over 15% in 7 days, and over 20% in 30 day
post-image
BTC-0.67%
ETH-1.26%
AKE+6.07%
  • 1
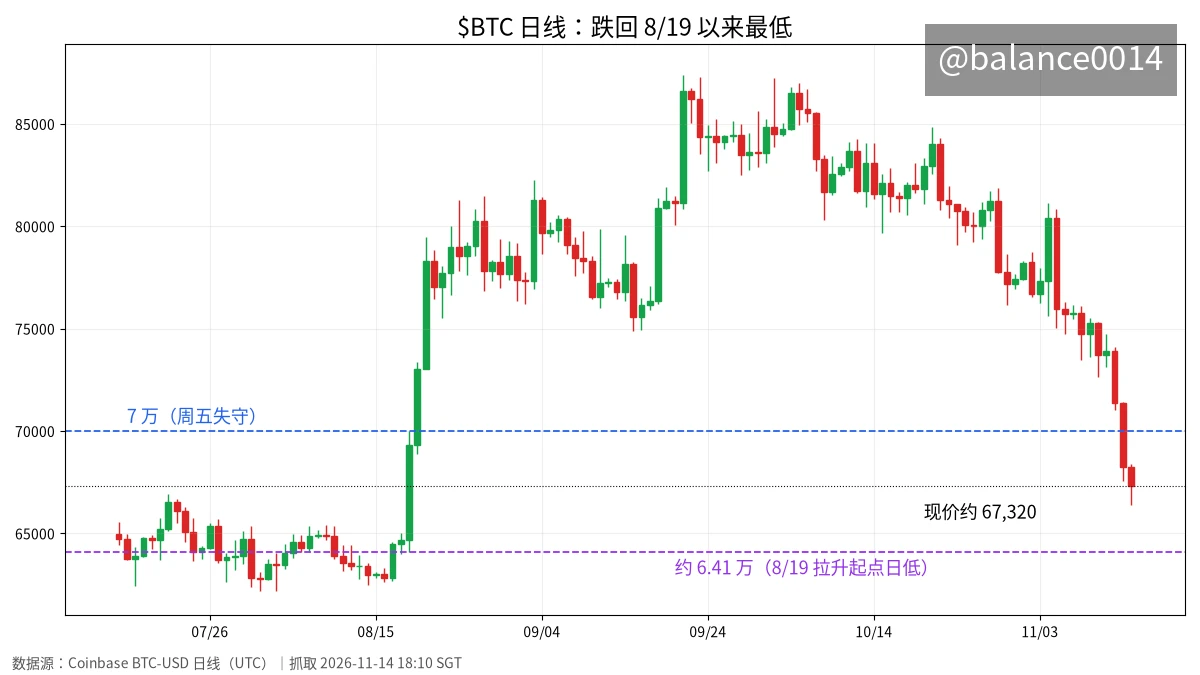
Early Saturday, $BTC crashed through 67k, hitting its lowest level since August 19. Anyone still holding longs over the weekend probably couldn't sleep.
🔥 There was no new bad news this time; leveraged longs are being liquidated in a cascade. At the worst point, around $250 million was liquidated in just 10 minutes, sending prices sharply lower.
Around $1.26 billion in positions were liquidated across the market over the past 24 hours, 86% of them longs. The Fear & Greed Index fell to 13, in extreme fear territory.
There were no buyers on the way down because, after PPI, the market is still
post-image
BTC-0.67%
$BTC I sketched out the weekly chart for BTC, and a lot of people commented that the 4-year cycle is over. I want to know how it’s over—is BTC going to break below a new low and never recover? It’s too early to say the cycle is over. At the very least, BTC would have to break below the previous low to confirm that the cycle is over. If BTC hasn’t made a new high by 2028, then the cycle is definitely over, right? So the trajectory in Chart 1 assumes the cycle is still intact. We all agree on the overall direction: bullish. So the question now is whether 57 is the bottom. If this pullback doesn’
post-image
BTC-0.67%
Load More

Join 40 M users in our growing community

⚡️ Join 40 M users in the crypto craze discussion

💬 Engage with your favorite top creators

👍 See what interests you

Trending Topics

GateIPOAccessAnthropic

310.9K Views2.8K Discussing

Gate IPO Access Phase 3 features Anthropic (ANT), with USDT subscription interest starting from 100 USDT. Successful allocations will be delivered as real shares to Gate Stock Accounts. Indicative price: $70–$78/share Subscription: Nov 12–17 (UTC+8) Allocation is not guaranteed. Please manage risk accordingly.

Dr.HanOxfordUnionSpeech

147.6K Views597 Discussing

USOctoberPPIBelowExpectations

463.2K Views1.5K Discussing

View More