Share your thoughts
placeholder
Article
This trend is so obvious I don’t even need to think—the account is dancing by itself 😂 I had just finished reading the bearish news, and the market slid another notch, with the short side starting to perform on its own.
Before the market had fully kicked off, I already felt that the rebound was off. Several consecutive rebound attempts were all pushed back down, with what felt like an iron plate covering the upside; price and volume completely failed to keep up. This kind of low-volume rebound is the easiest way to trick people into taking the other side. I went short directly around 0.00787,
post-image
BTC+0.45%
XRP+1.76%
I was just about to go to the forum and start cursing, but then I looked at my balance and thought, never mind—the market is always right. I placed the order before bed a few days ago and thought it would go to waste, but today $SUI gave the answer directly—entered at 0.7362, now at 0.8054, with an unrealized gain of +452.99%. Feels great, guys.
I didn’t use any fancy analysis this time; I just looked at whether the buying support was strong enough. Before the market had fully started moving, every pullback held the level, which meant someone was buying underneath. Since someone was buying, I
post-image
SUI+6.72%
BTC+0.45%
ADA+4.26%
Everyone’s staring at gold, but $XAG /USDT just flashed a quiet 4h sell signal that nobody’s tweeting about.

$XAG /USDT - SHORT

Trade Plan:
Entry: 66.29 – 66.35
SL: 66.60
TP1: 66.11
TP2: 65.97
TP3: 65.77

Why this setup?
Why now? The 1D trend is sideways, but the 4h timeframe is whispering SHORT with 55% conviction—not a scream, just a nudge.
- Entry sits at 66.32, with immediate downside targets at 66.11 and 65.97.
- RSI on the 15m is cooling at 59.17, losing bullish steam.
- ATR (1h) at 0.115 shows the squeeze is tight—breakouts here are fast, not lazy.
The range-bound daily act
XAG+0.06%
The hand that set the stop-loss a few days ago trembled slightly; this morning, I realized that filial piety was unnecessary.
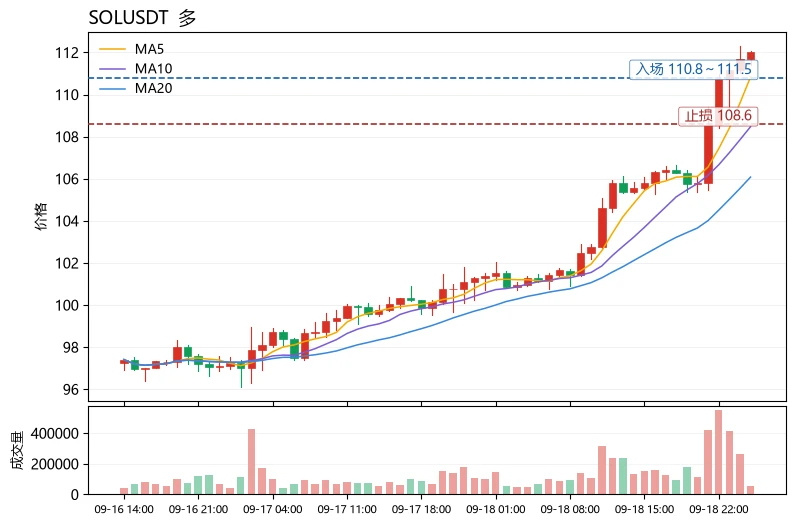
After the early-session dump, $SOL still poked its head up and faked two upward moves around 104.51. The volume kept shrinking, and the resistance above was too obvious. At a spot this heavy with the scent of a bull trap, I went straight in short. Don’t let the range grind away your patience, only to try to win back your dignity in a one-way move.
By the time I came to my senses, the price had already reached 103.3, delivering a return of +109.4%. This round of holding
post-image
SOL+2.25%
ETH+1.57%
SNDK+1.95%
Financial News, Crypto Updates, Real-World Strategies
live-cover
LIVE1,328
( new streamer) market overview
live-cover
LIVE226
Seems like Christmas 🎁⛄🎄
$TROLL
post-image
TROLL-15.37%
I originally planned to cut my losses as a sacrifice to the heavens, but the ritual never happened—the meat roasted itself.
With green filling the screen, $XAU kept oscillating around 4474.29, while the sell walls grew thinner each time. There was clearly no big money looking to take the other side. The rebound lacked volume and support, so I followed the trend and entered a short.
I switched over casually and saw it had already dropped to 4438.98, giving me a full +72.11% on paper. That was real meat on the table. It dragged its feet earlier, but the result tastes just as good.
Take profits
post-image
XAU+0.10%
XRP+1.76%
BNB+7.64%
Everyone’s staring at LTC’s range—but the 77% short signal says the exit door is already open.

LTC/USDT - SHORT

Trade Plan:
Entry: 53.89 – 54.17
SL: 55.80
TP1: 52.70
TP2: 51.82
TP3: 50.49

Why this setup?
- Price is pinned at 54.03 while 4h momentum rolls over; RSI 15m at 47 shows no buying spark.
- ATR 1h (0.57) is tight—this coil snaps fast, and TP1 at 52.70 is only 2.5% away.
- 1D trend is *range*, not bull—so this isn’t a dip-buy, it’s a mean-reversion gift.
- Why now? Entry zone 53.89–54.17 is the last polite area before the slide to 51.82.

Debate:
If LTC breaks 53.80, do you
LTC+7.26%
$meme wow 😮
0x385f4f8ae47651ce5f58f5265395a669f8281e18
post-image
MEME+4.73%
Ping Yeh, a software engineering manager at $GOOG Quantum AI, believes useful quantum computing is more than five years away
Hartmut Neven, who heads Google Quantum AI, has said recent results leave him confident that useful applications only quantum computers can handle will arrive within five years
“He is very confident,” Yeh said at the SEMICON forum. “I am a little skeptical. I want to be more conservative.”
post-image
GOOG-1.06%
GOOGL-1.12%
Gate reaches 60 million users—it's time to update your “crypto youth archive”!
What does 60 million users mean?
I think that rather than representing the platform's scale, it means 60 million crypto journeys have been connected. According to Gate's official data, the platform currently supports 5,000+ digital assets and continues to expand its diverse asset services, including stocks, ETFs, and RWAs.
But what may truly be worth remembering is the moment we first encountered the crypto market.
Were you a little nervous when you made your first deposit?
Did you stare at the candlestick chart for
RWA+3.24%
BTC+0.32%
  • 32
+60% without any news/proposals/announcements whilst BTC consolidates
things are cooking on Arbitrum and many are midcurving the obvious trade
if you think it "already pumped" - open the weekly chart
you didn't even have to be in my free discord [for this one!]
higher.
BTC+0.32%
ARB+30.68%
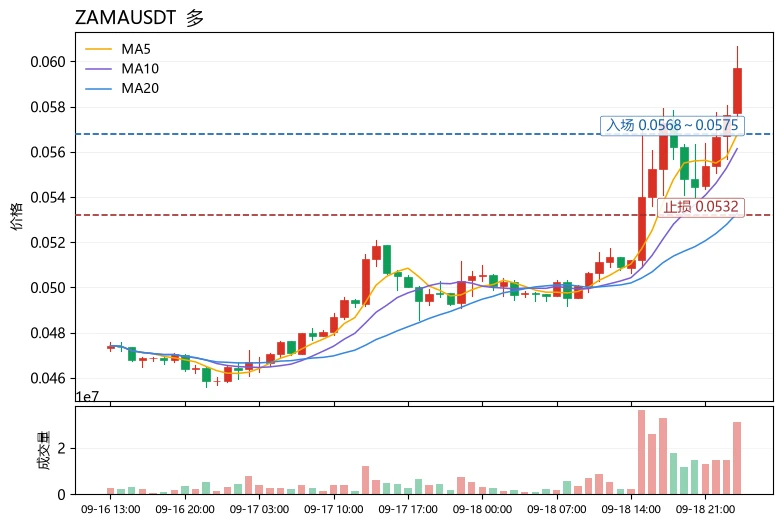
【$1000CAT Signal】Go long on pullback support
$1000CAT Pullback support, buying volume near 0.00255 is 1.58 times selling volume. 4H MACD bullish momentum is contracting, the 1H histogram has returned to zero, and 1H RSI is 61.84. The current quote is 0.002558, right within the recommended range.
🎯Direction: Go long
⚡Entry/Limit order: 0.00255033 - 0.00255800
🛑Stop-loss: 0.00253242
🚀Target 1: 0.00259637
🚀Target 2: 0.00261555
🛡️Trade management:
- Execution strategy: After reaching Target 1, reduce the position by 50% and move the stop-loss up to the breakeven level. If the price falls back
post-image
BTC+0.32%
ETH+1.56%
SOL+2.17%
y’all current targets just too minimal
Raise the fucking bar!
$ETH —> $12k
$BTC —> $300k
$SOL —> $1k
$BNB —> $5k
post-image
ETH+1.56%
BTC+0.32%
SOL+2.17%
BNB+7.55%
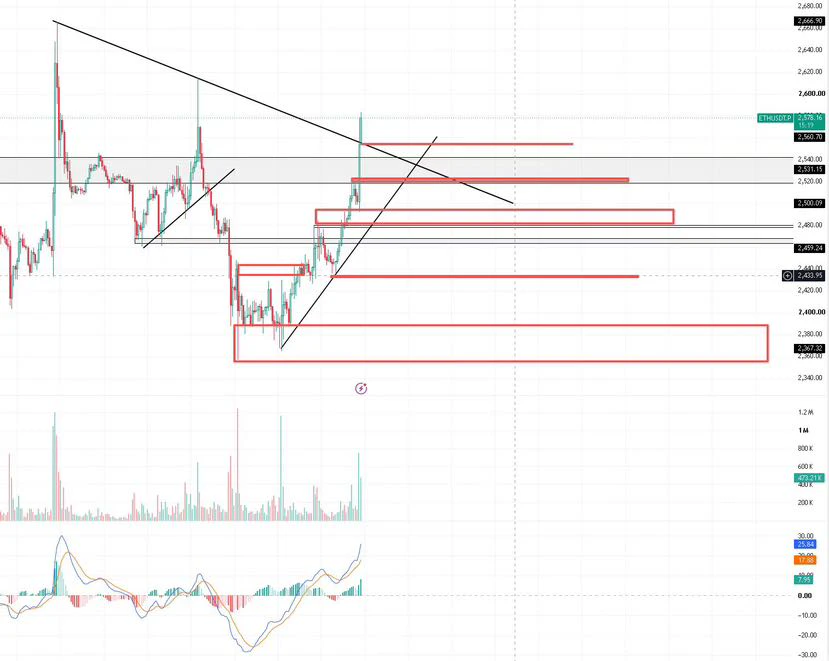
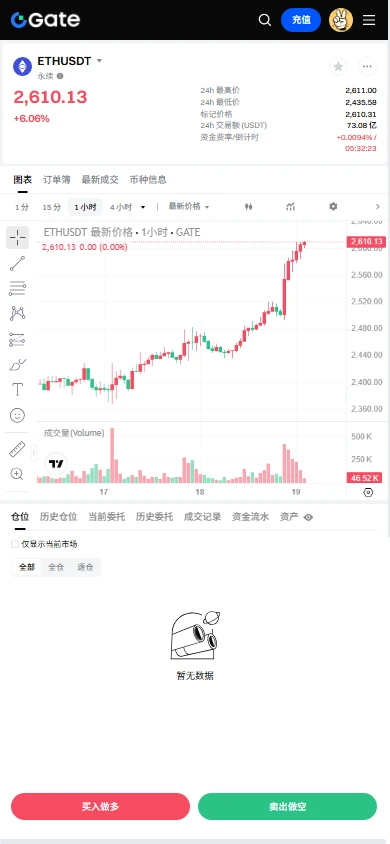
A few days ago, my hand trembled slightly as I set a stop-loss before bed. Looking at it this morning, I had simply scared myself. When $ETH plunged intraday, I saw that the pullback held and knew someone was catching it below.
Once the pullback held and buying gradually strengthened, it would have been hard to justify staying out of this setup. I opened a long at 2451.64, set the stop-loss, and stopped watching the chart.
Now the market has given us the answer: it surged straight to 2478.11, with +187.77% unrealized profit sitting there. Feels good, brothers. That was a satisfying bite of me
post-image
ETH+1.57%
BTC+0.45%
XRP+1.76%
Everyone’s staring at ONDO’s 0.371—but the 95% score says you’re early, not late.

$ONDO /USDT - LONG

Trade Plan:
Entry: 0.370 – 0.372
SL: 0.363
TP1: 0.377
TP2: 0.381
TP3: 0.388

Why this setup?
Why now?
- 4H bias is LONG with 95% confidence—the algo smells a breakout before the crowd does.
- Daily trend is bullish; pullback to 0.371 is the *last* cheap ticket before TP1 at 0.377.
- RSI 15m at 50.2 = neutral fuel, not exhaustion. ATR 1h (0.003465) shows tight coils—squeeze ready.
- SL at 0.363 is a 2% risk for a 4.5% ride to TP3 (0.388). Asymmetry is your edge.

Debate:
Are you ad
ONDO+4.75%
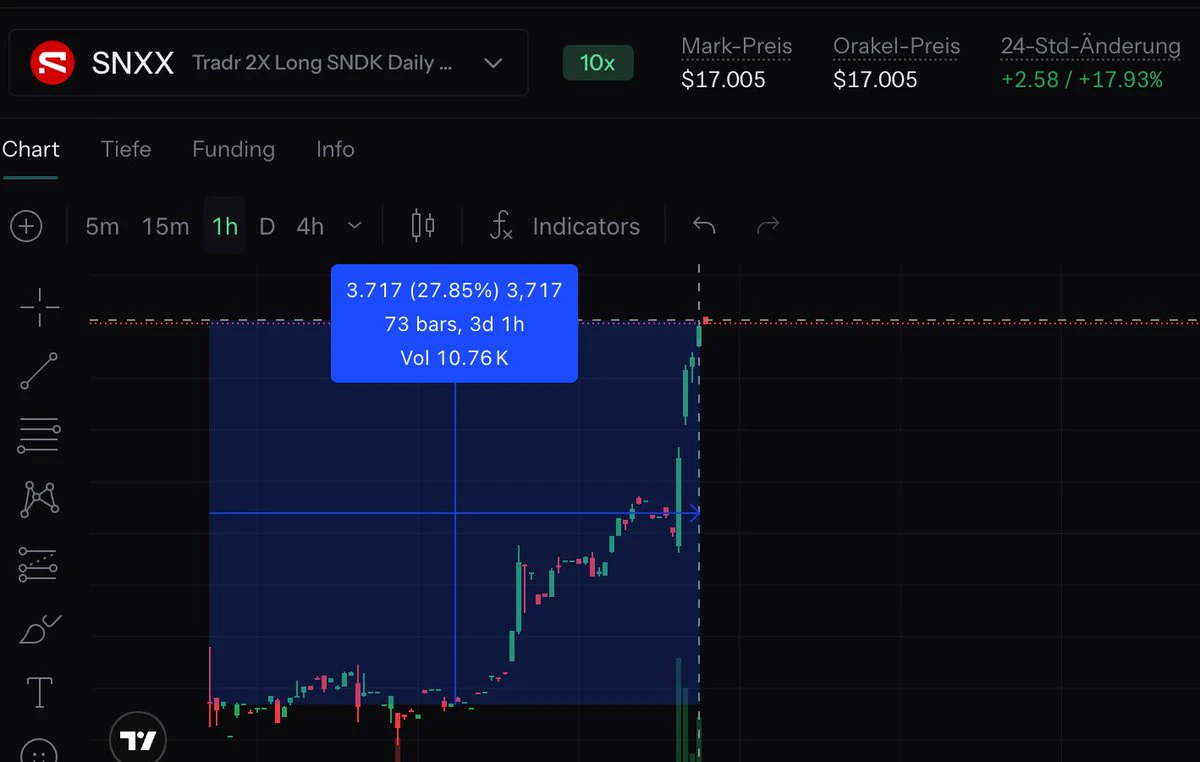
$MU ‌Micron Technology (MU), a leading player in the semiconductor and memory technologies sector, continues to attract attention in the stock market with the strong demand generated by its artificial intelligence infrastructure investments. The stock gained 5.89% during intraday trading, rising to $1,014.95 for a strong session close.
Corporate Financial Data and Market Indicators
The current market values and trading data for Micron Technology are as follows:
Current Share Price: $1,014.95 (Daily change: +$56.46 / +5.89%)
Market Cap: $1.146 trillion
Intraday Trading Range: Lowest $969.00,
MU+5.89%
NAS100+0.06%
  • 5
  • 1
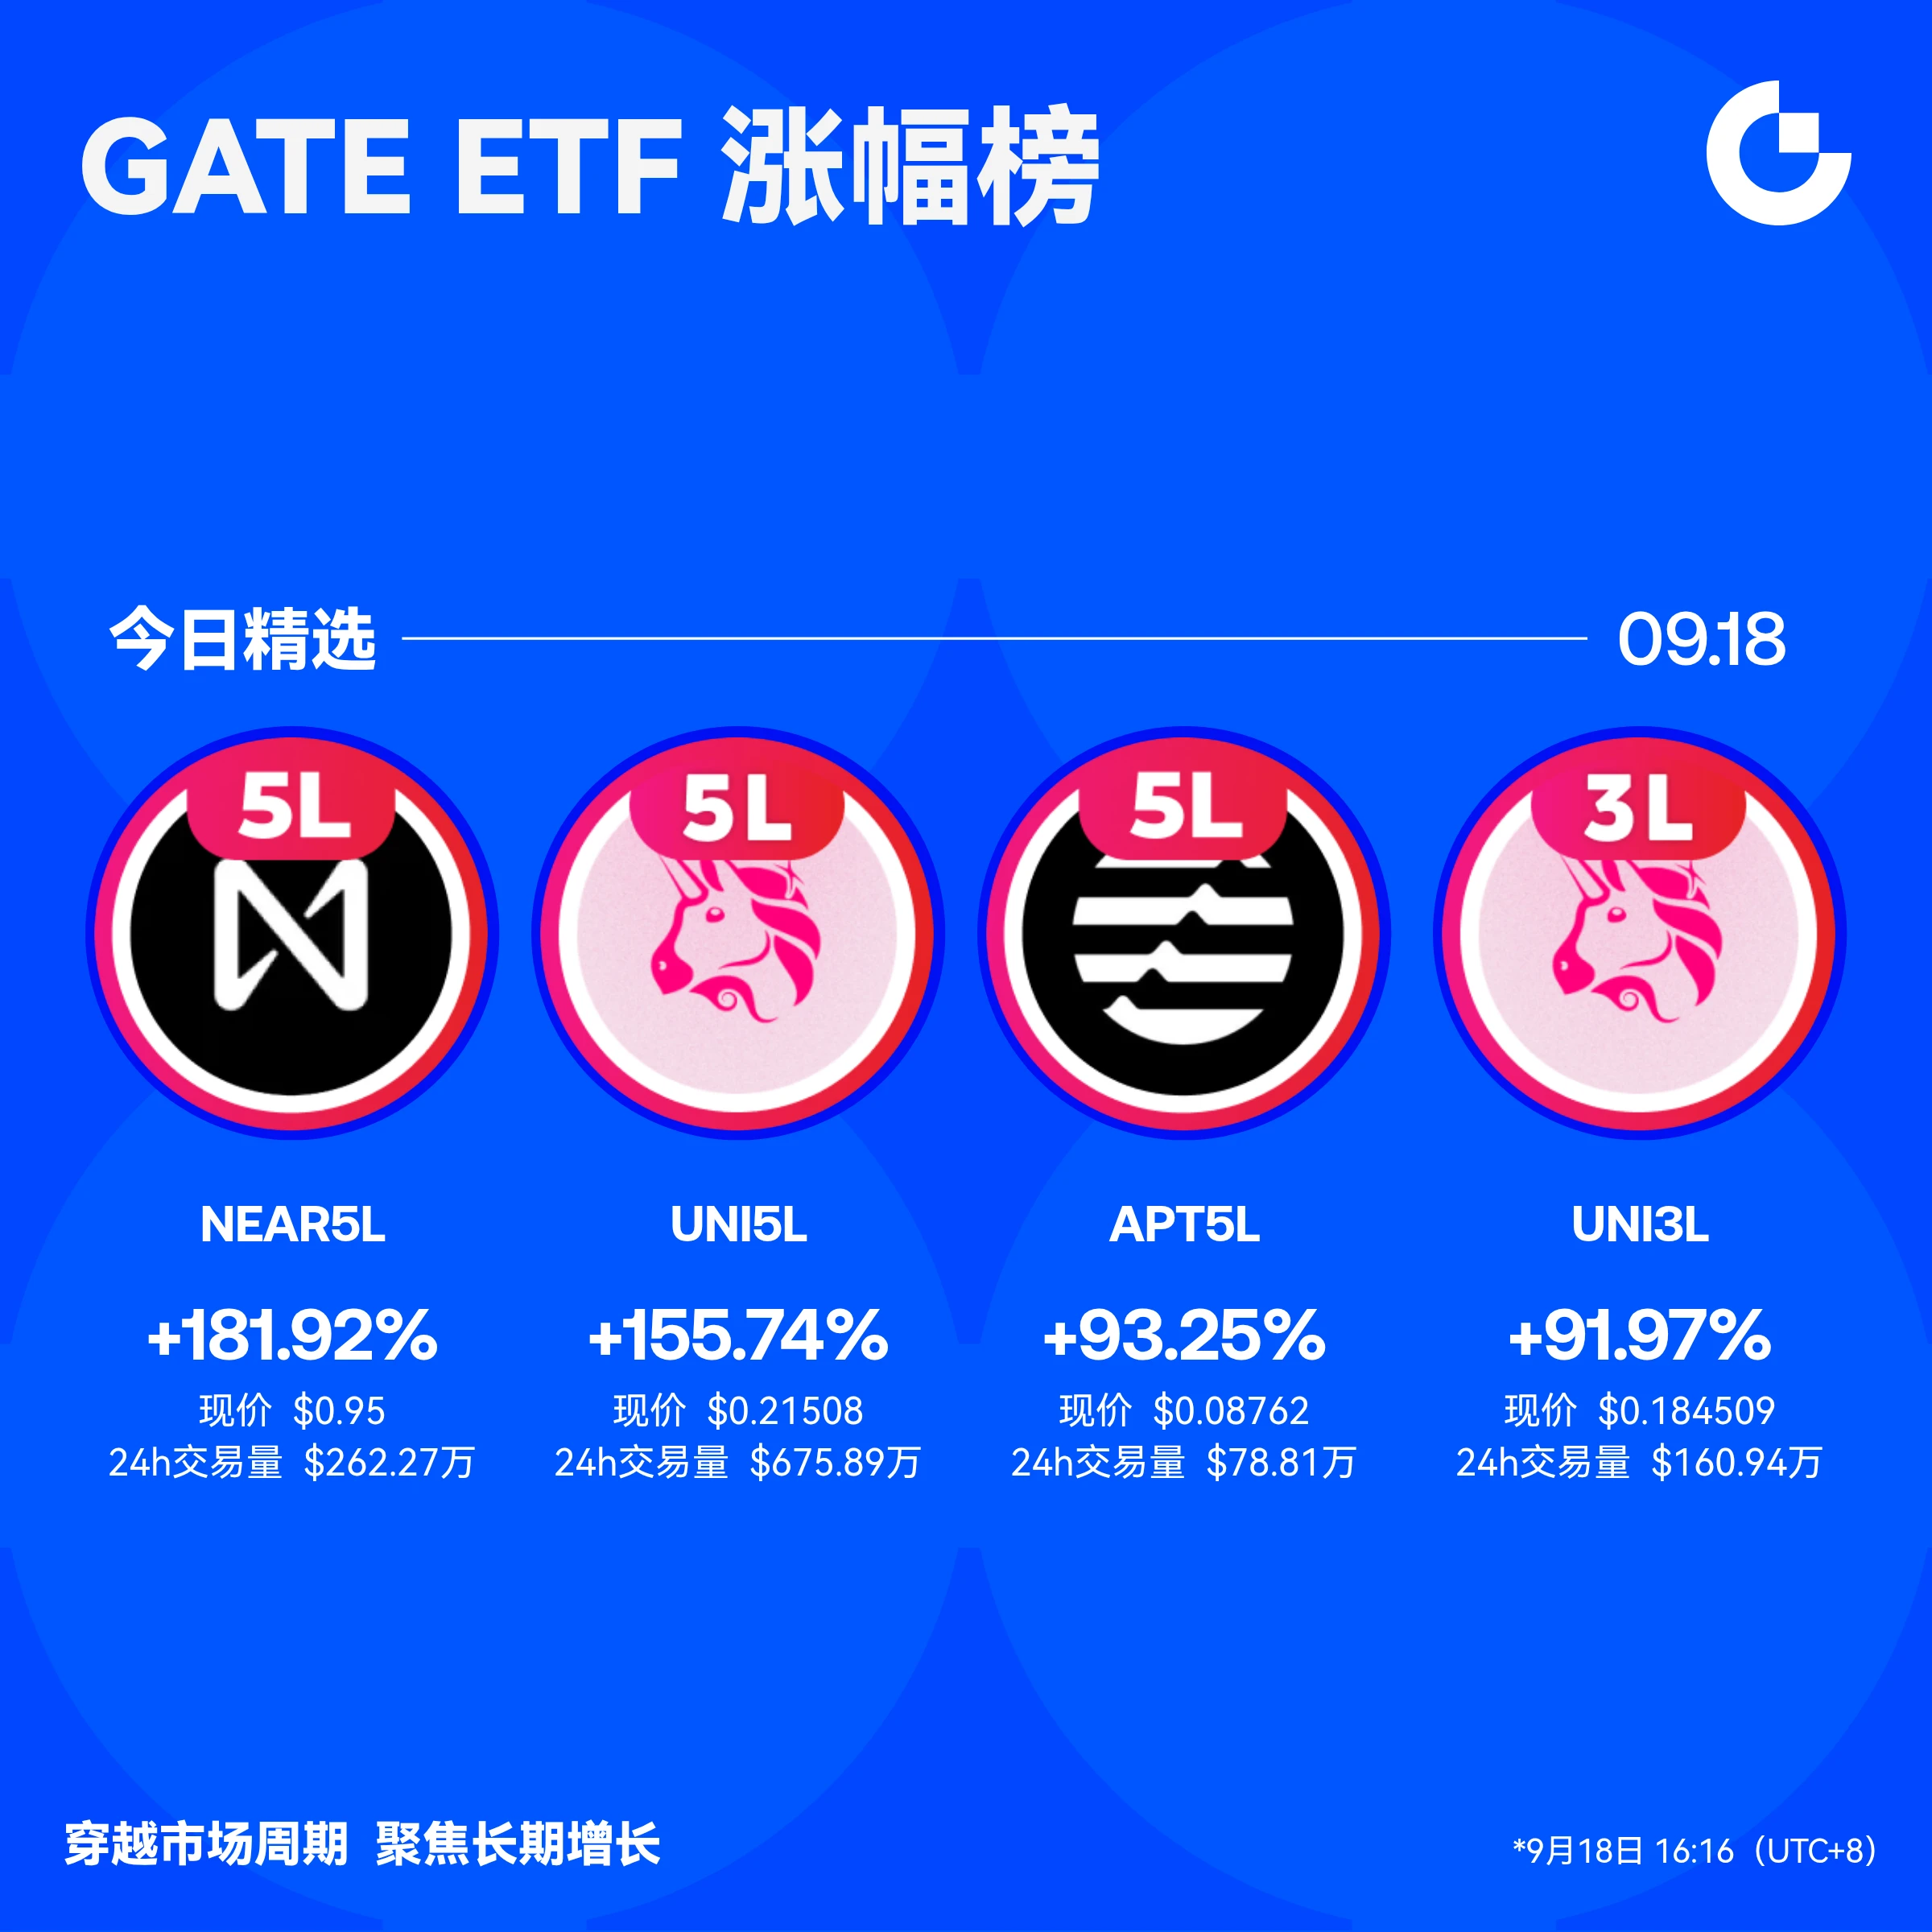
Everyone’s staring at NEAR’s 2.17 level—but the 95% confidence score says they’re looking at the wrong chart.

$NEAR /USDT - LONG

Trade Plan:
Entry: 2.1593 – 2.1835
SL: 2.0551
TP1: 2.2586
TP2: 2.3168
TP3: 2.4041

Why this setup?
- 1D trend is bullish, and 4h momentum is aligning for a breakout, not a breakdown.
- RSI on 15m is cooling at 40.42—this is the reset before the push, not exhaustion.
- Entry zone 2.1593–2.1835 is tight; TP1 at 2.2586 is only a 4% move away, but TP3 at 2.4041 is the real prize.
- Why now? The pullback is shallow (ATR 0.048), meaning sellers are weak—buyers a
NEAR+3.61%
Most traders will fade this $SLX /USDT short before the 4h close—here’s why that’s a mistake.

$SLX /USDT - SHORT

Trade Plan:
Entry: 0.06997 – 0.07029
SL: 0.07167
TP1: 0.06898
TP2: 0.06821
TP3: 0.06705

Why this setup?
- RSI 15m at 48.34 = zero momentum to push higher, just dead air.
- ATR 1h (0.000641) shows shrinking volatility—breakouts fail fast in range.
- Entry ref 0.07013 sits below 1D range mid; TP1 0.06898 is only 1.6% away.
- Why now? The “Armed” status means the trap is set before the weekend liquidity hunt.

Debate:
Are you shorting the breakdown to TP2 or waiting for a
SLX+1.29%
Load More

Join 40 M users in our growing community

⚡️ Join 40 M users in the crypto craze discussion

💬 Engage with your favorite top creators

👍 See what interests you

View More