
Square
Following
Hot
News
Notifications
Profile
Share your thoughts
placeholder
Article
#BTC跌破6万美元关口
$ETH $BTC Is this the bottom now?
It's uncertain, but there should be a rebound. Hopefully we'll see a decent bounce here. $ANT just listed, so if it rebounds next week, there's still a chance for a rally.
Let's also see what events are coming up next week
post-image
ETH-1.23%
BTC-0.65%
ANT-8.68%
With food,
one can sustain the faith!
post-image
Trenches
IDOL
I
bade
b
IDOL
0x3b...ab07
Market Cap
$.
Change
.
24h Vol
$.
Holders
.
JAGENT
J
bade
b
JAGENT
0x8e...ae15
Market Cap
$.
Change
.
24h Vol
$.
Holders
.
PIEVERSE
P
bade
b
PIEVERSE
0x0e...25a9
Market Cap
$.
Change
.
24h Vol
$.
Holders
.
FIONA
F
bade
b
FIONA
B34n...pump
Market Cap
$.
Change
.
24h Vol
$.
Holders
.
CLAUDIA
C
bade
b
CLAUDIA
2j5S...W2ZM
Market Cap
$.
Change
.
24h Vol
$.
Holders
.
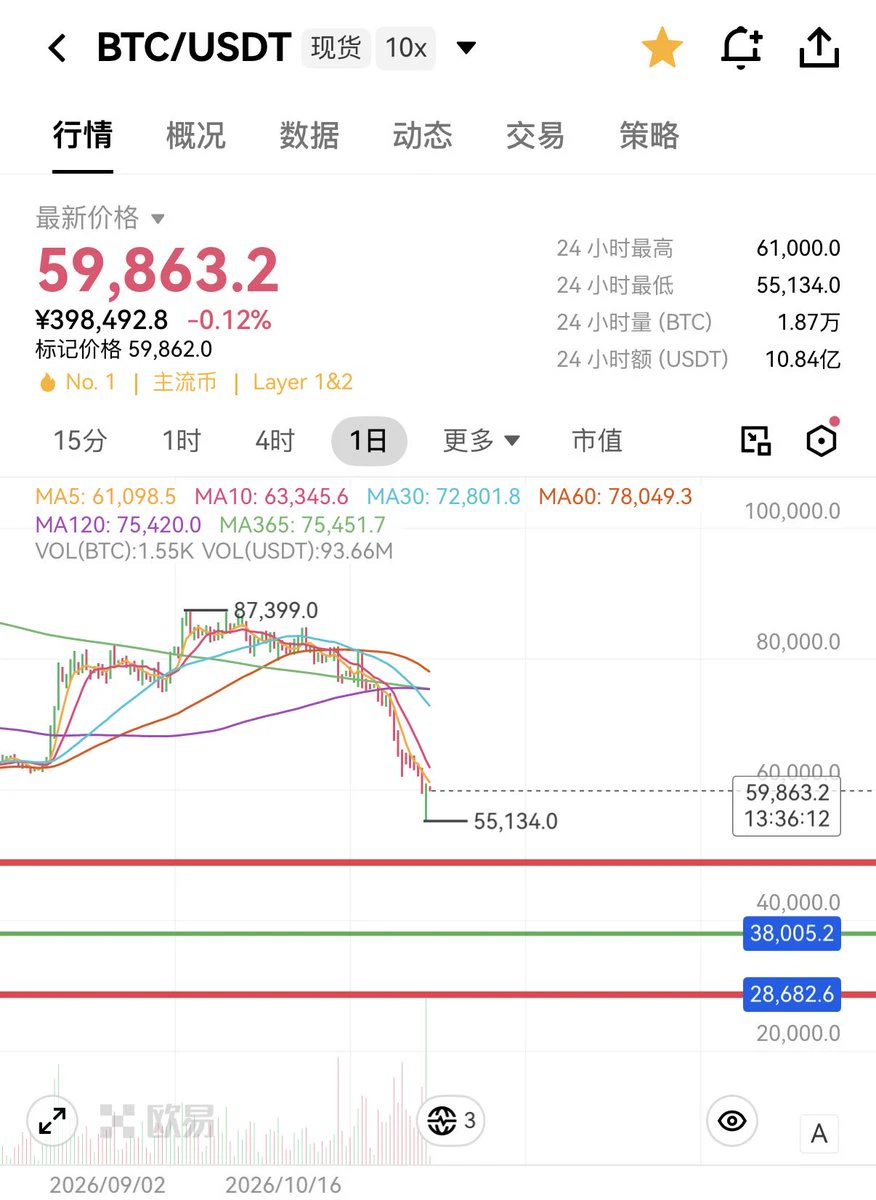
Briefly closed bullish before continuing to fall?
Lower levels 48000 38000 28000
#BTC
post-image
BTC-0.67%
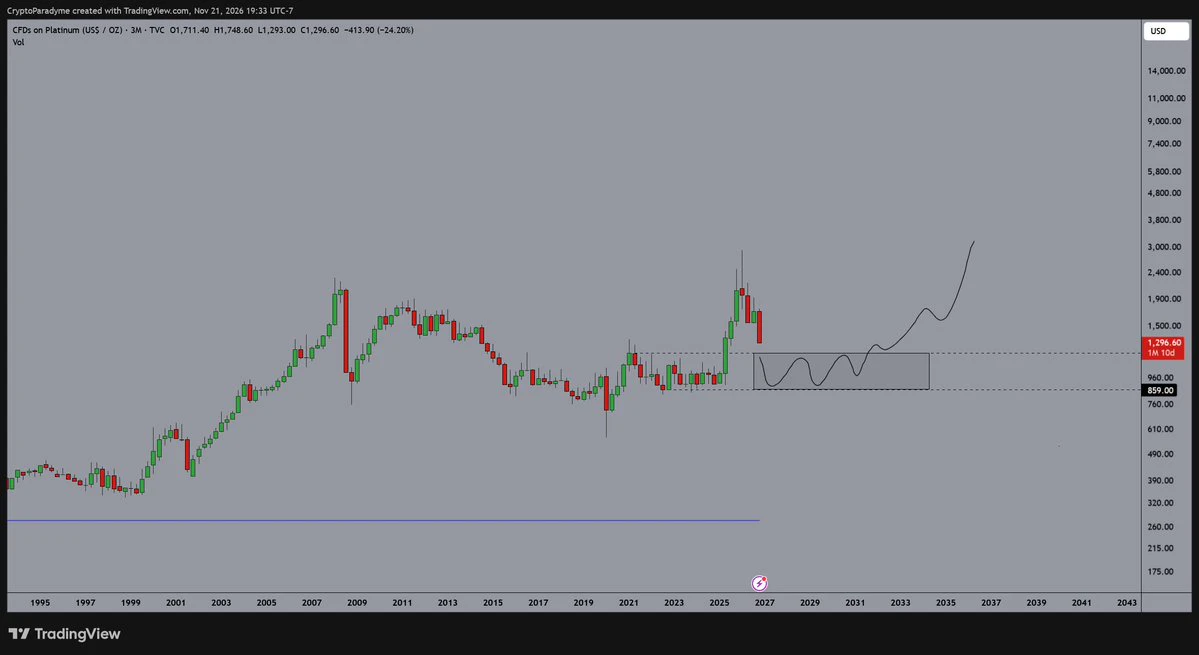
there's probably ~3 of you that care about platinum but it's coming into some pretty cozy looking levels.
post-image
XPT-0.16%
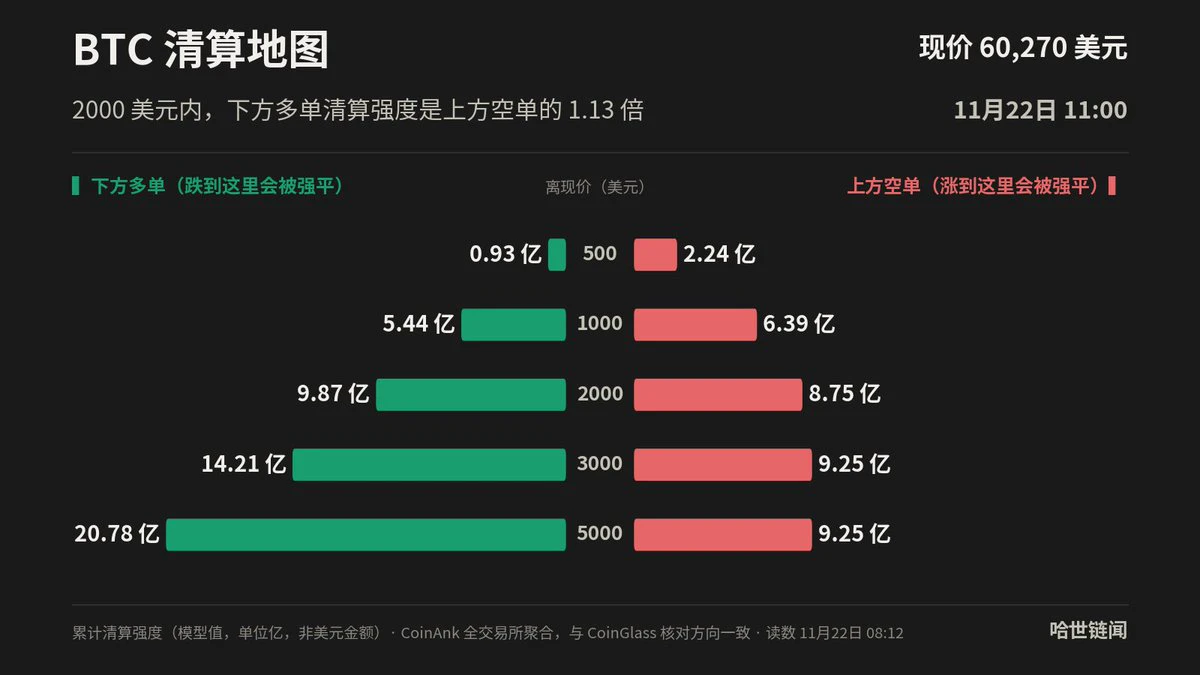
BTC liquidation map | Long positions are more concentrated below
Current price: $60,270 (08:12 reading). Within $2,000 above and below, downside long liquidation intensity is $987 million, while upside short liquidation intensity is $875 million; the downside is 1.13 times the upside.
The model estimates the probability of an upward move over the next 4 hours at approximately 47%.
$BTC #清算地图
post-image
BTC-0.65%
Peter Brandt warns Bitcoin could plummet to $31,550
Bitcoin has fallen more than 50% from its peak and continues to face heavy selling pressure, trading around $61,000 after a sustained decline that began in early November.
Against this backdrop, veteran trader Peter Brandt says the market needs to seriously consider the possibility that a new bear market has begun.
⚠️ Personal market analysis only. NFA — manage risk and DYOR.
Educational content, not investment advice or a recommendation to buy, sell, deposit, or withdraw any asset. No paid promotion or referral/affiliate links.
post-image
BTC-0.67%
$BTC Here’s the ideal scenario: if Bitcoin really drops to around 55k and retests its previous low, that would actually be a ticket to get in. Once this washout is over, we can set up long positions to ride the next uptrend and save up some hard-earned gains for the 2027 Lunar New Year reunion dinner—Chinese sausage, red envelopes and all. 🤑🤑$ETH $ZEC
post-image
BTC-0.67%
ETH-1.26%
ZEC+1.16%
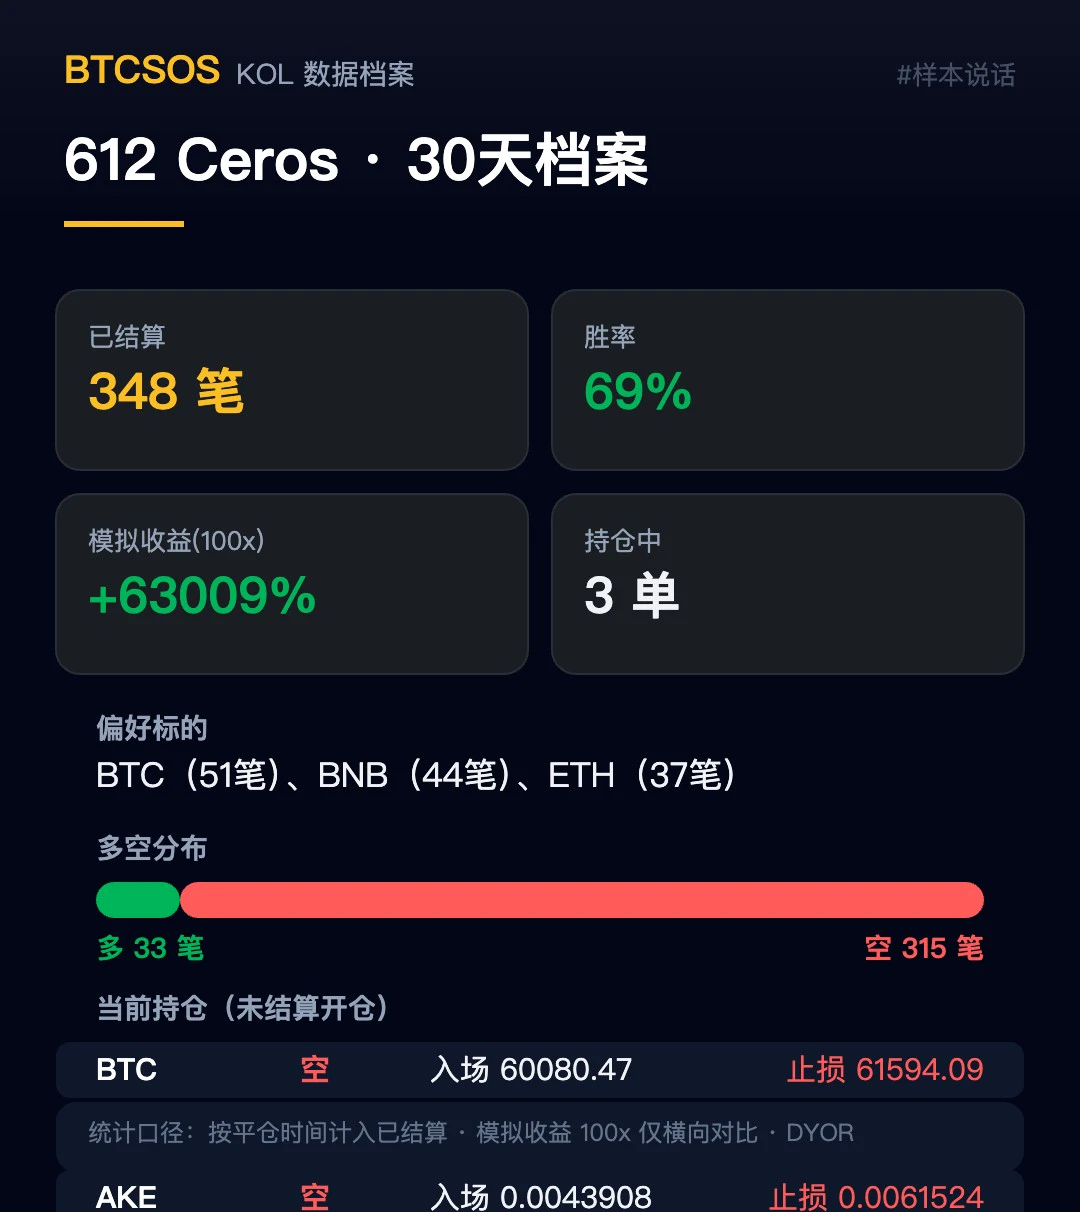
[KOL Profile] 612 Ceros | Past 30 days
348 trades settled, 239 hits, 69% win rate; simulated returns (100x basis) +63009%. Preferences: $BTC 51 trades, $BNB 44 trades, $ETH 37 trades; 33 long / 315 short—this short bias is seriously intense 📉 Currently holding 3 positions (unsettled, not included in the record above).
Took a look yesterday (11-21): 8/8 hits, simulated +4078%; checking again today, 239/348, +63009%—visibly hitting its stride 👀
Data is based on closing times, with every trade logged and available for review. Simulations are just simulations; don’t treat them as real trades to
post-image
BTC-0.65%
BNB-0.72%
ETH-1.23%
PDD-2.69%
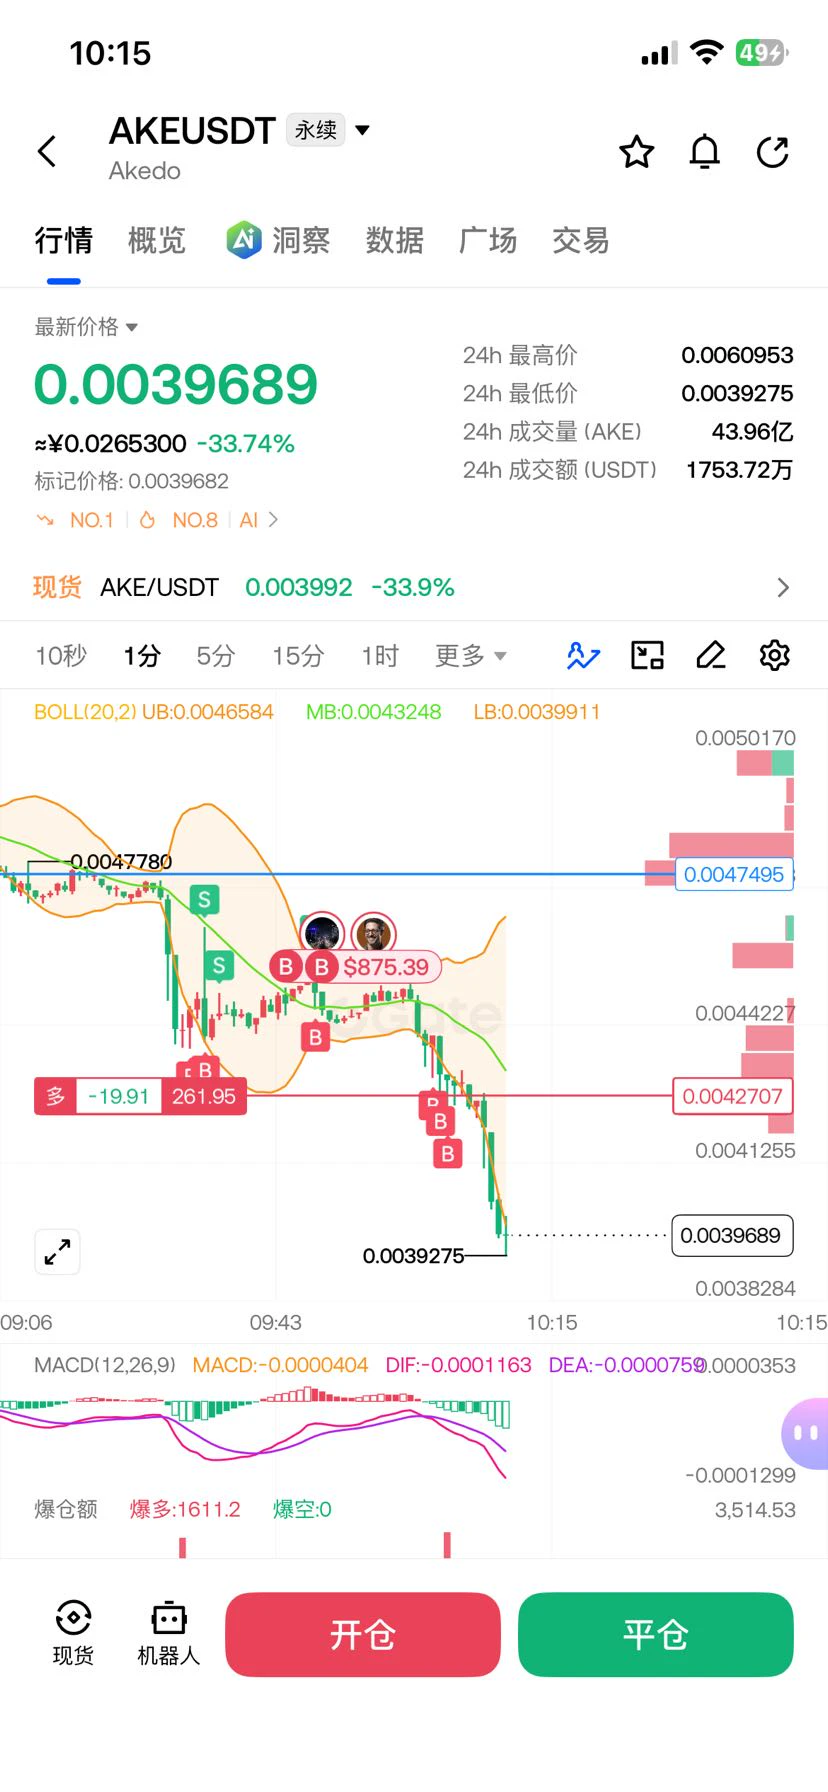
$AKE 10U in, down 200% in 3 minutes
post-image
AKE+6.07%
#Gate股票畅聊季 A Logical Breakdown of the Deep Correction in U.S. AI Stocks: Panic Pricing, Expectations Mismatch, and Diverging Long-Term Value

The U.S. stock market has recently experienced sharp volatility. Over the past 45 days, the S&P 500 and core AI assets have suffered significant pullbacks, with market capitalization losses reaching as much as $6 trillion. Market sentiment is currently at an extreme fear level. Drawing on recent market conditions and the perspectives of leading institutions, this report breaks down the four core factors behind the latest selloff: AI capital expenditure,
SPYX+0.01%
AMZN-3.90%
MSFT-2.61%
NVDA-13.84%
AMD-13.27%
  • 2
After this week’s sharp drop, I noticed a pattern:
What really makes you lose big,
isn’t “not understanding the market,” but “understanding it and refusing to admit it.”
The market is clearly falling, but you insist “it’s just a shakeout”;
you clearly should cut your losses, but insist “wait for a bounce.”
The market isn’t wrong; you’re fighting yourself, and you never win against yourself.
post-image
  • 1
A brief analysis of BTC’s short-term trend from the perspectives of Dow Theory, Chan Theory, Elliott Wave Theory, volume-price analysis, order flow, and price action
I. Dow Theory
55,130 ultimate abyss, climax of the Dow Theory bear trend capitulation: From a Dow Theory perspective, 55,130 on Nov 21 was the ultimate abyss of capitulation— the “panic bottom” at 57,778 was also decisively broken.

High sequence: 81,879→81,076→80,838→74,703→74,115→71,386→68,377→65,604→64,928→64,080→64,017→62,639→60,996 (Nov 21)—thirteen consecutive lower highs, with bears in perfect control

Low sequence: 76,149→
BTC-0.67%
#GateDirectIPOPhase3ANTAllocates92100Shares

Gate Direct IPO Phase 3 is bringing another major update for the community, with ANT allocated 92,100 shares in the latest phase.

The allocation highlights continued interest in the ANT IPO and gives participants another important milestone to watch. With the third phase now in focus, traders and investors are closely following the allocation details and what could come next for ANT.

This development also puts more attention on the Gate Direct IPO mechanism, where community participation and allocation outcomes remain key points of interest.

📌 K
ANT-8.13%
Huh? I've been using Claude for almost a week. Why haven't I been banned yet?
Wasn't it said that Anthropic makes over $2.7 billion in profit from banning Chinese users' accounts?
I think we can keep shorting $ANT
Over $60 should be about right, right?👀
post-image
ANT-8.68%
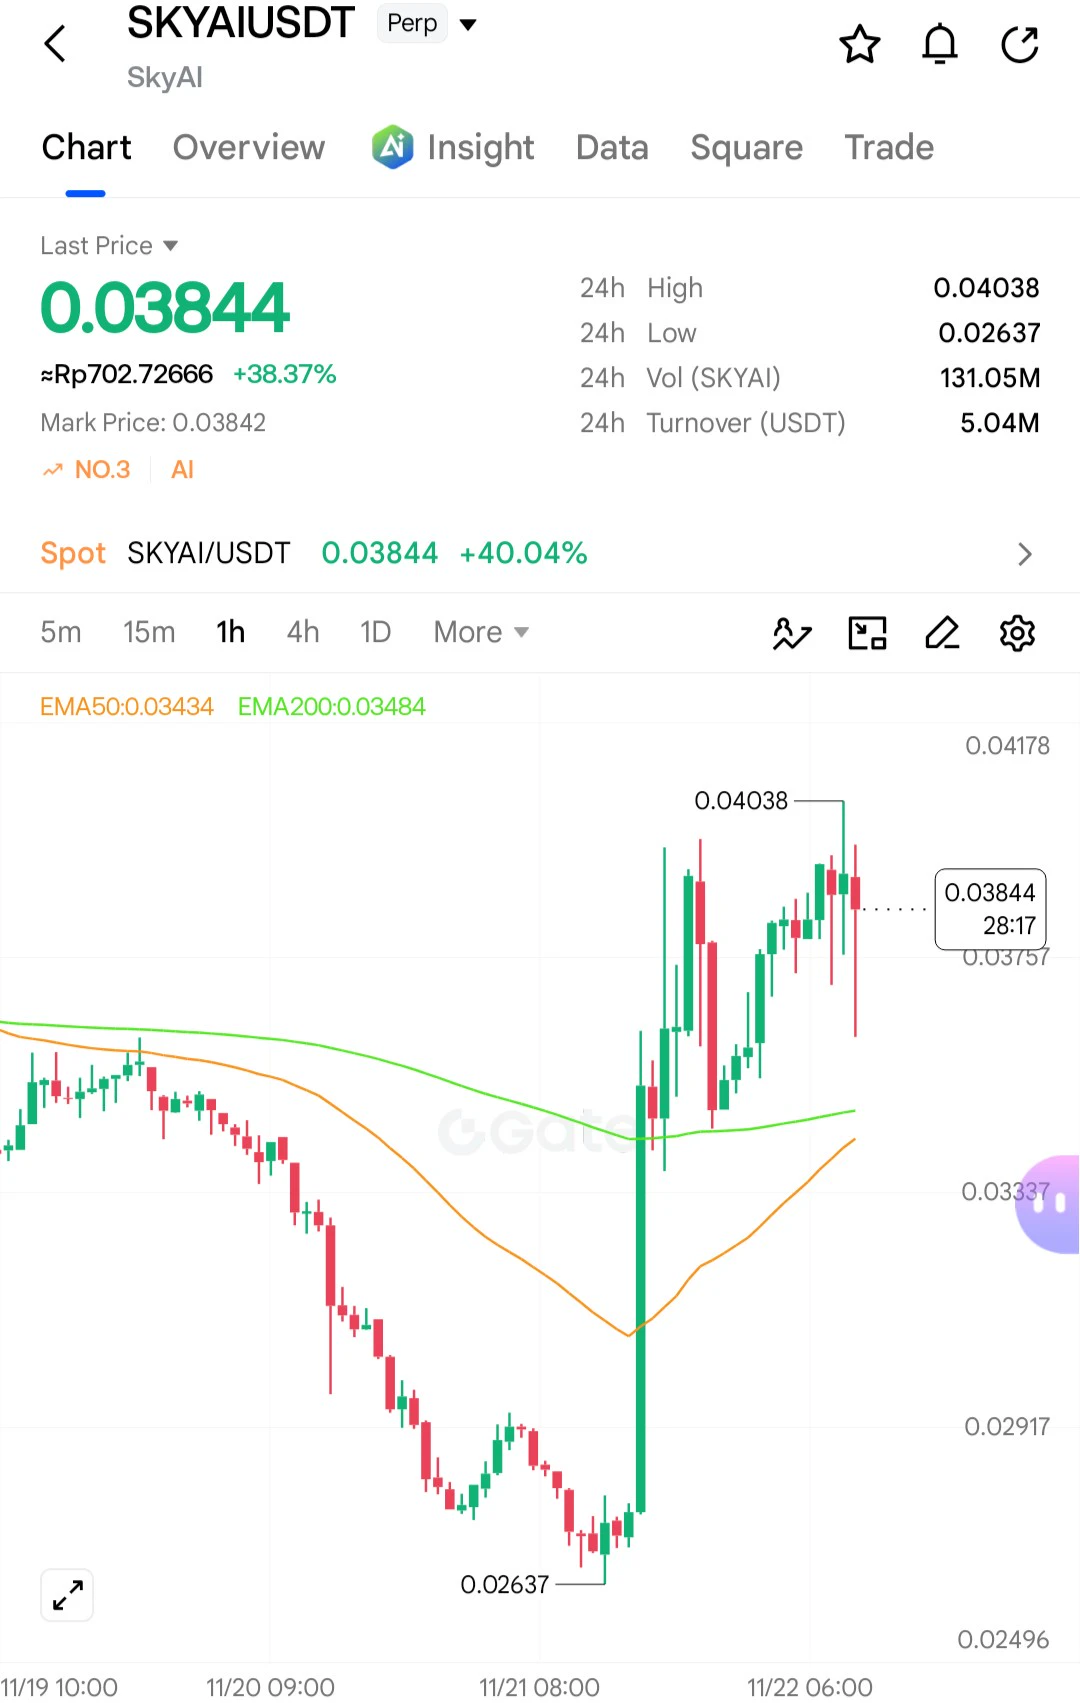
SKYAI has rebounded again over these past 2 days; perhaps the Market Makers and whales are preparing fuel to go to the moon.
$SKYAI ‌$AKE ‌
post-image
SKYAI-7.69%
AKE+6.39%
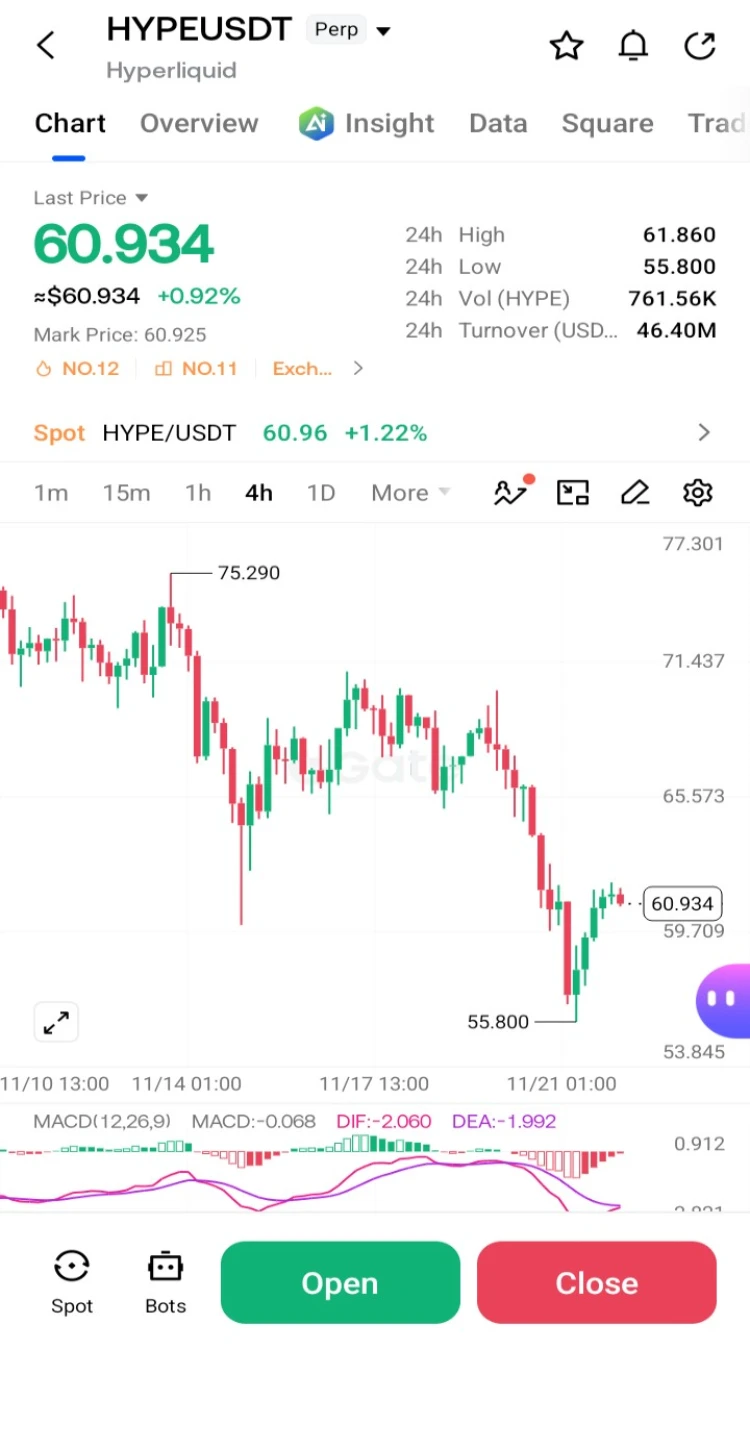
The recent bounce in $HYPE looks interesting, but there is still a difference between what the 1H and 4H charts are showing. Short-term buyers are becoming active, while the bigger trend hasn't given a clear bullish signal yet.

HYPE is currently trading around $61.54, up 1.65% over the last 24 hours. On the 1H chart, price has moved above the EMA20 at $60.82, which is a positive sign. However, RSI is already at 76.8, and trading volume remains below average. This makes me cautious about chasing the current move.

The 4H chart still needs improvement. Price is below the EMA20 at $62.93, while
post-image
HYPE+0.33%
  • 2
  • 1
btc
live-cover
LIVE1,360
ETH-1.26%
BTC-0.67%
SOL-0.77%
🔹 BNB Surpasses 540 USDT with a Narrowed 4.43 Decrease in 24 Hours
live-cover
LIVE2,340
NVDA-13.84%
TSLA-7.56%
AAPL-1.83%
META-5.82%
SKHY-13.06%
Load More

Join 40 M users in our growing community

⚡️ Join 40 M users in the crypto craze discussion

💬 Engage with your favorite top creators

👍 See what interests you

Trending Topics

BTCReboundFaces60KTest

2.1M Views30.1K Discussing

BTC rebounded from around $55,300 on November 21, briefly reclaiming $60,000 before pulling back to around $59,300. The $60K level is back in focus as traders assess whether the recovery can last. Is this rebound a sign of stabilization or a short-lived recovery? Would reclaiming and holding $60K be enough, or do you need confirmation from trading volume and fund flows?

PCEAndGDPDataNextWeek

257.7K Views2.6K Discussing

GateDirectIPOPhase3ANTAllocates92100Shares

808.5K Views5K Discussing

View More