





Share your thoughts
placeholder
Article
Everyone’s staring at $H /USDT’s bounce—but the 95% confidence short says that’s the trap.

$H /USDT - SHORT

Trade Plan:
Entry: 0.08147 – 0.08219
SL: 0.08528
TP1: 0.07924
TP2: 0.07752
TP3: 0.07493

Why this setup?
Why now? The 4h structure is screaming lower, not higher.
- 1D trend: firmly bearish—no reversal signal yet.
- RSI (15m) at 54.16: weak pop, not momentum.
- ATR (1h) 0.001437: tight range = building pressure for a breakdown.
Entry zone 0.08183–0.08219 is the last resistance before TP1 at 0.07924. If we lose 0.07944 invalidation, this short dies—but until then, gravity win
H+6.49%
BTC just reclaimed $80,000 before getting knocked back down—the bulls have it tough
Now that we've covered the data, let's talk about what everyone cares about most—Bitcoin.
Just one day before the nonfarm payrolls data was released, BTC had reclaimed $80,000. U.S. Treasury yields fell and the dollar weakened, finally giving risk assets some breathing room. But as soon as the nonfarm payrolls data came out, BTC was hit hard. It fell as much as 2.8% intraday, touching $79,197. The $80,000 threshold was breached again.
Ethereum was not spared either, falling below $2,500. More than 120,000 trade
MU+5.89%
Arbitrum ethereum:0xb50721bcf8d664c30412cfbc6cf7a15145234ad1 bridge TVL just hit an ATH at $23B
post-image
ARB-3.38%
ETH-2.34%
Ok GPT Astra 6 just cost me $9M
post-image
The Real Battle Hasn’t Begun Yet—Next Week’s CPI Will Decide Everything
Although the nonfarm payrolls data was explosive, don’t rush to conclusions—the real showdown is next week.
Almost all analysts are emphasizing the same point: the key variable determining whether the Federal Reserve raises rates in September is not nonfarm payrolls, but CPI. Fed Governor Waller made it clear on Thursday that if inflation continues to cool in August, he would favor keeping rates unchanged in September. A stronger labor market will not be the primary consideration in the rate decision; inflation data will b
NVDA+0.87%
These returns have me feeling nervous, worried the market will wake up tomorrow and blacklist me.
A few days ago, the last thing I checked before bed was the chart. $SNDK pulled back to around 1500.51 and stopped moving. It was bottoming out without breaking support, while funds were still quietly entering. I felt this level had potential, so I casually opened a long position.
The first thing I did after waking up was check my phone: 1771.62 had shot up, and +1282.92% was in the bag. After dragging on for so long, seeing it finally break out feels incredible.
Don’t rush to add to your positio
post-image
SNDK+12.32%
ETH-2.35%
ZEC+6.55%
Web3 is big for countless opportunities!
Just keep showing up. Eventually, the right people notice the work, the conversations start, and those conversations can turn into real opportunities and deals.
September looks promising 💝
post-image
[New Streamer] Market Prediction
live-cover
LIVE1,992
How should you handle it if your child’s homeroom teacher asks to borrow money? Any advice?
post-image
All I can say is that flomo has really gone downhill.
Even if they couldn't display it properly, they shouldn't have displayed these characters...
If it wants to make money, it has to keep adding all sorts of messy features to attract attention, so it can no longer remain small and elegant.
For example, the AI feature—I’ve already cut it from the note-taking app I made myself.
Because you can have an Agent like Codex do the analysis, which is much more useful than using this app for analysis.
Putting an Agent inside the app is truly the stupidest approach.
post-image
$NOM 24-hour surge of 27%, with $25.3 million in trading volume. This level of volume during a macro data blackout is purely a fund-driven move. The Fed minutes, nonfarm payrolls, and CPI are all absent, and there is nothing major before the U.S. stock market opens tonight—on days like this, market makers love pushing small-cap assets because nobody's attention is being diverted.
I'll state the conclusion directly: NOM has climbed from 0.0015 to 0.0020, breaking above the previous high on heavy volume on the four-hour chart, but $25M in trading volume is barely a ripple in crypto. The spot Bit
NOM+23.09%
BTC-2.35%
NAS100-0.60%
USIDX+0.15%
SPYX-0.43%
How to Trade After the Nonfarm Payrolls Report? Here Are Some Practical Points
Finally, let’s talk about trading strategies. The data is out, and the market has reacted. What should we do next?
First, remain cautious toward risk assets in the short term. Rising rate hike expectations, a stronger dollar, and higher U.S. Treasury yields—these three factors are not good news for BTC, gold, or tech stocks. BTC may continue to retest the $80,000 level in the short term. If you want to go long, wait for a pullback to stabilize before acting. Don’t rush to chase the rally.
Second, closely watch next
NVDA+0.87%
$ZEN has formed 223 days accumulation range on daily timeframe 👀
A successful breakout will open door for massive Bullish Rally 📈
Free Signals:
#Crypto #ZEN #Horizen #Zenusdt #ZENCoin #cryptocurrency
post-image
ZEN0.00%
ON+3.10%
$BULLA left too early. I think it still has room to rise.
post-image
BULLA+145.07%
The hand that set the stop-loss a few days ago trembled slightly, and this morning I realized that was needless filial piety😂 $WLD This long trade is genuinely strong; 0.3878 has already moved well clear of the cost zone, making that bit of panic a few days ago seem especially unnecessary.
The most interesting part was the intraday bottoming grind: around 0.3669, sellers wanted to smash it down but couldn't, while buyers became increasingly aggressive. Funds were quietly entering, and the candlesticks clung to the bottom without breaking down. I judged at the time that this was accumulation,
post-image
WLD+0.23%
ADA-3.98%
ZEC+6.55%
today market insight
live-cover
LIVE1,262
$BTC Signal】1H low-volume grind lower + 4H death cross convergence, dip-buying setup
$BTC Order-book bid-side skew is 6.27, with a clear depth imbalance. The 1H MACD green bars are narrowing, while the 4H MACD histogram has not expanded after the death cross. Price is repeatedly testing below EMA20, trading volume has declined for three consecutive candles, and the latest bid-side share is only 31%.
🎯Direction: long
⚡Entry/Limit order: 79292.108 - 79530.700
🛑Stop-loss: 78735.393
🚀Target 1: 80723.660
🚀Target 2: 81320.141
🛡️Trade management:
- Execution strategy: Reduce the position by 50%
post-image
BTC-1.59%
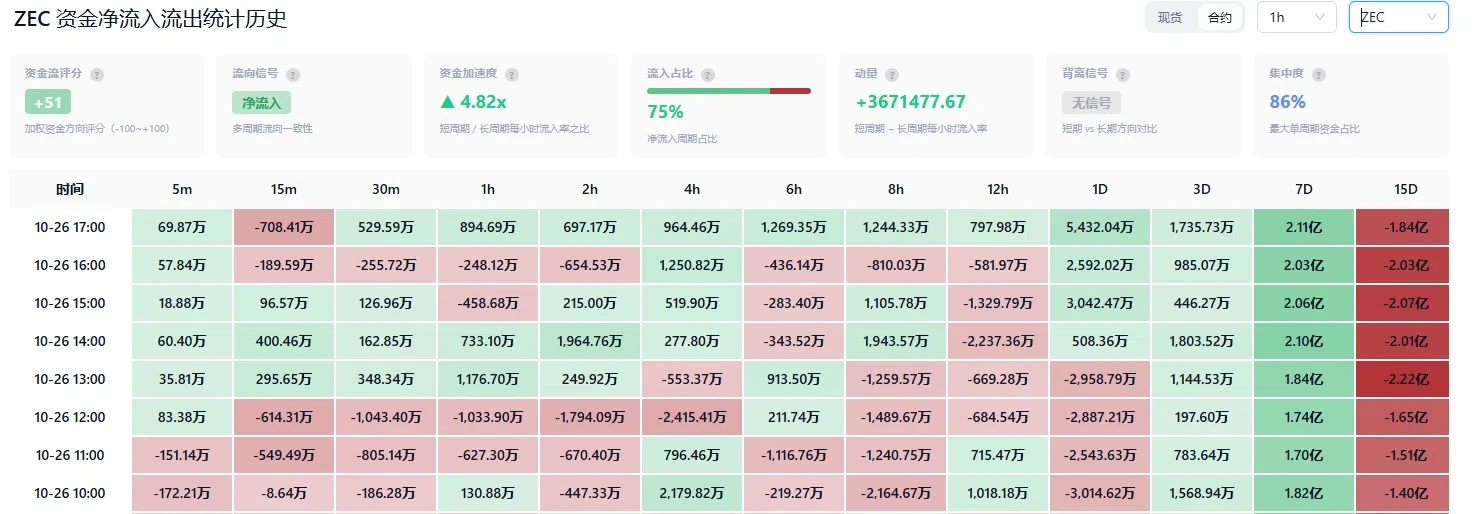
ZEC/USDT: Current Situation and Outlook
Current Data:
· Price: $1,016.24 (+6.97%)
· 24h High: $1,049.98 / Low: $944.85
Technical Indicators:
· EMA5: 951.17, EMA10: 891.15, EMA30: 742.44 : price is well above all short-term EMAs, indicating a strong uptrend, but also overheating.
· BOLL(20,2): UB $1,071.61 / MB $786.40 / LB $501.18 : price is near the upper band, which often precedes a correction or consolidation.
· MACD: 17.06 (DIF: 106.97 / DEA: 89.91) histogram is positive but declining, which may signal slowing momentum.
· OBV(30): -225,154.79 negative despite price rise, indicating diver
ZEC+6.55%
  • 5
The gap between buying $INJ and actually using it on Injective just got smaller.
Coinbase now supports native $INJ for deposits and withdrawals directly on @injective.
That means users no longer need to deal with the ERC-20 version, wrapping, or another bridge before moving their $INJ onchain.
The flow is simple:
Buy $INJ on Coinbase → withdraw to Injective → use it across the ecosystem.
That includes staking, governance, onchain markets, tokenized assets, payments and AI-agent apps.
The important part is the infrastructure behind it. Native $INJ settles directly on Injective, so users avoid a
9.5$BTC Analysis
Weekend volatility is limited, so everyone can take advantage of the range to capture small swings back and forth. It’s time to relax and rest; we’ll livestream again and provide spot orders when volatility picks up.
The 4-hour chart shows a clear pullback, down ‑1.91%, with net capital outflows of $612 million as selling pressure continues to be released. The price fell below the upper Bollinger Band and retested the support zone near the middle Bollinger Band at 78520. The upper Bollinger Band at 81687 has turned into strong short-term resistance, while 75353 is an importan
post-image
BTC-1.58%
ETH-2.34%
SNDK+11.88%
Load More

Join 40 M users in our growing community

⚡️ Join 40 M users in the crypto craze discussion

💬 Engage with your favorite top creators

👍 See what interests you

View More