



Share your thoughts
placeholder
Article
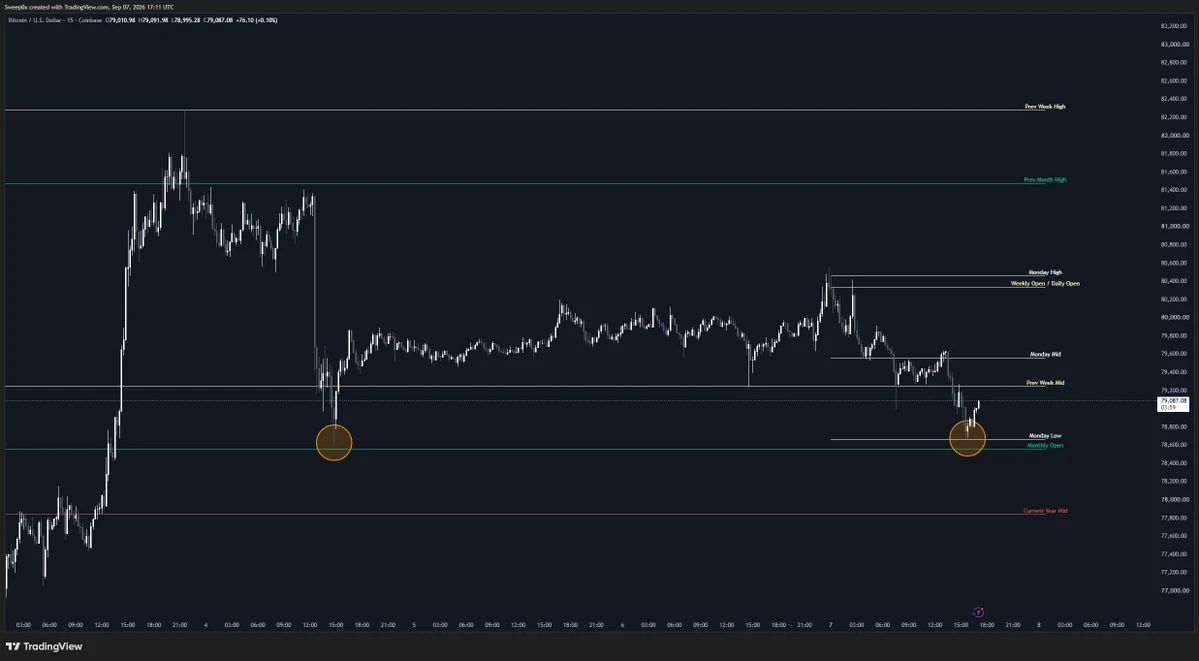
Bulls are defending Bitcoin monthly open
post-image
BTC-0.92%
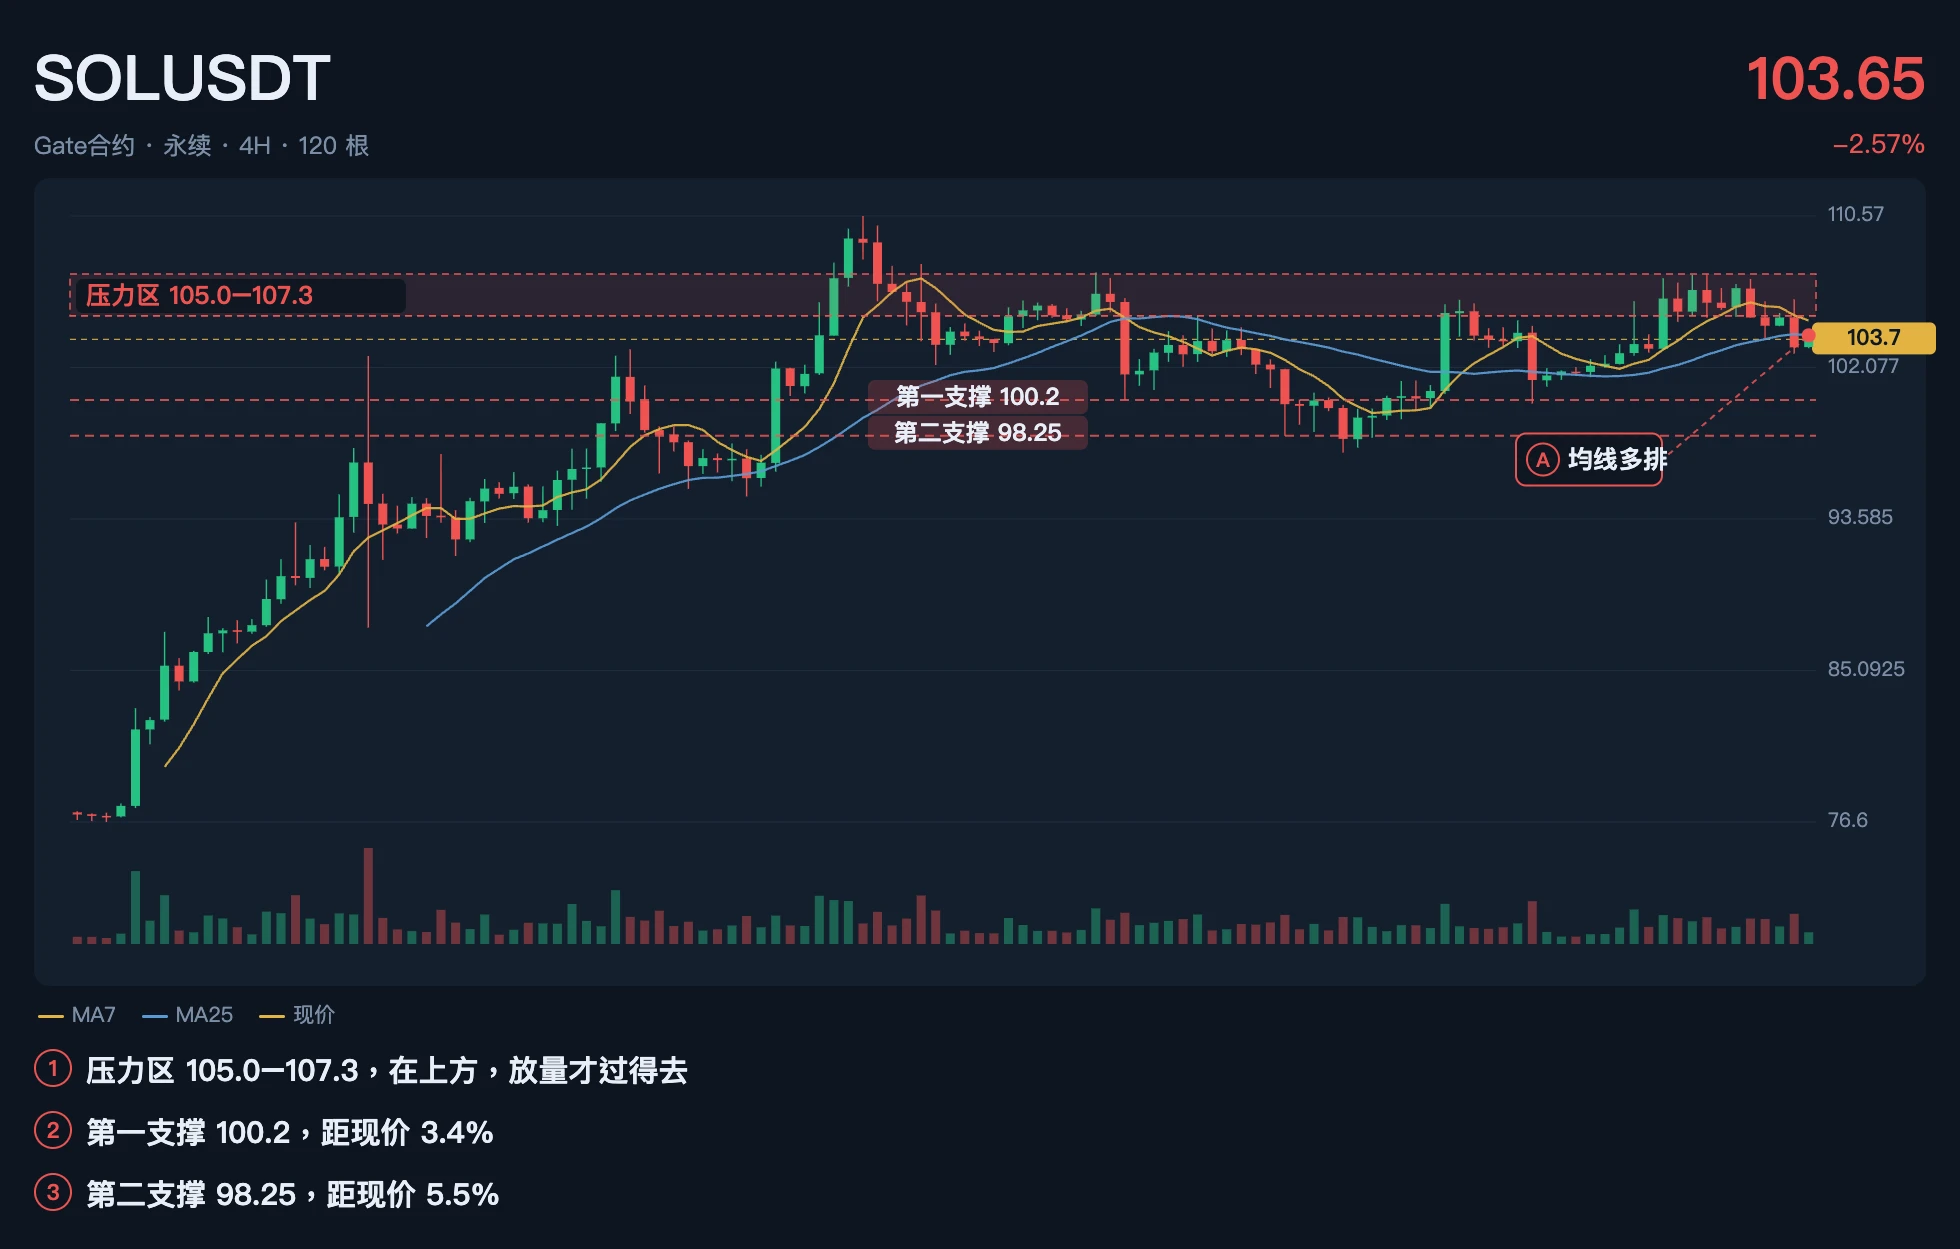
$SOL I’m bearish on this move. It fell 2.7%, while the retail long-short ratio rose from 1.96 to 2.02 and the large traders’ ratio rose from 2.43 to 2.50—both sides increased their long positions in the same direction, and no one has capitulated. This is not the structure of a bottom. The funding rate flipped from positive to negative, meaning those willing to pay to go long have exited; in the past hour, only 4 short positions were liquidated, while not a single long was liquidated, showing that none of the leverage has been forced out and all the overhead positions are still stacked above. I
post-image
SOL-2.28%
wake up
how are we gonna win money today?
post-image
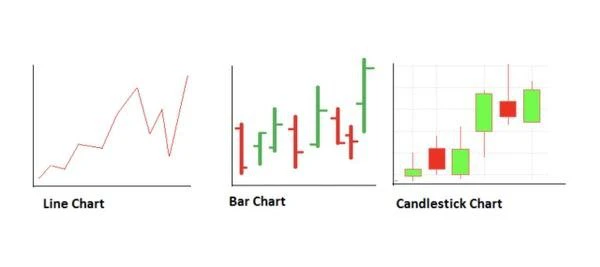
A candlestick chart is a combination of multiple candles a trader uses to anticipate the price movement in any market. In other words, a candlestick chart is a technical tool that gives traders a complete visual representation of how the price of an asset has moved over a given period.
The candlestick chart is a crucial price action tool that shows detailed information about price, including the open, close, high and low for a particular time frame. Still, it’s confusing when compared side-by-side with a bar chart.
post-image
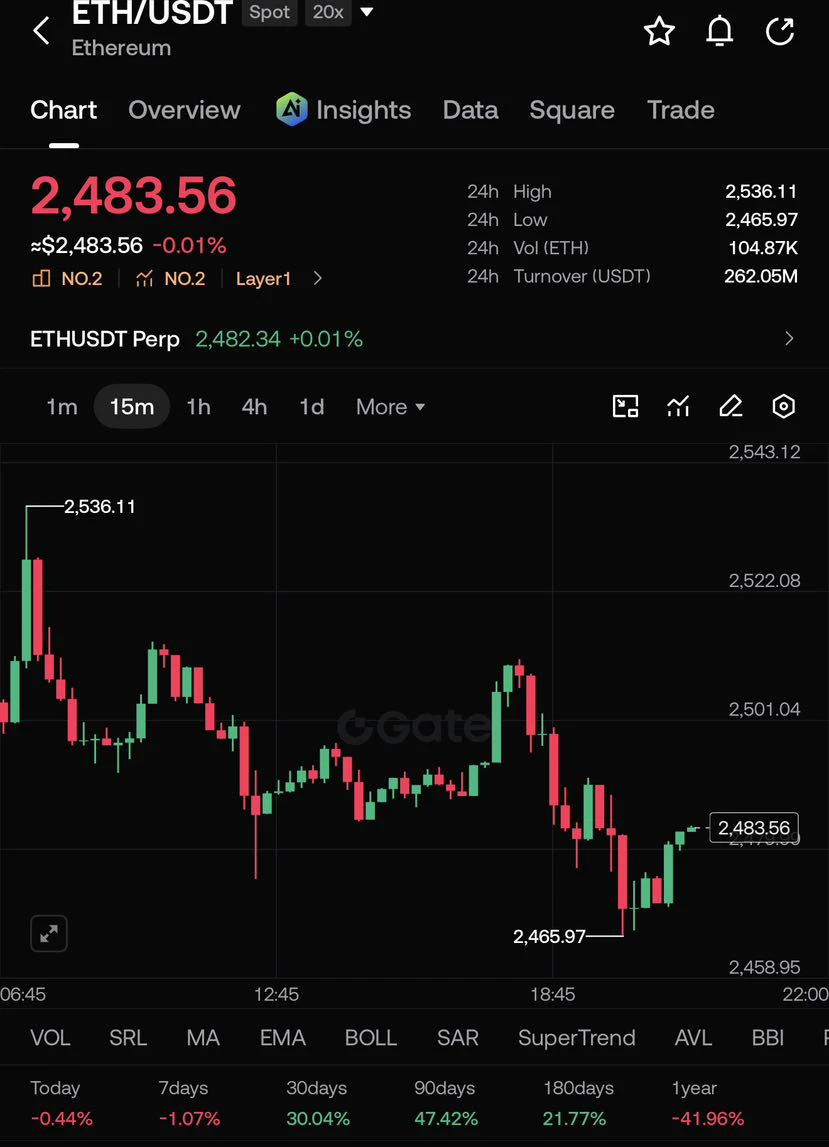
$ETH is trading at $2,483.56 after bouncing from the 24H low of $2,465.97. The 15-minute chart still shows short-term bearish pressure, but the latest candles indicate buyers are attempting a recovery from the session low.
The key numbers: 24H high $2,536.11, 24H low $2,465.97, 104.87K ETH volume, and $262.05M turnover.
For now, $2,465.97 is the critical support. A sustained recovery above the visible $2,501.04 area would strengthen the rebound and put higher levels back in focus. Failure to hold $2,465.97 would signal renewed downside pressure.
Performance remains mixed: -0.44% today, -1.07%
post-image
ETH-0.04%
  • 1
Short positions are easier to hold when the entry gives enough room. The rebound lacked volume, so I entered short when the price stalled at the highs, placing the protection level slightly above the previous high; with a poor entry, even a good-looking trade is hard to hold.
After entry, it churned for a while before starting to move. I took off 80% at the first target and moved the protection level for the remaining 20% to around the entry price. A mid-move pullback nearly stopped out the remainder, but with the protection price close enough, the subsequent drop completed the exit.
Looking b
post-image
ETH-0.05%
SOL-2.28%
post-image
Original content no longer visible
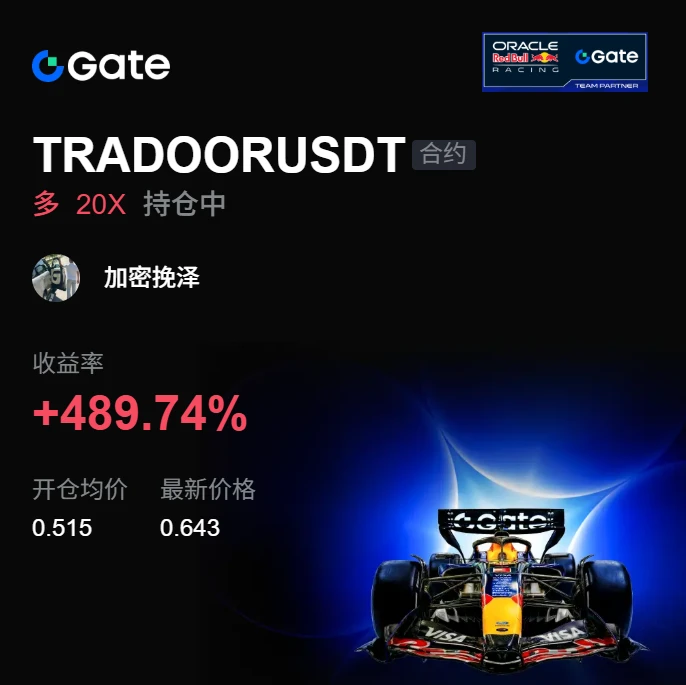
I originally wanted to cut my losses and sacrifice to the heavens, but the sacrifice never happened—the meat roasted itself. 🤣 The first thing I saw this morning was $TRADOOR shooting upward, and I knew these long positions were safe. I set the entry price at 0.515 and was worried I might have entered too early; now it has already been pushed up to 0.643, with a +489.74% return delivered straight to my doorstep.

It’s not that I can predict the future; while it was forming a bottom, it probed downward several times, and each time it was bought back up, showing that the bulls had not withdra
post-image
TRADOOR-7.22%
LAB-2.82%
SOL-2.28%
BTC, Gold, and Crude Oil Analysis
live-cover
LIVE2,540
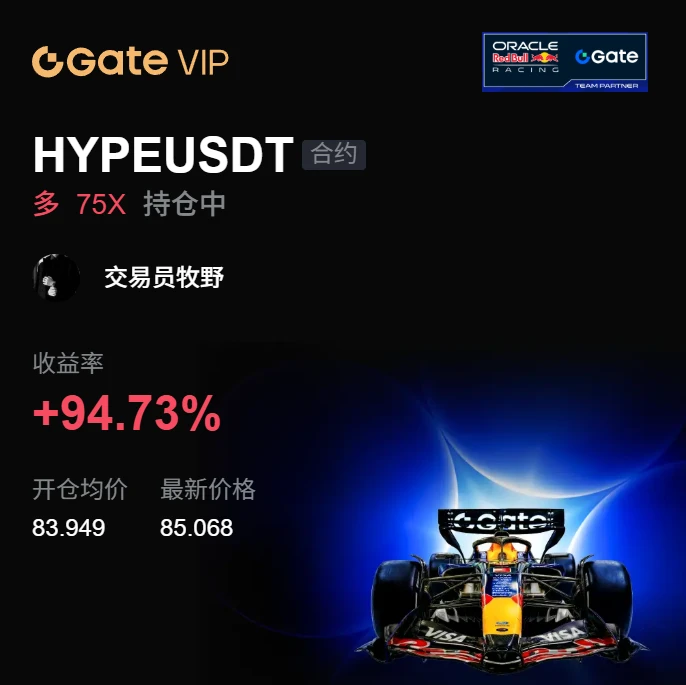
I did nothing—just went to the restroom, and when I came back, the candlestick chart had already done the work for me. During the intraday bottoming phase, $HYPE hovered around 83.949 for most of the day. It ranged sideways at the bottom without breaking down, so I judged that this wasn’t distribution but accumulation. I told myself then: hold this level and wait for it to show its hand. Bottoming is the biggest test of patience, but as long as the structure remained intact, I chose to believe. 🤣

I opened a long position and then went to take care of other things. When I opened the chart ag
post-image
HYPE-3.19%
ETH-0.05%
BTC-0.91%
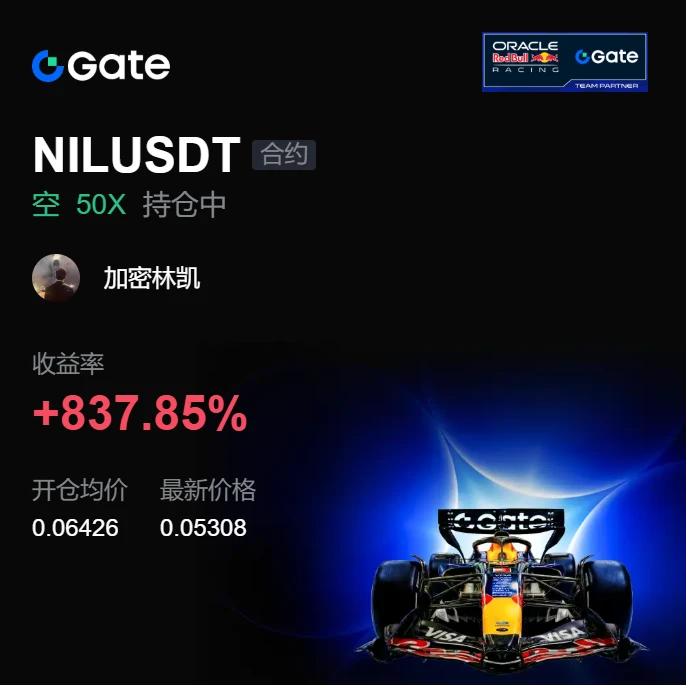
I originally wanted to cut losses and sacrifice the flesh to the heavens, but the sacrifice didn’t happen—the flesh roasted itself. 😏 A few days ago, when the screen was glowing green, $NIL staged a low-volume rebound. Selling pressure kept weighing on it, and the rebound couldn’t even touch the first key level. Faced with such a weak structure, not shorting would have been hard to justify.
Short entry at 0.06426; just now it hit 0.05308, with position gains of +837.85%. Time for a good meal, brothers. This time it wasn’t because I’m skilled—the market was in a good mood and casually tossed
post-image
NIL+2.08%
DOGE+0.67%
SNDK+0.94%
crypto + stock market update
live-cover
LIVE2,233
Insiders are quietly stacking shorts on SYMBOL while the 1d trend stays flat.

$PONS /USDT - SHORT

Trade Plan:
Entry: N/A – N/A
SL: N/A
TP1: N/A
TP2: N/A
TP3: N/A

Why this setup?
Why now? The 4h bias says SHORT with moderate conviction, so we lean into the sell side. The 15m RSI sits at 41.62, which means momentum is leaning bearish but has not collapsed into oversold yet. The 1h ATR is absent, so we rely on the 4h structure to size risk. The entry reference of 0.7241 gives us a precise level to initiate the short. The daily trend being range-bound means we expect the price to revisit the
PONS-12.13%
Why is everyone suddenly shorting ADA when the daily trend just refuses to break?

$ADA /USDT - SHORT

Trade Plan:
Entry: 0.2194 – 0.2210
SL: 0.2281
TP1: 0.2143
TP2: 0.2104
TP3: 0.2044

Why this setup?
Why now? The 1h price is pinned at 0.2202 inside a tight range, the 15m RSI sits at 51.47 showing no directional exhaustion, and the 1h ATR of 0.003282 proves volatility is compressing before a snap. The entry zone between 0.2194 and 0.2210 offers a defined risk window, TP1 at 0.2143 and TP2 at 0.2104 give layered profit-taking on a breakdown, and the daily range bias confirms sellers are def
ADA+0.50%
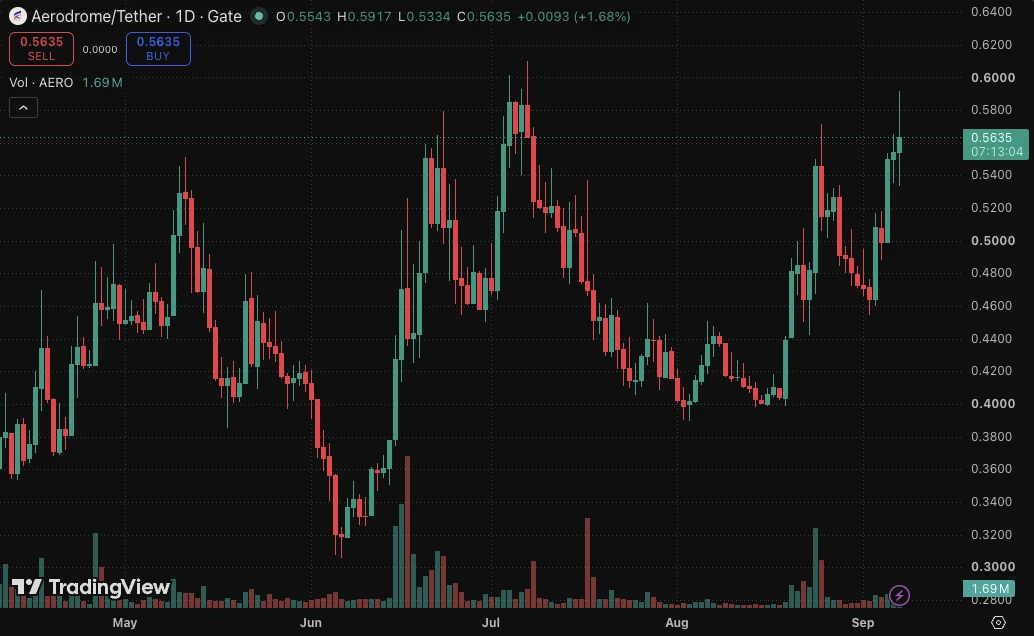
$AERO AERO is pressing into a key breakout area after months of accum
Price has reclaimed the major moving averages and is now testing the top of the broader range. The higher low, strong reaction from demand, and rising volume suggest buyers are gaining control.
The volume profile adds confluence. AERO has reclaimed the high-volume region, while the area above resistance is relatively thin, which could allow price to move more freely if the breakout confirms.
The Synergy Signal is also constructive, with momentum building through higher lows and pushing back into bullish territory.
For now, t
post-image
AERO+6.89%
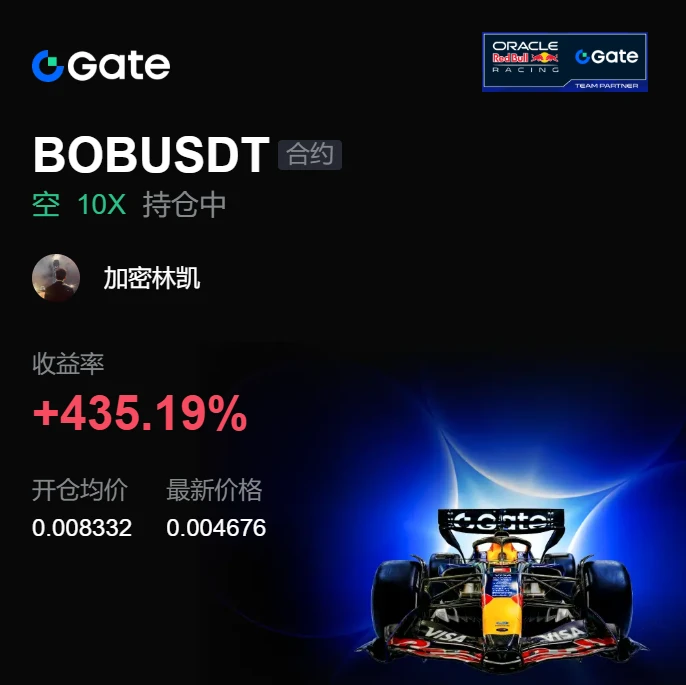
This trend doesn’t even require me to think—the account is dancing on its own. During the repeated intraday swings, $BOB ’s every rebound looked starved, with volume shrinking further and further, only to retreat whenever it touched the upper boundary. I knew then that this wasn’t a shakeout; someone was slowly exiting at the highs.
Around the resistance zone at 0.008332, I entered the short as planned, and specifically reminded everyone to stop chasing longs for the time being. Today, the market dropped straight to 0.004672, delivering a +435.19% return. That was a satisfying bite.
The curren
post-image
BOB-1.54%
SOL-2.28%
XRP-1.20%
HYPE might be setting up for a massive breakout everyone is sleeping on.

$HYPE /USDT - LONG

Trade Plan:
Entry: 85.289 – 85.755
SL: 83.284
TP1: 87.201
TP2: 88.320
TP3: 89.999

Why this setup?
Why now? The daily trend is bullish and the 1h price is sitting at 85.517, which aligns with an entry zone of 85.522. The 15m RSI at 34.91 shows oversold conditions that often precede a reversal, while the 1h ATR of 0.93268 tells us volatility is compressed before a potential expansion. If long, the first target is 87.201 and the second target is 88.320, but the trade invalidates hard if price breaks
HYPE-3.19%
#GateLaunchesTrenchesWith0GasFee
#Gate上线打金狗限时免Gas费
🚨 Gate Trenches is LIVE
Gate has launched Trenches, a new onchain trading product focused on social Meme trading across 15+ major blockchain networks.
Some highlights:
• 0.5% unified trading fee for buys & sells
• Limited-time 0 GAS on Robinhood Chain
• Supports Solana, Ethereum, BNB Chain, Base, Sui, Arbitrum, Avalanche, Polygon, and more
• Search-to-trade with real-time token data
• Social tools including Callout Leaderboard, KOL Leaderboard, and Active Accounts
The interesting part is the combination of onchain trading + social discover
MEME+0.01%
SOL-2.31%
ETH-0.04%
BNB-1.17%
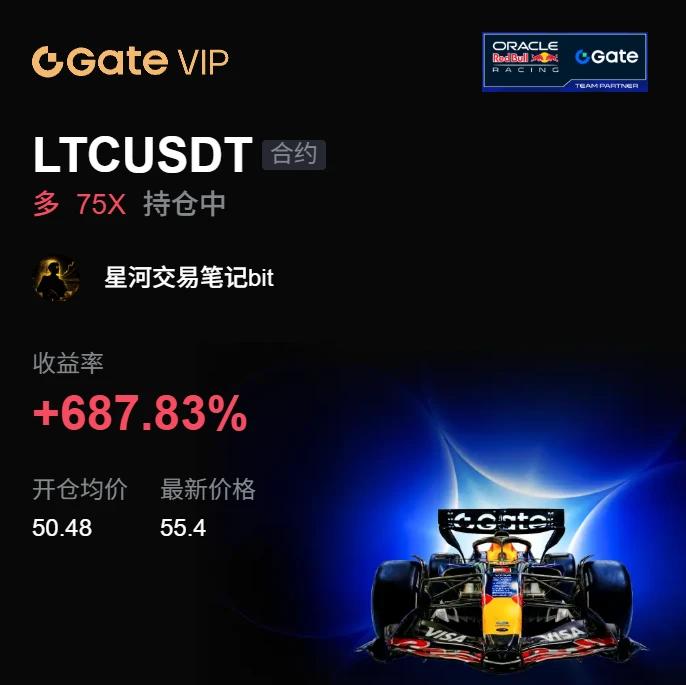
I didn’t chase the first rally because the price was too far above the moving average, and entering then would have made it easy to get stopped out by a wick. I waited for a pullback to stabilize before entering at 50.48 for this $LTC long.
After entering, the market went into weak consolidation, with increasingly narrow fluctuations and sharply declining volume. This is where patience is tested most; many people were worn down and stopped out manually. I held my core position without moving it and only gradually tightened my stop-loss.
When the consolidation range broke out on heavy volume, I
post-image
LTC+1.23%
SOL-2.28%
SNDK+0.94%
Load More

Join 40 M users in our growing community

⚡️ Join 40 M users in the crypto craze discussion

💬 Engage with your favorite top creators

👍 See what interests you

View More