Square
Following
Hot
News
Profile
Share your thoughts
placeholder
Article
10.9 Market Overview Analysis
ETH Silk Road Reference Setup
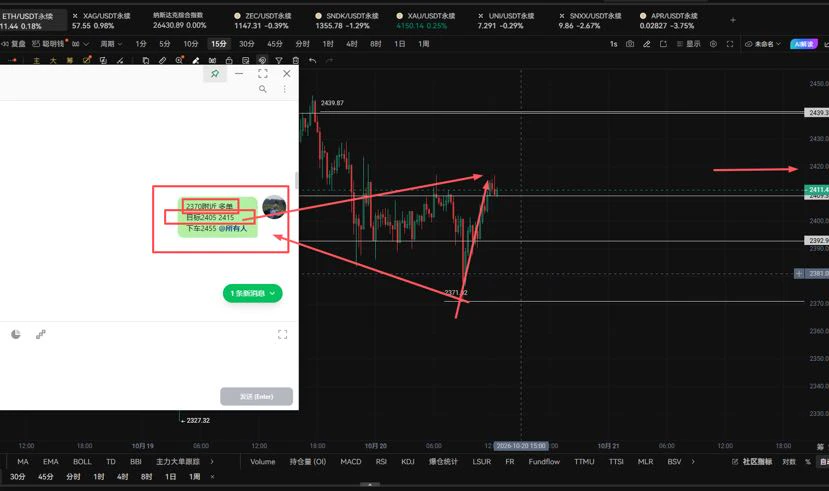
Rebound range: Long near 2460
Stop-loss: 2430
First target: 2500, second target: 2550
ETH is currently quoted near 2475. After the previous sharp decline, it tested a low of 2405.07 before forming a V-shaped short-term rebound. The MACD green bars continue to contract, indicating that bearish momentum has been fully released and that short-term rebound recovery is needed. However, the moving averages on the larger time frame are still trending downward. Overall, this is a weak rebound following a major decline. Long positions should o
BTC-0.46%
ETH-2.93%
#FedSeptemberMinutesLeanHawkish
The Federal Reserve’s September meeting minutes have delivered a significant signal to global financial markets. Policymakers remain concerned about persistent inflation, higher energy costs and the possibility that additional monetary tightening may be required.
On September 15–16, the FOMC unanimously approved a 25-basis-point rate increase, taking the federal funds target range to 3.75%–4.00%. The minutes, released October 7, revealed differing views about the reasons for tightening, but most participants considered another increase likely to be appropriate
🌅 Good Morning & Happy Friday! ☕📈 | Crypto Market Update
A fresh Friday brings new opportunities, new challenges, and another chance to approach the crypto market with patience and discipline. 💚🚀
Good morning, Gate community! 🌍✨ As we step into Friday, let's keep our eyes on the market, stay alert to changing conditions, and remember that successful trading is not about making a move every minute — it's about making informed decisions at the right time.
₿ Bitcoin (BTC): The Market Leader
Bitcoin remains the center of attention for crypto traders. Its price action, trading volume, and impo
post-image
BTC-0.40%
ETH-2.87%
  • 1
After retreating to the $81,000 level, Bitcoin recovered and settled around $82,000. The daily decline narrowed to 1.54%. However, the market remains focused on the $81,000 mark; this is precisely where buyers and sellers are squaring off.
The $81,000–$81,500 range is an area where buy orders have concentrated in recent days, with buyers increasing their positions there. Analysts identify the $81,119 level as support, while pointing to the $86,500–$86,750 range as resistance. In other words, $81,000 is not an arbitrary level; it is the floor that has held firm in recent weeks.
So, why did it d
post-image
User_any
#BTCPullsBackTo81000 Yo, so check it. Bitcoin slid under $82K for the first time in three weeks, and nah, it ain't one thing that did it. Three things hit at once, straight up.
First off, the Fed. Them September minutes dropped October 7, and all nineteen of 'em backed that quarter-point hike to 3.75–4.00%. Most said yeah, another one by year-end probably makes sense. But here's the thing — the market ain't buying it for October. Odds sitting at like 17% for October, but December? Around 70%. And that matters, 'cause when rates stay high, holding stuff that don't pay you nothing gets expensive. 10-year yield hanging near 5.3%, 30-year near 5.67%. That's decades-high type energy.
Second thing — Iran. Word is the White House told the Pentagon to get strike options ready, but nothing popping off before the midterms. Strait of Hormuz still a mess. Brent at $101.53, WTI at $89.39. Expensive oil means inflation ain't going nowhere, and that keeps the Fed chilling on the sidelines.
Third thing, and this the one that really hurt — leverage. Around $709 to $769 million in positions got liquidated in 24 hours. Longs took $647 to $685 million of that. Bitcoin longs alone, $172 million. Roughly 140,000 accounts got smoked. Open interest dropped 3.27% down to about $52.57 billion. That ain't people changing their minds — that's forced selling, plain and simple.
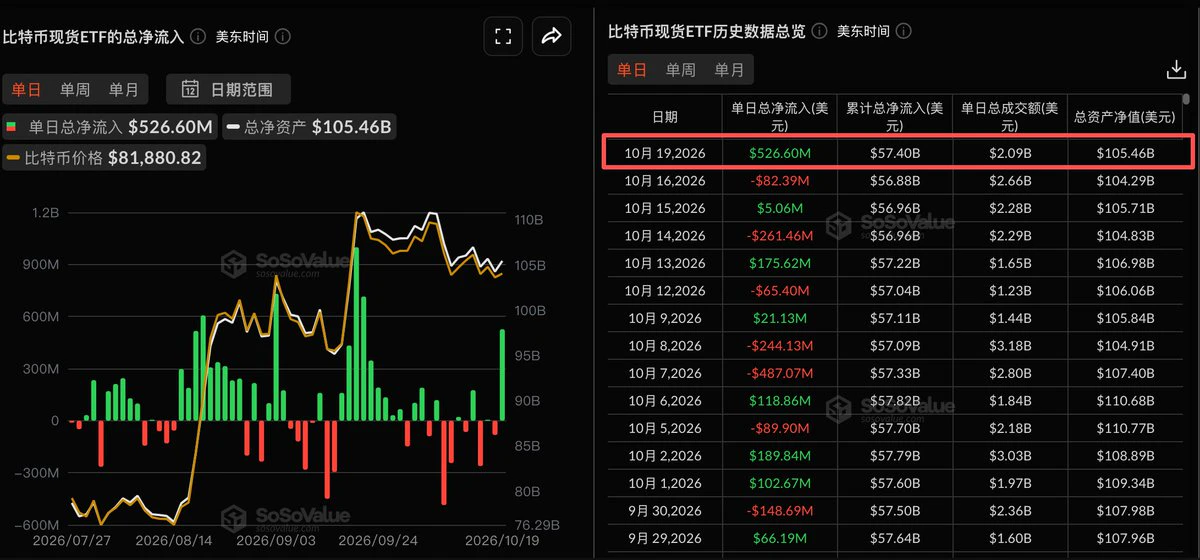
Institutional money? Mixed bag. US spot Bitcoin ETFs pulled in $118.86 million last session, total assets near $110.68 billion. But Ether ETFs? Lost $202 million same day. Them two ain't moving together no more.
Supply side — government wallets moved 12,267 BTC, 'bout $1.01 billion, to fresh addresses. No exchange deposit, so looks more like reshuffling than dumping.
Chart-wise, Bitcoin ran from $83,299 down to $80,397 before settling near $82,063. The $80,500 to $81,500 zone? That's where last month's highs sat, and that's what everybody watching. Hold there, we cool. Break it, and now we asking if the forced selling is done.
Next real test? October CPI and PPI. That's gonna tell us if inflation really cooling or if this pressure still building.
This ain't investment advice, just keeping it real.
$BTC ‌
BTC-0.40%
  • 4
  • 1
October 9 Bitcoin Analysis
Analysis: Short around 82000-82500 on the rebound, with defense at 83000, first target 80500, and second target 80000
The actual 1H chart shows that the price has oscillated downward from the interim high of 86664.9, closing multiple large bearish candles in succession before touching a low of 80344.8 and beginning a minor rebound. The overall downward trend structure remains intact. This rebound is a technical correction following the sharp decline and has not changed the market pattern dominated by bears, while bulls lack sustained buying-volume support for an upwa
post-image
BTC-0.40%
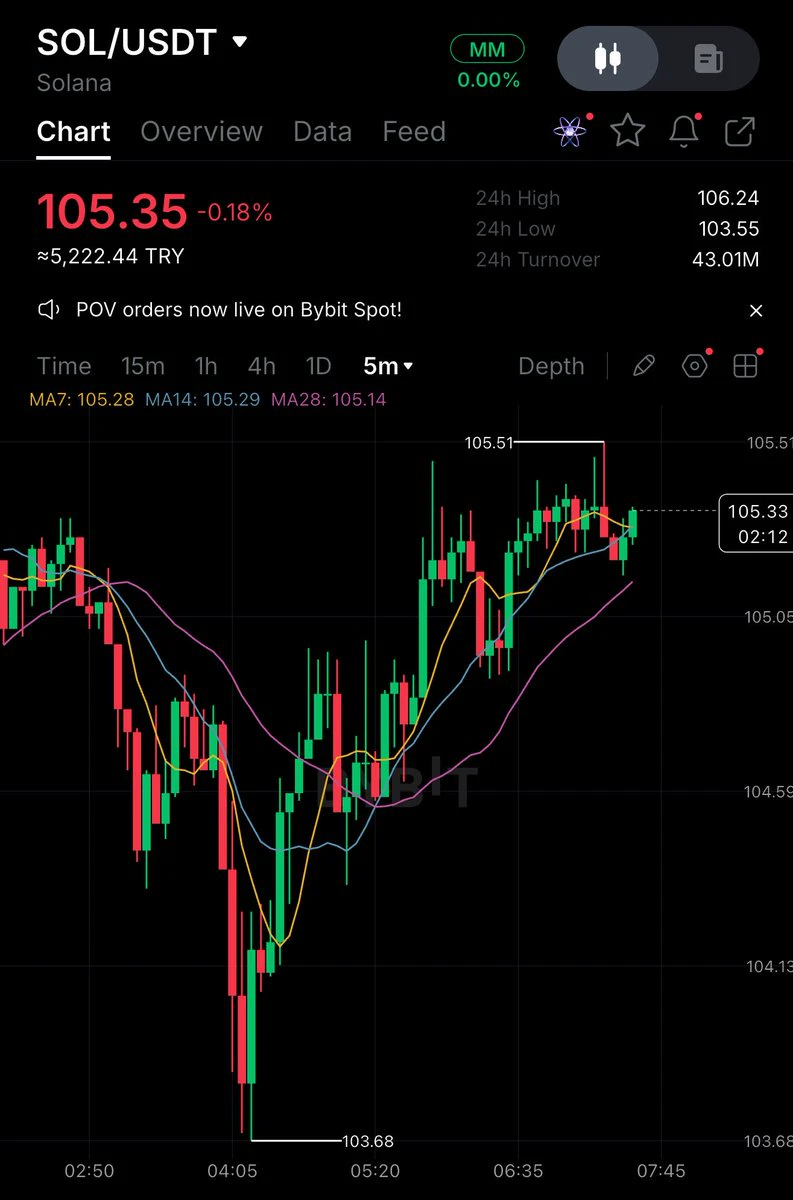
$SOL Crash panic! Retail investors are cutting losses and exiting, while Jump Crypto is aggressively buying the dip with 50 million in the opposite direction. Is 105 a golden buying opportunity or only halfway down? A quick look at the life-or-death battle between bulls and bears!
Retail investors are panic-selling at a loss while institutions quietly lock up their positions. The crash is not the end, but the starting point of wealth redistribution!
The Firedancer wallet under Jump Crypto has staked another 453,900 SOL. This is an extremely strong signal that institutions are openly bullish on
post-image
SOL-4.73%
  • 7
$BTC Current price 82256, 24h -0.77%, trading volume 1735.6M USDT, Fear & Greed Index 59, still in the greed zone—the price is drifting lower, but sentiment has not cooled, and this divergence usually means bulls have not surrendered yet, with selling pressure coming more from leverage than spot markets. On the funding side, funding rates across the market remain slightly positive, with longs still paying to hold positions, but the funding premium has been compressed, indicating that the willingness to chase longs is waning and shorts are beginning to cautiously add positions. In terms of liq
NEAR-10.95%
Market update
live-cover
LIVE1,779
$WDC You really broke my heart!
post-image
WDC-2.07%
10.9 ETH trading strategy
After a rapid decline, Ether bottomed out and rebounded around 2405, and has now entered a period of range-bound recovery, with short-term bullish momentum gradually returning. Focus is currently on the strength of buying support after a pullback. If support holds, there is still room for further rebound.
$ETH #Vitalik警告AI或将加速削弱密码学安全
Focus on going long on pullbacks, waiting for the price to stabilize before entering at an opportune time, and avoid blindly chasing highs. If support breaks, remain on the sidelines for now and wait for a new directional signal.
Entry:
post-image
ETH-2.93%
🔻 𝐁𝐈𝐓𝐂𝐎𝐈𝐍 & 𝐄𝐓𝐇𝐄𝐑𝐄𝐔𝐌 𝐀𝐑𝐄 𝐃𝐑𝐎𝐏𝐏𝐈𝐍𝐆 — 𝐇𝐎𝐖 𝐋𝐎𝐖 𝐂𝐀𝐍 𝐓𝐇𝐄𝐘 𝐆𝐎?
Bitcoin ($BTC) and Ethereum ($ETH ) are facing renewed selling pressure, putting the market's bullish momentum under serious examination.
🔶 𝐖𝐡𝐚𝐭 𝐭𝐡𝐢𝐬 𝐦𝐞𝐚𝐧𝐬:
🔸 Bitcoin ($BTC): If BTC continues making lower highs and lower lows, sellers may remain in control. A breakdown below key support could trigger further downside and liquidations.
🔸 Ethereum ($ETH): ETH could face additional pressure if Bitcoin's weakness continues. Watch whether ETH holds its own support or underperforms BTC d
post-image
ETH-2.93%
Everyone is missing the real short setup forming right now in $CL /USDT.

$CL /USDT - SHORT

Trade Plan:
Entry: 90.06 – 90.38
SL: 91.76
TP1: 89.07
TP2: 88.30
TP3: 87.15

Why this setup?
Why now? The daily trend is range, which means price is coiling for a directional break and the 1h ATR of 0.640054 shows enough volatility to fuel a move. The 15m RSI at 34.75 confirms bearish momentum without being overextended, giving the entry zone of 90.06 to 90.38 a high-probability trigger. If price reacts from there, the first target sits at 89.07, with the second target at 88.30 offering a clean risk
post-image
CL+0.46%
Trade XAG Futures, Share USDT and SLVON Prize Pool https://www.gate.com/campaigns/6351?ref=VLARBF1YAG&ref_type=132
post-image
XAG+0.23%
SLVON+0.14%
The whole $ZEC saga is so absurd it makes me laugh.
Someone posted online that they held from 1700 all the way down to 1100. Even eight years of war resistance didn’t involve tactics like that. They gave themselves the title of “the most resilient bagholder.” Fair enough—bro, you can really hold the line. I salute you.
An old coin that once valued privacy has fallen this far and ended up as a meme across the entire internet, which shows just how badly everyone has been fleeced—so broke they can only survive on jokes.
Laugh all you want, but I genuinely wouldn’t dare catch it at this level. Let
post-image
ZEC-6.38%
$NEAR Whale addresses continue accumulating, and holdings concentration has hit a new high! Retail FOMO is heating up—how far can this rally go?#Gate.io 🔥 #Gate广场中秋团圆局
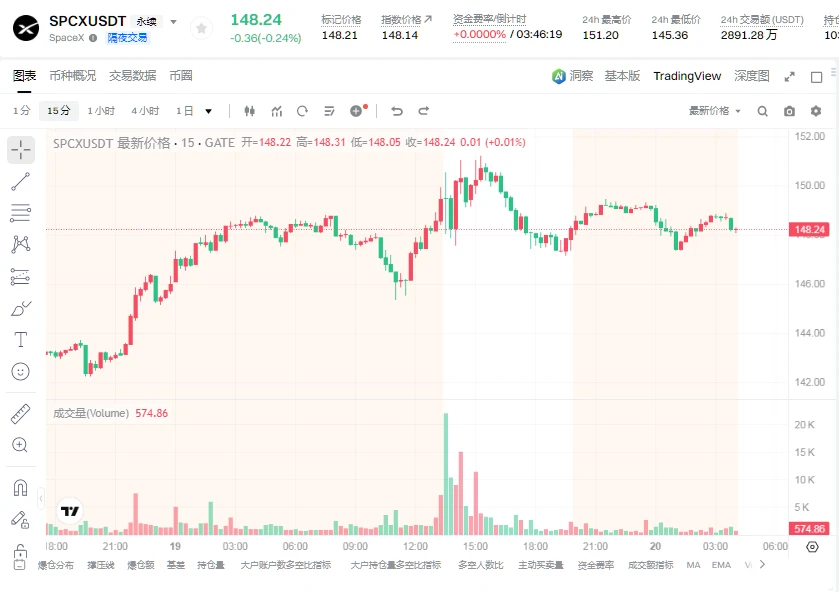
A technical analysis and a potential trade plan of $SPCX ‌
Chart Analysis
1. The 1-Hour Chart (Macro View )
· Trend: The overall trend on the 1H chart is bearish. The price recently suffered a sharp drop from ~170.57 down to a low of 155.69.
· Current State: The price is currently in a corrective bounce (retracement) after that steep drop. It is trading around 160.16.
· Moving Averages: The price is currently testing the MA5 (159.82) and MA10 (158.91) and has pushed above them, but it remains below the MA30 (160.63), which acts as immediate dynamic resistance.
· MACD: The MACD histogram is be
SPCX-4.18%
BTC and Ethereum market surges predictions
live-cover
LIVE2,411
Retail investors see institutions’ disclosed holdings and want to copy their homework,
but an institution’s 10% and a retail investor’s 10% are fundamentally not the same thing.
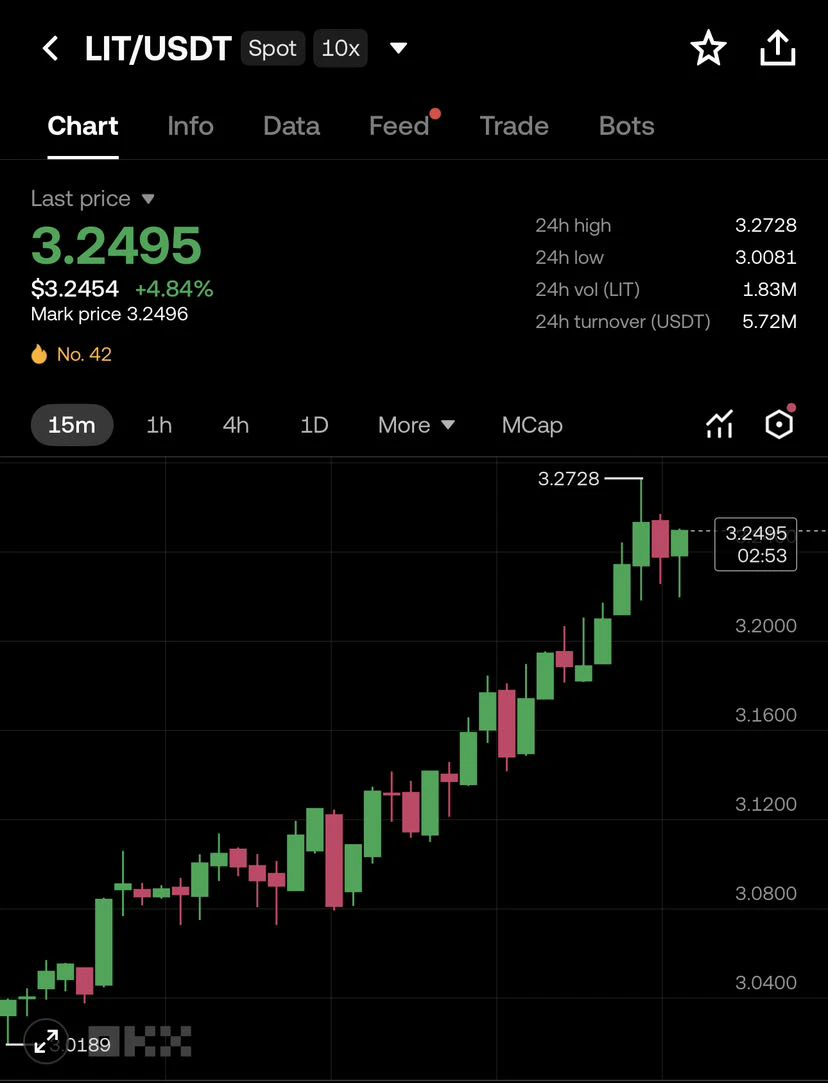
Last night, BTC fell to around 80k, and Citrini disclosed a crypto investment portfolio. DRV, LIT, and ETHFI each accounted for 10%, while AAVE and ENA each accounted for 9%; SOL, HYPE, and AERO were also included.
Many people immediately saved screenshots of the list, preparing to copy it when prices dipped.
What institutions put out is a portfolio weighting table. 10% means, “This asset accounts for this prop
post-image
BTC-0.40%
DRV+25.57%
LIT+5.43%
ETHFI-3.28%
AAVE-4.36%
The Fear & Greed Index is still at 59 in the greed zone, so many people assume altcoins should follow the rise—but this is a typical trading misconception. The Greed Index reflects the overall market’s sentiment temperature, not a buy signal for any individual coin. When BTC trades sideways at highs and funds concentrate in a few sectors, coins lacking narrative support may instead bleed against the trend. ADA is a current example.
$ADA Current price: 0.2332, down 9.44% over 24h, with a trading volume of 69.5M USDT. Technically, MA5=0.23322 has fallen below MA20=0.239145, forming a bearish mo
post-image
ADA-7.33%
NEAR-10.95%
$CRV has fallen to near the lower Bollinger Band—is this a bottom-fishing opportunity or a continuation of the downtrend?
First, the conclusion: From a technical perspective, this is a short-term long opportunity driven by an oversold recovery, rather than a trend reversal.
$CRV is currently at 0.3423, down 12.92% over 24h, but the price has clearly moved toward the lower Bollinger Band around 0.3092. MA5 (0.3379) remains below MA20 (0.3525), and the bearish alignment has yet to recover, indicating that medium-term pressure remains. However, RSI has fallen to 40.6, approaching the oversold z
post-image
CRV-12.87%
Load More

Join 40 M users in our growing community

⚡️ Join 40 M users in the crypto craze discussion

💬 Engage with your favorite top creators

👍 See what interests you

Trending Topics

Gate Money Officially Launches

3.49k Views12.91k Discussing

Gate officially launches Gate Money, a global integrated financial services app that brings digital assets, fiat, stocks, ETFs, gold, bank accounts, and payments into one Gate App. Users can manage assets, invest, send and receive funds, convert currencies, and make payments — all from a single account. Which use case are you most excited about? [👉 Learn more](https://www.gate.com/announcements/article/102094)

BTC Pulls Back to 81000

25.4k Views35.66k Discussing

AIStocksFallALABDropsOver9%

24.57k Views543 Discussing

View More