



Share your thoughts
placeholder
Article
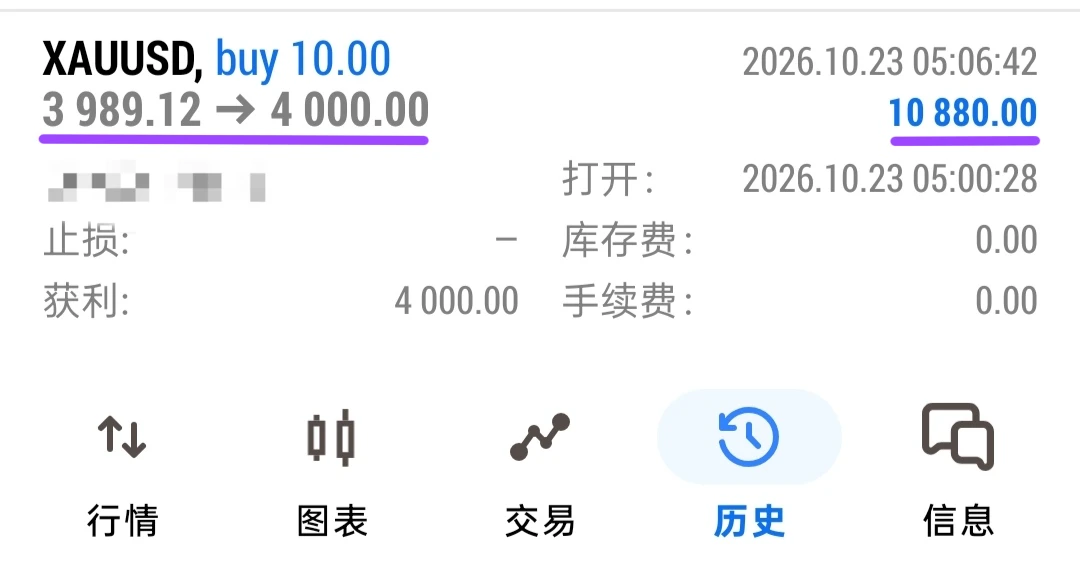
Strategy Feedback!
It genuinely makes me happy when you guys make profits using the strategy I shared with you.
I can't change negative minds. The results speak for themselves.
post-image
  • 3
Layout for Bitcoin, Ethereum, and Dogecoin
live-cover
LIVE2,245
  • 1
#WTI原油 Could Oil Prices Face a “Major Collapse”? Bessent: Crude Could Fall to $40-$50 After Iran Conflict Ends
U.S. Treasury Secretary Bessent said that once the Iran conflict ends, international oil prices could plunge sharply, potentially falling to $40-$50 per barrel. As energy prices retreat, global bond yields, which have recently been driven higher by rising oil prices and inflation concerns, may also decline.
He said in an interview Friday that once the current Iran conflict ends, the global oil market could shift back to a situation of clear oversupply. Bessent said: “We will ultimatel
XBRUSD+0.01%
  • 15
  • 1
ETH at $2,450—are you chasing?
Look at the surface: the medium-term structure has turned bullish, but the short term is grinding inside a range.
In mid-to-late August, ETH broke through the descending trendline on heavy volume from $1,900 and moved above Fib 0.618 ($2,438), setting a new higher high for this cycle. Spot ETFs have maintained net inflows, totaling approximately $1.85 billion in August, and institutional allocation shows no sign of stopping.
But then what happened? It stalled at $2,546 and pulled back to oscillate around $2,450. Macro rate-hike expectations are weighing on it, ke
post-image
BTC-1.81%
ETH-2.55%
SOL-1.51%
  • 3
Checking back on $MARSCOIN ‌ – the pump is still going but momentum is slowing!"
MARSCOIN is now up 32.71% at $0.23466, after hitting a 24h high of $0.24888. The 24h low is $0.16000 – that's a massive range. EMA5 ($0.23139) and EMA10 ($0.22164) are both below price, while EMA30 ($0.20224) is well below – the trend is still bullish. MACD is positive at 0.00471, with DIF (0.01389) well above DEA (0.00917) – but I'm noticing the histogram is starting to flatten, which tells me the momentum is slowing. Volume is still strong, but the candles are getting smaller near the highs. Resistance at $0.24
post-image
MARSCOIN+31.99%
  • 4
  • 2
No trades, no analysis, just sheer luck—this track record is embarrassing even to talk about. 😂
When the screen was full of green, I was unusually calm. The rebound looked lively, but the buying support below was clearly weak. Selling came wave after wave, and a rise without enough support is ultimately just a paper tiger. The order I placed before bed a few days ago was filled by the time I woke up. Solid. With the entry positioned well, I could even sleep soundly.
Don’t let profits inflate your ego, and don’t despair over a pullback. I’d rather miss a limit-up move than catch a falling knif
post-image
XRP-3.04%
ADA-3.48%
Everyone’s staring at LTC’s range—but the 4H clock just started ticking against the bulls.

$LTC /USDT - SHORT

Trade Plan:
Entry: 52.7 – 52.9
SL: 54.1
TP1: 51.9
TP2: 51.2
TP3: 50.3

Why this setup?
- Price pinned at 52.8 with a hard ceiling at 52.9–53.0, while RSI (15m: 46.9) shows zero momentum to break out.
- 1D trend is *range*, not uptrend—so the path of least resistance is down toward TP1 (51.9) and TP2 (51.2).
- ATR (1h: 0.53) confirms tight coils precede sharp moves; the short setup is armed with SL at 54.1, risking only 1.3 for a 3.2+ reward.
- Why now? The 4H bias flipped SH
LTC+3.88%
I did nothing—just went to the restroom, and when I came back, the K-line had already done the work for me.
When I returned, $PUMP ’s short position had already touched 0.004184, moving another long way from my 0.004390 entry, with +331.34% going straight into the account. Truly, one minute in the restroom and the K-line covered half the journey.

While everyone else was still watching from the sidelines, I already felt something was off with the market. Several rebounds in a row came without volume, trading volume kept shrinking, and the selling pressure grew heavier with each wave. This was
post-image
PUMP-1.35%
SNDK+10.02%
LAB+5.72%
$AAPL remains a key stock to watch as market momentum develops. 📈 #STOCKS
post-image
AAPL-2.51%
#OpenSky百日筑基 Day 68】⚡️
Those who establish themselves first in the communications layer will have the chance to define the next decade. 🚀
As Web3 enters the AI era, private communications are changing from an “option” into a “matter of life and death.”
OpenSky has already broken through—communication primitives, Agent-level privacy, and end-to-end encryption, with the full stack ready.
Early movers define the rules, while latecomers follow them. Not every project can catch the right timing, but OpenSky is already in place. 🔥
OpenSky #Web3 #AI通信#The next decade
I only wanted to mooch a breakfast, but the market ended up trapping me for half a year.

A few days ago, during that early-morning pullback, to be honest, many people were shouting that support had broken. I kept staring at the $DGAI /DGAI chart, and the key level never actually broke; instead, volume kept stabilizing. I posted one sentence at the time: sideways action at the bottom isn’t weakness—it’s funds quietly accumulating. The long position entered at 0.6959 and slowly climbed to 0.7841, taking the paper profit straight to +249.73%. I’m not going to preach about having a long-term visi
post-image
DGAI-0.87%
ZEC+0.50%
DOGE-1.66%
This trend doesn’t even require me to think—the account is dancing on its own. When I checked the charts after lunch, the volume-price action was already off. It was rising without volume, with no one buying into the move; every push upward was just short of enough. I’m most wary of this kind of bloated-looking market, so I decisively followed the rhythm.
From 186.14 to 198.74, +480.64% secured—everyone on board should be grinning in their sleep. I didn’t panic at all while others were running because the logic was already laid bare: volume failed to keep up, the rebound was weak, and this kin
post-image
BNB+4.20%
XRP-3.04%
What’s going on with X?
Why is it still verifying?
I opened it, but there’s nothing there.
Another bug?
Don’t rush; I’ll be promoted to junior trader in a few days. Don’t worry about there being no positions. My current trading style involves tiny positions, so profits will come very, very slowly. However, it’s difficult to open positions at the current level because Xianyu is a bottom- and top-fishing trader, not someone who chases rallies or declines. Please forgive me, everyone following my trades. #美国8月非农超预期 $BTC $ETH $DOGE
post-image
BTC-1.81%
ETH-2.55%
DOGE-1.64%
🚀 牛来 (NiuLai)/USDT Explodes +30%: Is a Retest of Local Highs Imminent? 🐂📈
The meme coin sector is heating up, and 牛来 (NiuLai)/USDT is stealing the spotlight today with a massive 30%+ surge in the last 24 hours! Let's break down the multi-timeframe technicals to see where this momentum might take us next.
📊 Multi-Timeframe Technical Breakdown:
1-Day Chart:
The Macro Reversal
Looking at the daily timeframe, 牛来 has formed a massive bullish engulfing candle, decisively bouncing off the lower support zone near 0.076. The MACD histogram is flashing green, indicating that
牛来+33.65%
  • 7
$SUI Title SUI Network: Macro Accumulation Zone ($0.50–$0.70) & Long
Macro Structure & Thesis:
SUI continues to demonstrate robust fundamental architecture through its object-centric data model and parallel execution engine. Price action has compressed directly into a high-timeframe macro discount accumulation zone between $0.50 and $0.70, presenting a textbook area for patient, long-term capital allocation.
Accumulation Strategy: Patiently building spot exposure within this range away from retail noise aligns with smart money positioning.
Outlook: As network adoption scales and macro market c
post-image
SUI+1.55%
UNI at $6.3—are you chasing it or not?
First, the surface view: it has doubled in a month, and everyone is shouting, “UNI has gone crazy.”
It was still languishing at 3.2-3.6 in mid-August, climbed above 5 at the end of August, and surged to 6.5 in early September. Today it is ranging between 6.11-6.35, with little 24-hour volatility, but it is still up 90%+ over the past month.
RSI is at 78-80, already overbought. The trend is bullish, but the slope is too steep, and 6.5 has held three times.
First: UNI is no longer just a governance token—it is “burning money.”
Previously, UNI only provided
post-image
BTC-1.81%
ETH-2.55%
UNI-1.78%
【$BULLAU Signal】Long | Buy zone on pullback, stop-loss fixed at 0.0573
$BULLAU 4H RSI 65.9, funding rate 0.1186%, and the holding cost for long positions is relatively high. The current price of 0.060296 is in the selling-pressure release zone after two consecutive bearish 1H candles.
🎯Direction: LONG
⚡Entry/Pending Order: 0.06011511 - 0.06029600
🛑Stop-loss: 0.05728120
🚀Target 1: 0.06481820
🚀Target 2: 0.06707930
🛡️Trade Management:
- Execution strategy: After reaching Target 1, reduce the position by 50% and move the stop-loss up to the breakeven point. If the price falls back to the entr
post-image
BTC-1.81%
ETH-2.55%
SOL-1.51%
A trader made two “FOMO” trades in one day, accumulating losses of $907,000
live-cover
LIVE1,879
Load More

Join 40 M users in our growing community

⚡️ Join 40 M users in the crypto craze discussion

💬 Engage with your favorite top creators

👍 See what interests you

View More