
Share your thoughts
placeholder
Article
$MEME 🚀🚀💥💥
post-image
MEME-2.11%
$DOOD Signal】Long acceleration + 1H/4H momentum resonance
$DOOD RSI 89.6, 4H Bollinger upper band at 0.0017 has been breached, and 1H MACD continues to expand. The funding rate is relatively high at 0.0417%, while depth imbalance stands at -8.36%, with sell orders slightly dominant. OI remains stable, with no large-scale exits. With price having risen to the current level and the stop-loss kept tight, the odds of capturing the short-term acceleration segment depend on the target structure.
🎯Direction: Long
⚡Entry/Limit order: 0.00185143 - 0.00185700
🛑Stop-loss: 0.00183843
🚀Target 1: 0.0018
post-image
DOOD+24.17%
BTC+0.09%
ETH+1.12%
SOL+2.27%
#BTC Morgan Stanley is quietly buying Bitcoin, while market makers are opening short positions—which side are you on?
On one side, traditional financial giants are adding to their Bitcoin holdings with real money; on the other, crypto market makers are aggressively opening short positions on-chain. The same market, two completely opposite bets.
On September 5, these two pieces of news emerged almost simultaneously, once again putting the question of whether institutions are actually bullish in the spotlight.
① Morgan Stanley: 355 BTC bought in 4 days According to on-chain monitoring, Morgan St
post-image
BTC+0.09%
ETH+1.12%
HYPE+2.76%
ASST+1.21%
BMNR-5.48%
$RAYSOL 24-hour gain of 44.9%, but the current price of 1.2625 has already retraced 12% from the high of 1.4422—you think it’s an entry opportunity, but I’m telling you this big bullish candle is most likely a bull trap before a long squeeze. Trading volume of 400 million looks lively, but the retreat after the price spike shows that someone was aggressively selling above 1.44. There is no financial news supporting it today; it’s purely a sentiment-driven move. This type of coin is the most dangerous—the pump relies entirely on momentum, and once that momentum breaks, the price will cascade.
T
$BTC /USDT Perp – "V-Shape Recovery – Long"**
**Trading Plan Long $BTC
Entry: 79780
SL: 79500
TP1: 79937
TP2: 80083
Explanation: Strong recovery from the 79,170 low with a bullish MACD (13.3), targeting the 79,937 yellow line and the 80,083 high.
post-image
BTC+0.08%
  • 4
  • 2
I originally wanted to cut my losses as a sacrifice to the heavens, but the ceremony never happened—the meat cooked itself instead🍖A few days ago, the last thing I saw before bed was $SEI pushing slightly higher again, but the volume looked nothing like a genuine breakout. The selling pressure was massive, with someone dumping every time it surged. I thought to myself, if I don't short this level, I'd be letting myself down, so I entered directly at 0.06851. Feeling great, brothers😎

The subsequent price action gave me the complete answer, sliding all the way from my entry price to 0.04914.
post-image
SEI+3.11%
XRP+0.36%
ADA+0.77%
$NAORIS Signal】Long — building momentum at 1H support
$NAORIS 4H RSI 81.99, order book depth imbalance at -19.23%, with sellers in control. The 1H MACD histogram has narrowed to 0.0003, indicating weakening bullish momentum. Price remains above the 1H EMA20 at 0.0358, and the short-term structure remains intact. Funding rate is 0.0437%, OI is stable, and no extreme long/short positioning bias is visible. The current risk-reward ratio is 1.5, limiting the cost-effectiveness of chasing longs, but buying support exists near 0.0385 below.
🎯Direction: Long
⚡Entry/Limit order: 0.038484 - 0.038600
post-image
NAORIS+22.60%
BTC+0.09%
ETH+1.12%
SOL+2.27%
This return has me feeling both thrilled and apprehensive, afraid the market will come to its senses tomorrow and blacklist me.

A few days ago before bed, $XAU made another push upward. When it approached 4474.29, my heart skipped a beat: I couldn't chase the long; the rebound was weak and volume hadn't followed through. No matter how I looked at it, it seemed like a bull trap. At that point, I placed another short order, set the stop-loss above, and shut down my computer to sleep. When I opened my eyes this morning, the price had already slid to 4428.93, and the return had jumped straight
post-image
XAU-0.14%
SNDK+1.08%
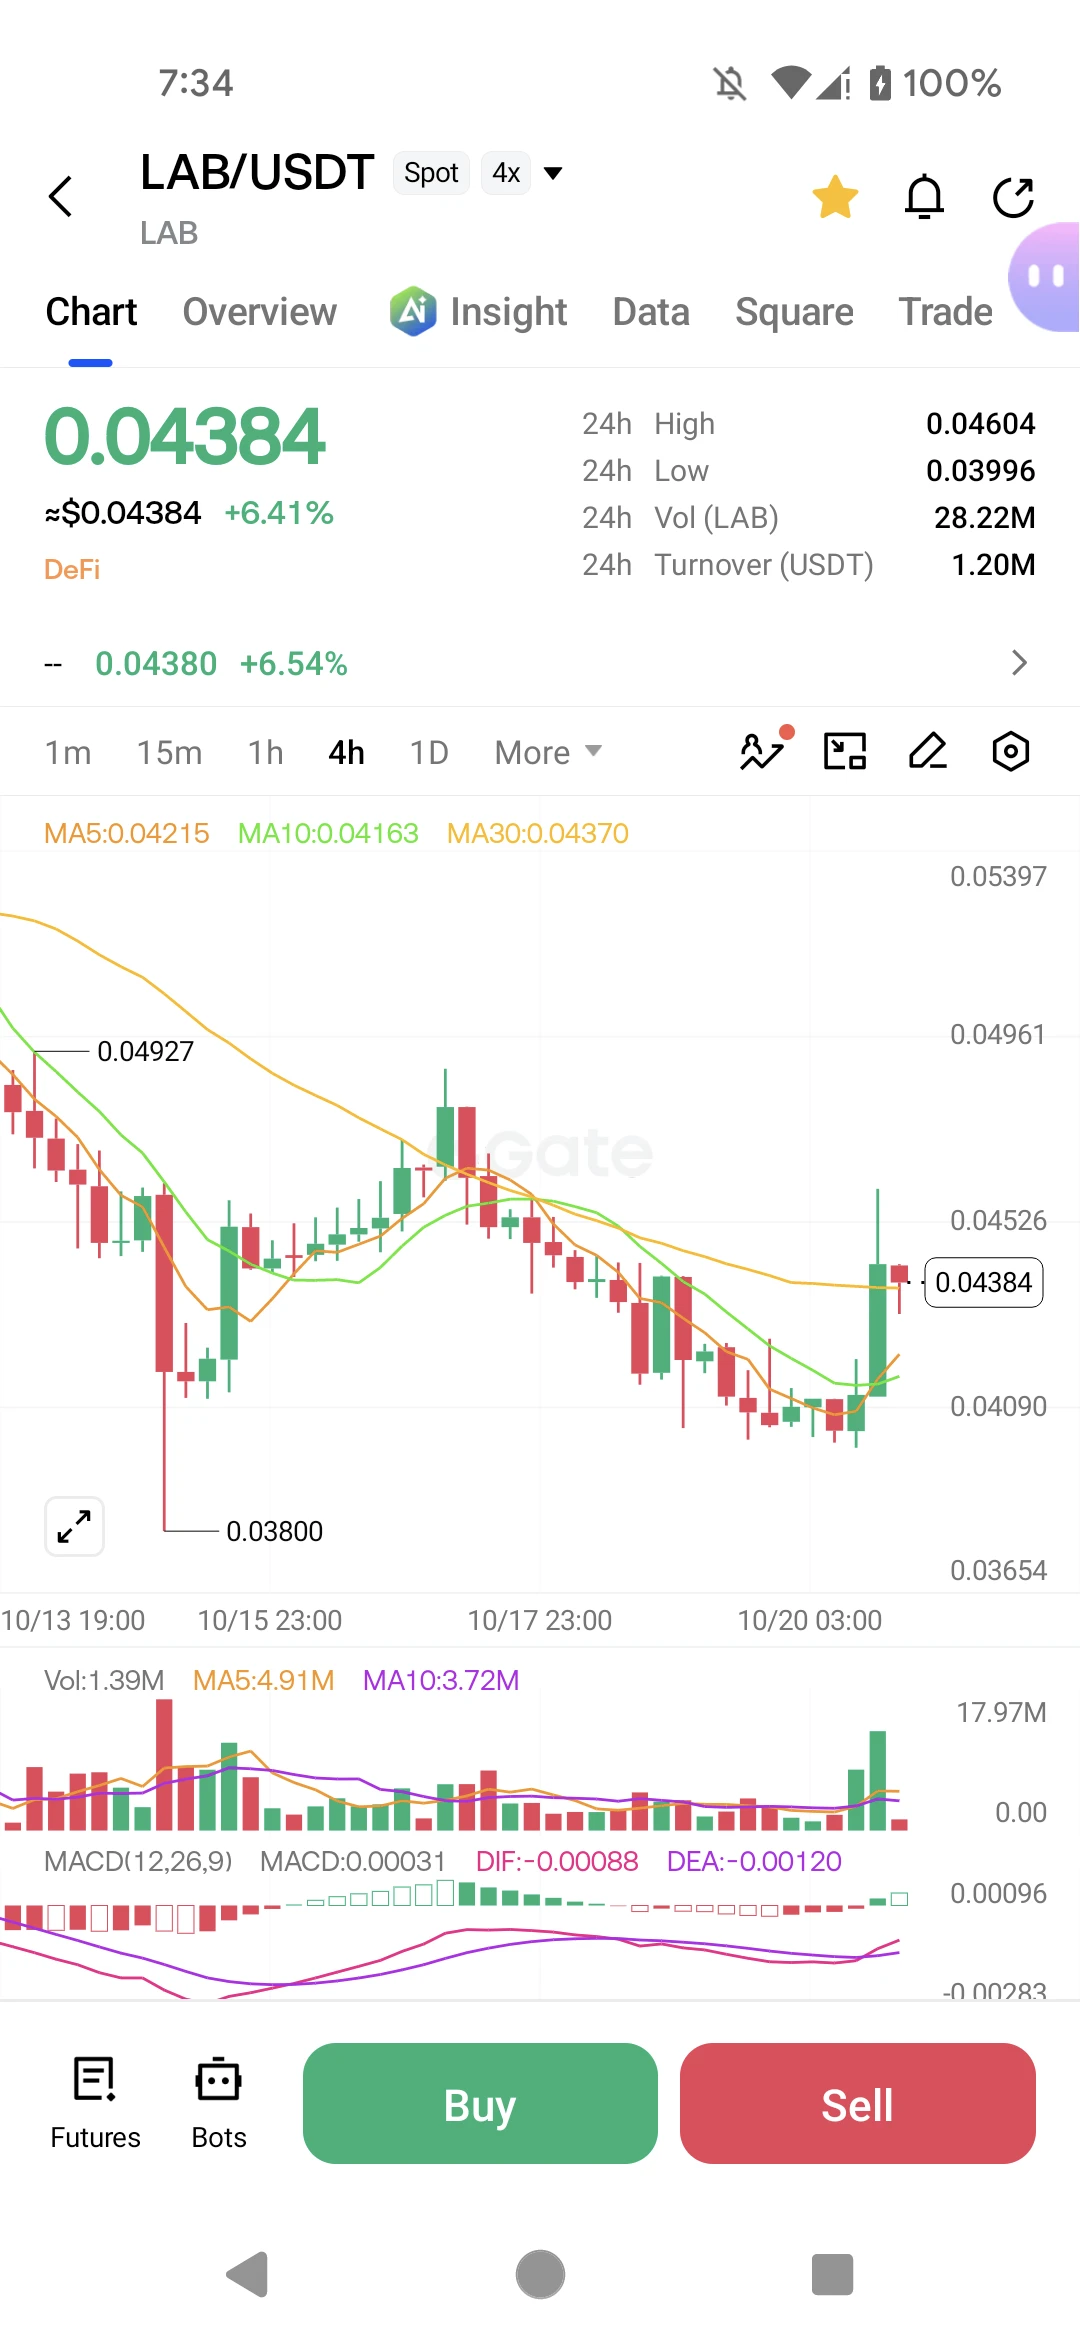
LAB-4.97%
$MARA
It gave me the impression that it may be forming an inverse H+S in this area
post-image
MARA-2.41%
This trend is so obvious I don’t even need to think—the account is dancing on its own💃 I had just opened the charts this morning and saw $APT make another surge, but that move clearly lacked momentum. Every rebound stalled at the same level, while volume kept shrinking—classic clear overhead resistance. This kind of move isn’t a breakout; it’s looking for short sellers to take the other side👍
I placed a short order before the market had fully started, entering at 0.9133. It’s now at 0.6162, with +2309.76% secured, brothers. This move wasn’t about luck—it was about spotting at a glance that i
post-image
APT+2.08%
ETH+1.15%
ZEC+21.33%
Everyone’s staring at the 4H chart, but the 15m RSI just whispered a secret about HYPE that most will ignore.

$HYPE /USDT - LONG

Trade Plan:
Entry: 87.013 – 87.451
SL: 85.127
TP1: 88.810
TP2: 89.863
TP3: 91.441

Why this setup?
- Why now? The 1D trend is bullish, yet the 15m RSI (36.85) shows a local washout—this is the classic "shakeout before markup" pattern.
- Entry zone is tight: 87.013–87.451. ATR (0.877) suggests low volatility compression, which typically precedes an expansion move.
- With TP1 at 88.810 and TP3 at 91.441, the risk/reward from 87.232 is over 4:1 if the long trig
HYPE+2.76%
$1000 to $100,000 Crypto Trade Challenge Today
live-cover
LIVE1,616
Token Crew Autumn Rewards: 500,000 USDT in Boosted Referral Rewards
https://www.gate.com/share/act/284ca13b
post-image
  • 10
$ARB /USDT Perp – "Downtrend Continuation – Short"**
**Trading Plan Short $ARB
Entry: 0.1835
SL: 0.1850
TP1: 0.1806
TP2: 0.1750
Explanation: Stuck below the EMA10 (0.1840) with a negative MACD, likely to break the 0.1806 purple support and continue lower.
post-image
ARB+10.60%
  • 2
  • 2
on the mountain top schizophrenically talking to myself about flork and how its the next multi bil genny coin of doom
post-image
$SNDK What Does SanDisk’s Inclusion in MSCI Mean?
On August 12, 2026, MSCI announced its quarterly index review results. Effective after the close on August 31, 2026, SanDisk (SNDK) was added to the MSCI All Country World Index (ACWI). Also added were 55 companies including Carpenter Technology (CRS) and ATI Inc (ATI), while another 92 were ruthlessly removed. SanDisk reversed its late-session decline and rose more than 5%, entering the MSCI global index after today’s close.
The ETF tracking MSCI World is the iShares MSCI World series, while ACWI corresponds to the iShares MSCI ACWI ETF (ACWIU
post-image
SNDK+11.88%
MSCI-0.29%
CRS+1.72%
ATI+2.91%
MU+5.89%
VODForge is a free Mac and Windows app that turns YouTube links and playlists into local MP4 or MP3 with a real queue.
Paste a URL, pick quality up to 4K, and compare source vs output side by side. No account. Open source.
post-image
Everyone is staring at ADA’s green 15-min RSI, but the 4h tape just whispered something darker.

$ADA /USDT - SHORT

Trade Plan:
Entry: 0.2212 – 0.2224
SL: 0.2274
TP1: 0.2176
TP2: 0.2148
TP3: 0.2105

Why this setup?
Why now? The daily trend is range-bound, which means mean reversion is the game. RSI(15m) at 63 is a local overheat, not a breakout signal. ATR(1h) is thin at 0.0023, so the short squeeze fuel is low. We’re sitting at 0.2218 with a clear invalidation at 0.2133. If we reject 0.2224, the path to TP1 (0.2176) and TP2 (0.2148) is a straight line down. The 55 confidence score says "p
post-image
ADA+0.77%
solana:HHig4peAgZqdAV17XuuAdojYSYLhsctjTEvT2kq9FkNA Hesitant, but I'll gamble.
post-image
SOL+2.27%
Financial News, Crypto Updates, Real-World Strategies
live-cover
LIVE1,410
Load More

Join 40 M users in our growing community

⚡️ Join 40 M users in the crypto craze discussion

💬 Engage with your favorite top creators

👍 See what interests you

View More