

Square
Following
Hot
News
Notifications
Profile
Share your thoughts
placeholder
Article
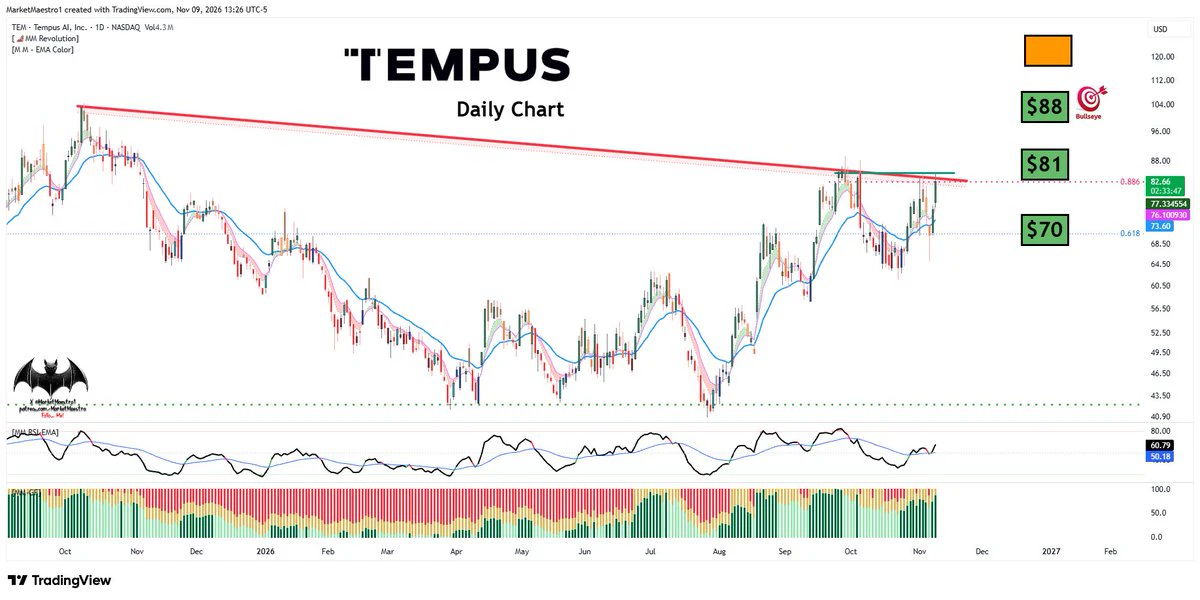
$TEM
It looks like it’s gearing up for something!
post-image
TEM+11.71%
Sanders was saying this about tariffs more than a decade ago: zero-tariff free trade would wipe out U.S. manufacturing, and he called it right-wing ideology. Turns out, that’s still just as relevant today. You can’t fill the hole left by factories moving away. Who pays the price? Ordinary people.

Which side are you positioned on—manufacturing or tech?
post-image
Trenches
牛逼
牛
bade
b
牛逼
0x96...7777
Market Cap
$.
Change
.
24h Vol
$.
Holders
.
STONK
S
bade
b
STONK
6GmA...UNgx
Market Cap
$.
Change
.
24h Vol
$.
Holders
.
BTC
B
bade
b
BTC
C5xp...pump
Market Cap
$.
Change
.
24h Vol
$.
Holders
.
PUSSY
P
bade
b
PUSSY
FZxH...Loat
Market Cap
$.
Change
.
24h Vol
$.
Holders
.
PIEVERSE
P
bade
b
PIEVERSE
0x0e...25a9
Market Cap
$.
Change
.
24h Vol
$.
Holders
Solana (SOL) Technical Outlook – Bears Push Price Toward Key Support

SOL is trading around $86.44, extending its recent decline after facing rejection near the $91–$92 resistance zone. Price is now trading below all four major EMAs, while RSI has dropped into oversold territory, highlighting strong selling pressure.

EMA Structure

- 20 EMA: $95.30

- 50 EMA: $100.31

- 100 EMA: $98.60

- 200 EMA: $97.62

- SOL is trading below all major EMAs, confirming a bearish short-term structure.

- The 20 EMA is below the 50, 100 and 200 EMAs, reflecting weakening trend momentum.

- The $95–$100 EMA cl
SOL-0.77%
You spend years trying to find an edge.
then you find one and spend the next few years trying to stop yourself from ruining it.
post-image
$INIT is showing signs of a strong rebound! After consolidating near $0.12 for a long time, buyers are entering with fresh momentum. The latest 4-hour candle is pushing toward resistance at $0.142. Add INIT to your watchlist. A confirmed breakout could kick off a new rally. Buy and trade $TRUMP
$SNDK
post-image
INIT-2.53%
TRUMP-0.95%
SNDK-0.18%
I nailed every market move today. Some people can’t even copy the playbook I wrote; I really don’t get it. Another day of feasting. Even if you don’t make a killing following me, you should at least make a little profit, right?😁
#美国10月CPI即将公布
🚀 $UNI $UNI Strong breakout — bulls are targeting higher prices...Long entry: $6.98 - $7.05Take-profit 1: $7.198Take-profit 2: $7.338Take-profit 3: $7.513Stop-loss: $6.779Leverage: 10x – 20xMargin: 1% – 3%Risk reminder: If take-profit 1 is reached, consider taking partial profits and moving the stop-loss to the entry price to protect your principal.Click below to trade on $UNI ...👇
post-image
UNI+3.05%
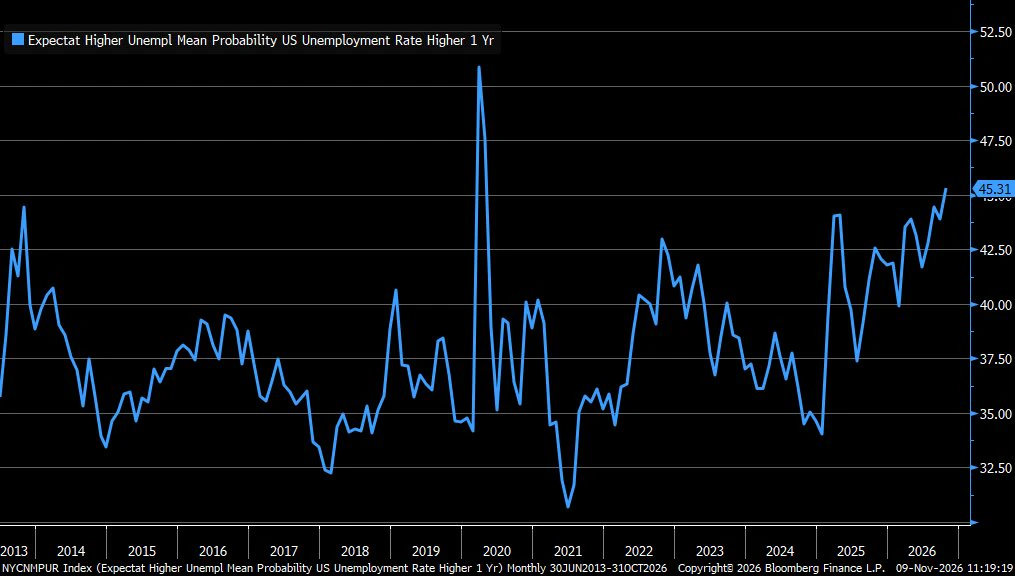
Consumer expectations for higher unemployment a year from now rose to 45.3% in October, highest since the pandemic, according to @NewYorkFed
post-image
$BTC | Long position profits realized with the trend, +4,272U pocketed in live trading

The timing on today's BTC long trade was good.
We opened long positions around 74,304 and held patiently as the price gradually recovered upward, finally closing around 75,136

Live trading data:
• Average entry price: 74,304.8
• Average closing price: 75,136.4
• Maximum position: 6 BTC
• Realized profit: +4,272.14U
• Return: +95.82%

Getting an opportunity from the market is one thing; being able to hold on to profits is another.

Trading doesn't require chasing maximum returns every time. Finding the rig
post-image
BTC-0.67%
Slowly but surely, then all at once.
There is only one $BLOB
post-image
$BTC Whale Short Raises a Bigger Question

A major whale short is bringing the previous 23% BTC drop back into focus.

$BTC fell from ~$109.5K to $84.7K in that move. If a similar decline starts from ~$75.7K, the downside could reach around $58K, near the June low.

But positioning isn’t confirmation.

$75K holds → recovery remains possible.
$75K breaks → $68K becomes the next key test.

The whale can take a position.
The market decides whether it works.

What do you think: $75K holds or $58K next?

#BTC #Bitcoin #Crypto #Gateio #CryptoAnalysis
post-image
BTC-0.67%
#pi
With the current total released supply of 11.362 billion, releasing another 500 million will only push the next steady sideways price of 0.06U lower, not higher. Once the total released supply reaches 13 billion, 0.05 is sure to break. After 0.05, when the official team grants full mapping to all compliant node builders, the domino effect will begin. When all zero-cost users receive mapping, a collective panic sell-off will gain momentum, and 0.03–0.02 will definitely be reached. Lao Si will start using the Great Star-Absorbing Technique at 0.01 to test the bottom and gain control over liq
PI-0.60%
  • 2
JUST IN: 🇺🇸 Odds of US recession next year fall after Democrats win control of the House and Senate.
post-image
A night without volatility
live-cover
LIVE39
Market Updates ABout BTC, ETH, SOL and ZEC...
live-cover
LIVE1,839
*#USIranTalksShowNewProgress — Diplomatic Breakthrough Signals Stability*

The fifth round of U.S.-Iran talks has concluded with tangible progress, marking a renewed phase of diplomatic engagement.

Both sides confirmed establishment of a new direct communication channel and adoption of a framework for confidence-building measures — critical steps toward de-escalation.

*Focus areas include:* Nuclear Program Oversight & Transparency, Sanctions Relief Discussions, and Regional Security & De-escalation.

Progress indicators are encouraging: 3 Agreements in Principle reached, 4 Joint Working Grou
post-image
$PIPPIN Build positions in batches while prices are low to reduce investment risk. The AI futures grid bot strategy splits funds into multiple portions and buys and sells at different price levels. Compared with investing all at once, it can effectively diversify risk and is especially suitable for volatile emerging assets such as cryptocurrencies. Friendly reminder: adjust margin appropriately#BTC闪崩插针 #美股AI板块遭遇重挫
PIPPIN-2.30%
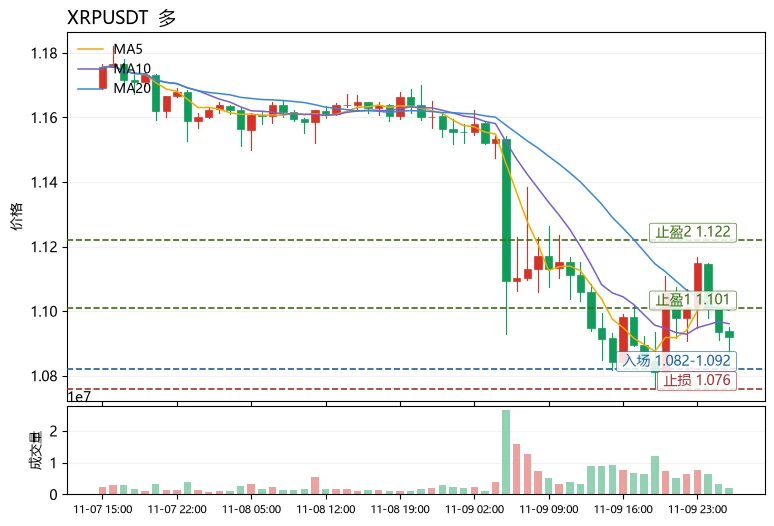
Many people use “it has fallen so much, it must rebound” as a reason to enter. This is a classic bottom-fishing fallacy—cheap prices do not mean the trend is strengthening; first check whether the moving-average structure is still healthy. Take $XRP as an example: the current price is 1.0919, and MA5 is only slightly above MA20 (1.10044 vs. 1.10028). The two lines are almost converging, indicating the medium-term trend is flattening rather than clearly rising; RSI at 39.9 is weak but not oversold, while the MACD histogram at +0.002212 remains bullish, suggesting an early momentum recovery aft
post-image
TQQQB
TQQQBTQQQB
Four.meme
MC:$3.36KHolders:2
0%
XRP-1.15%
Would you let an AI agent sign a transaction for you, anon? My cat's robot intern is already doing the paperwork. Probably nothing.
post-image
Load More

Join 40 M users in our growing community

⚡️ Join 40 M users in the crypto craze discussion

💬 Engage with your favorite top creators

👍 See what interests you

Trending Topics

USCPIDataIncoming

43.08k Views2.03k Discussing

The U.S. October CPI report will be released on November 10 at 8:30 a.m. ET. September CPI came in at 3.7% year over year, and markets will be watching closely for signs that inflation is cooling, especially in core CPI. A softer-than-expected reading could strengthen rate-cut expectations, while hotter inflation may pressure risk assets through higher Treasury yields and a stronger dollar. How do you think this CPI print will move $BTC, U.S. stocks and gold?

RedBullDoublePodiumInBrazil

9.24k Views30.59k Discussing

BTCFlashCrash

201.03k Views66.58k Discussing

View More