Share your thoughts
placeholder
Article
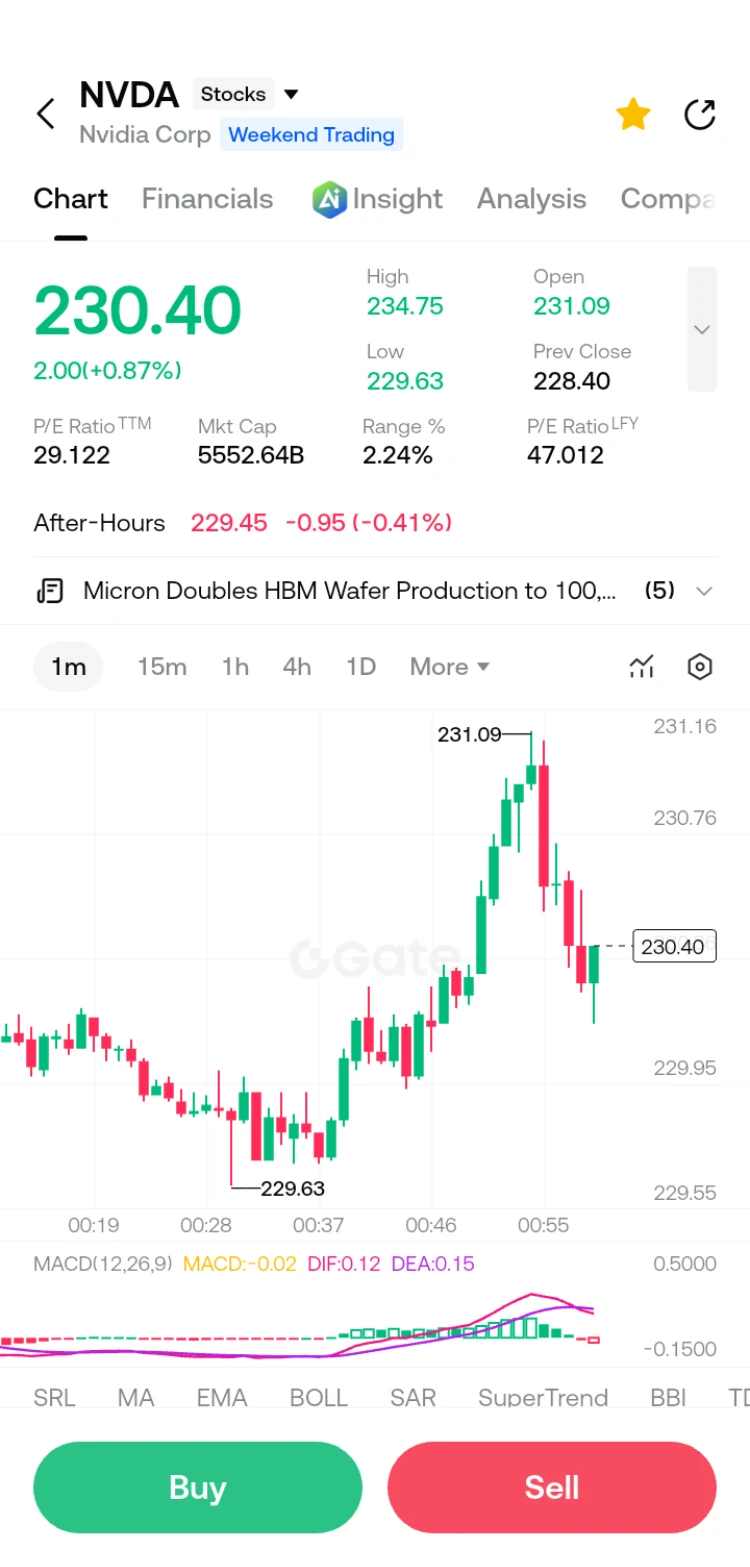
$NVDA — I’m Watching This Breakout 👀🔥
NVIDIA is holding up well after the recent move, but there’s one level I really want to see buyers take back:
$230.
That’s the door.
If NVDA breaks above $230 with good volume and holds the breakout, I’d be looking for:
🎯 TP1: $236
🎯 TP2: $242
🎯 TP3: $250
My trade plan:
🟢 Entry: $221 – $225
🛑 SL: $214.50
I don’t want to chase a huge green candle. Give me either a clean entry around the current zone or a confirmed $230 breakout.
The level I don’t want to see lost is $215. If that breaks decisively, I’m out — no arguing with the chart.
For me, it’s s
post-image
NVDA-0.21%
  • 2
  • 2
Returning once again to the crypto world's major platform to witness the eighth wonder of the crypto world!
An 11-year crypto trading veteran! #美国8月非农超预期 #美国8月非农超预期 #BTC收复8万美元 #BTC #ETH
post-image
BTC-1.43%
ETH-1.96%
JUST IN: A mystery whale bought 343,000 HYPE, taking holdings to ~3.24 million and fully staked. If sustained, this could signal strong confidence in HYPE’s long-term use-case and staking demand. $HYPE
post-image
HYPE-3.71%
JUST IN: Anthropic near IPO with Morgan Stanley as left lead underwriter and Goldman Sachs as stabilization agent; NY listing expected end of Sep/early Oct. This could impact AI sector funding dynamics and sentiment around big tech listings. $AI
post-image
MS+0.25%
GS-0.03%
They say privacy coins quietly make big money — this time ZEC quietly hit a “10-year high.”
Yesterday it was still the invisible man of crypto; today the entire market is shouting its name. Low-key? Not a chance— even $1,000 couldn’t hold it back.

On the surface: ZEC broke above $1,000, hitting a nearly 10-year high, with privacy coins rallying across the board.
In reality: Gate spot $1,016.73 (24H +7.57%), perpetuals $1,015.81—the surge is real, but this was an “event-driven + short squeeze” frenzy, not a healthy bull market that climbed gradually.
Within a single day, the high was $1,050 a
post-image
ZEC+8.63%
TSLA-5.96%
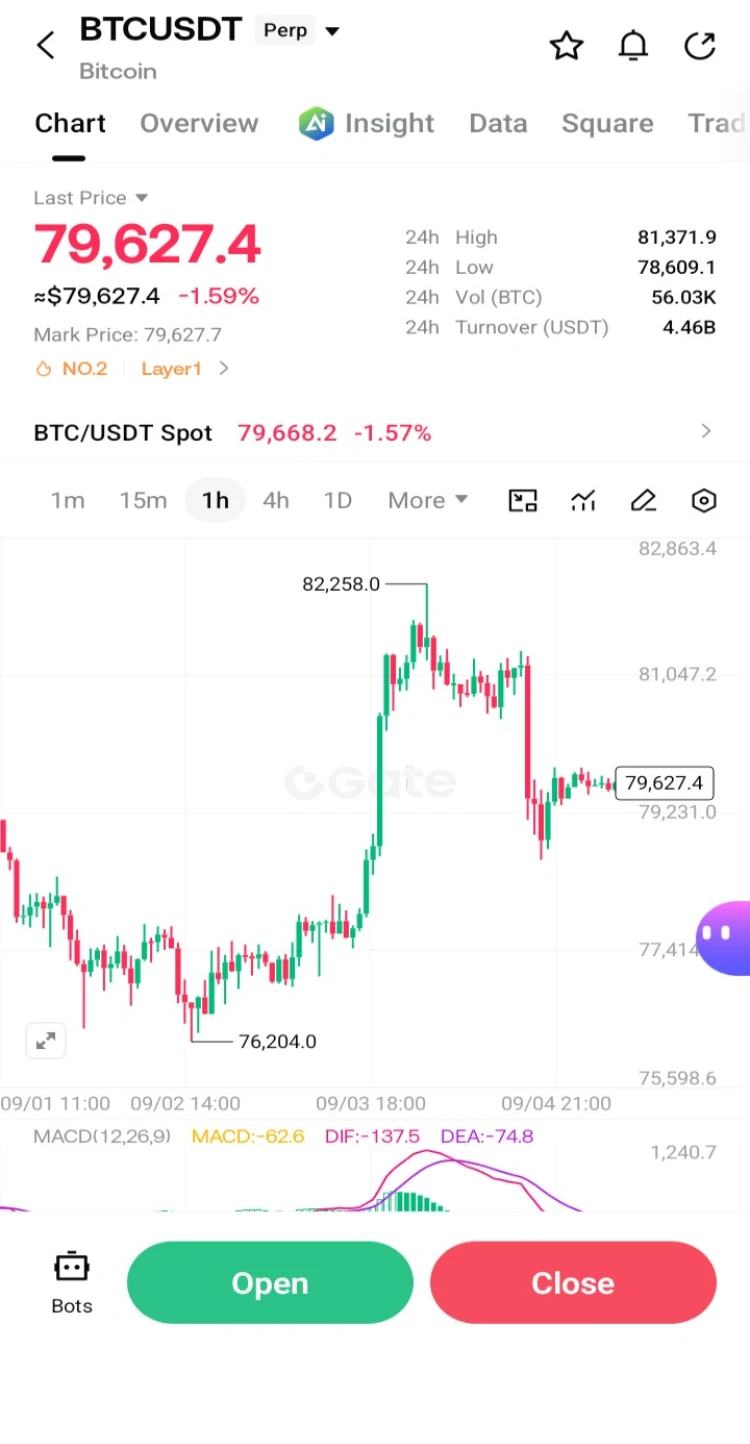
$BTC The Next Move Could Be Big
Bitcoin just made a serious push toward $82K+, but now comes the part I’m watching closely.
I don’t want to chase the pump.
I want to see what BTC does around $80K–$82K.
📍 Entry: $79,800 – $81,000
🛑 SL: $77,400
🎯 TP1: $83,000
🎯 TP2: $86,000
🎯 TP3: $90,000
Here’s my thinking:
If BTC holds the $80K area and breaks back above $82K with volume, buyers could make another run toward $86K → $90K.
But if $77.4K breaks, I’m not forcing the long. That would tell me the breakout is losing strength.
For me, it’s simple:
🔥 $82K reclaim + volume = bullish
⚠️ $77.4K b
post-image
BTC-1.42%
  • 4
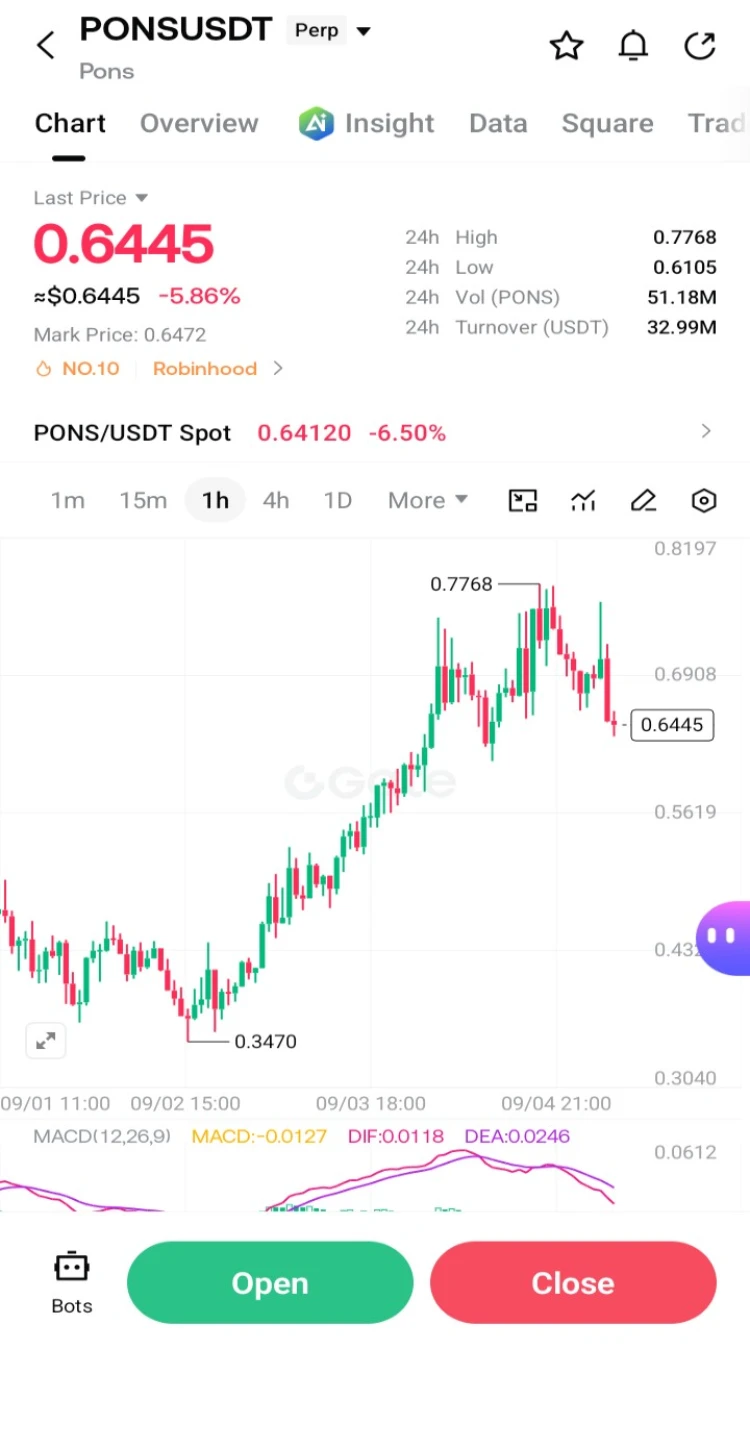
$PONS — This Move Is Getting Crazy 👀🔥
PONS just printed a fresh ATH around $0.77 and volume has exploded.
But after a move like this, I’m NOT chasing the top.
I want to see how buyers react around the breakout zone.
🟢 Entry: $0.68 – $0.72
🛑 SL: $0.62
🎯 TP1: $0.78
🎯 TP2: $0.85
🎯 TP3: $0.95
The main level for me is $0.77.
If PONS breaks $0.77 again and holds it with strong volume, another expansion could come quickly.
But if the breakout fails and price loses $0.68, I’d rather stay out than chase a falling candle.
This is moving FAST, so don’t let FOMO choose your entry.
$0.77 reclaim =
post-image
PONS-3.30%
  • 4
  • 1
9.5, BTC, morning view

Good morning, have a great weekend!

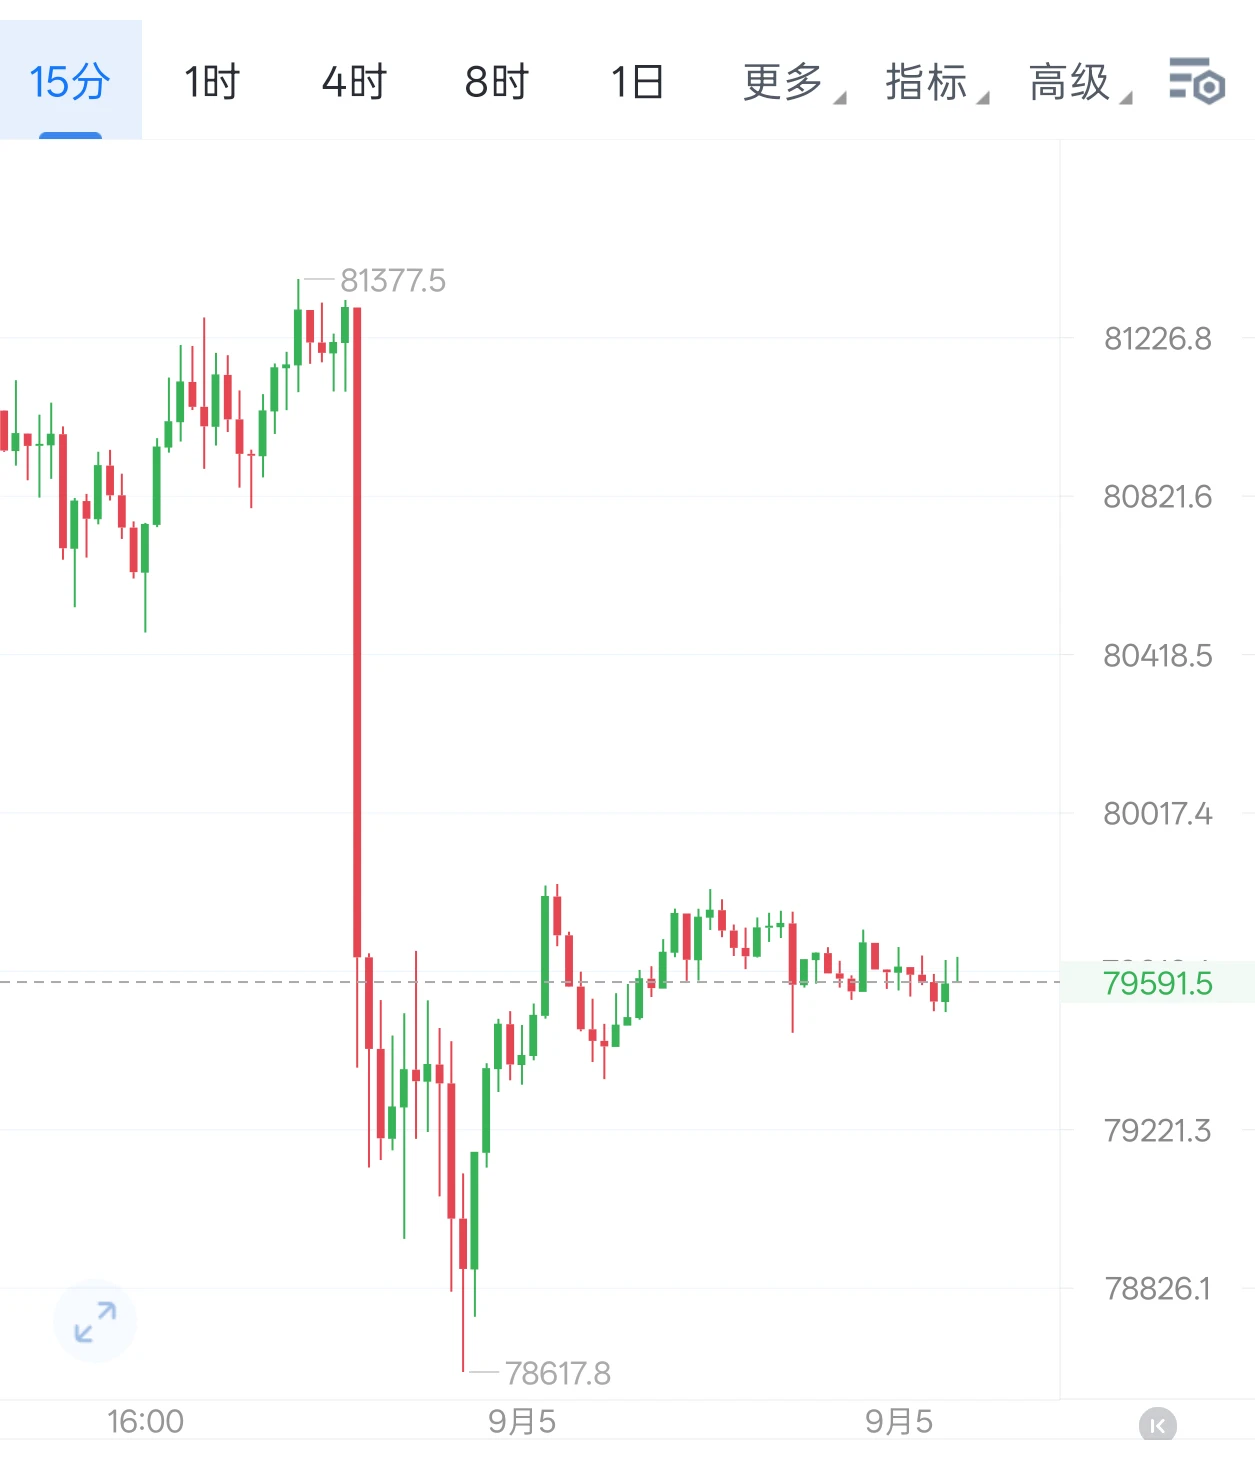
Friday’s nonfarm payrolls data came as a major surprise, with employment data far exceeding expectations. BTC was sold off sharply from the high of 81,350, dipping as low as 78,600. After the data was released, it did not continue moving unilaterally downward, instead staging a short-term consolidation recovery. It is currently grinding around 79,590.

This previous rally was driven by sentiment and a short squeeze. Once the bearish nonfarm payrolls data came out, most of the earlier gains were immediately retraced. The broader en
post-image
BTC-1.43%
perps trading is difficult for 95% of those who lose money
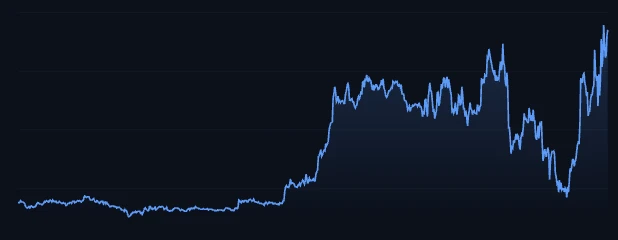
this is one of my equity curves on a small perps account. the big dip is on the pullback we recently had but the issue here is I sized up too hard on perps and got chopped up due to mental games.
fear of loss etc
so when im doing perps in this market, fortunately the majority are low leverage and from a lot lower which means liquidation risk is very very low
this is the biggest thing most traders get wrong with perps (being too close to liquidation levels)
overtrading + overleveraging is not it
note to self
post-image
Everyone’s long silver, but the 4H clock just ticked against $XAG /USDT—here’s the ugly side of 66.3.

$XAG /USDT - SHORT

Trade Plan:
Entry: 66.2 – 66.4
SL: 67.1
TP1: 65.7
TP2: 65.3
TP3: 64.6

Why this setup?
Why fade the bounce?
- 1D is stuck in a range, so rallies die fast.
- RSI 15m at 53.9 = zero momentum, just a dead-cat wiggle.
- ATR 1h (0.35) says volatility is low—breakouts fake out.
- Entry 66.3 with TP1 65.7 is a clean 0.9% grab before resistance at 66.9 slaps you.

Debate:
Are you trusting the range top at 66.9, or is this the one time silver breaks your short’s heart?
XAG-0.87%
BREAKING: Jobs data refreshes bets on a Fed rate hike, but risk assets haven’t panicked yet. Treasuries sold off, dollar stronger, S&P dip but weekly gain intact. $SPX $USD #Fedwatch
post-image
SPX-0.50%
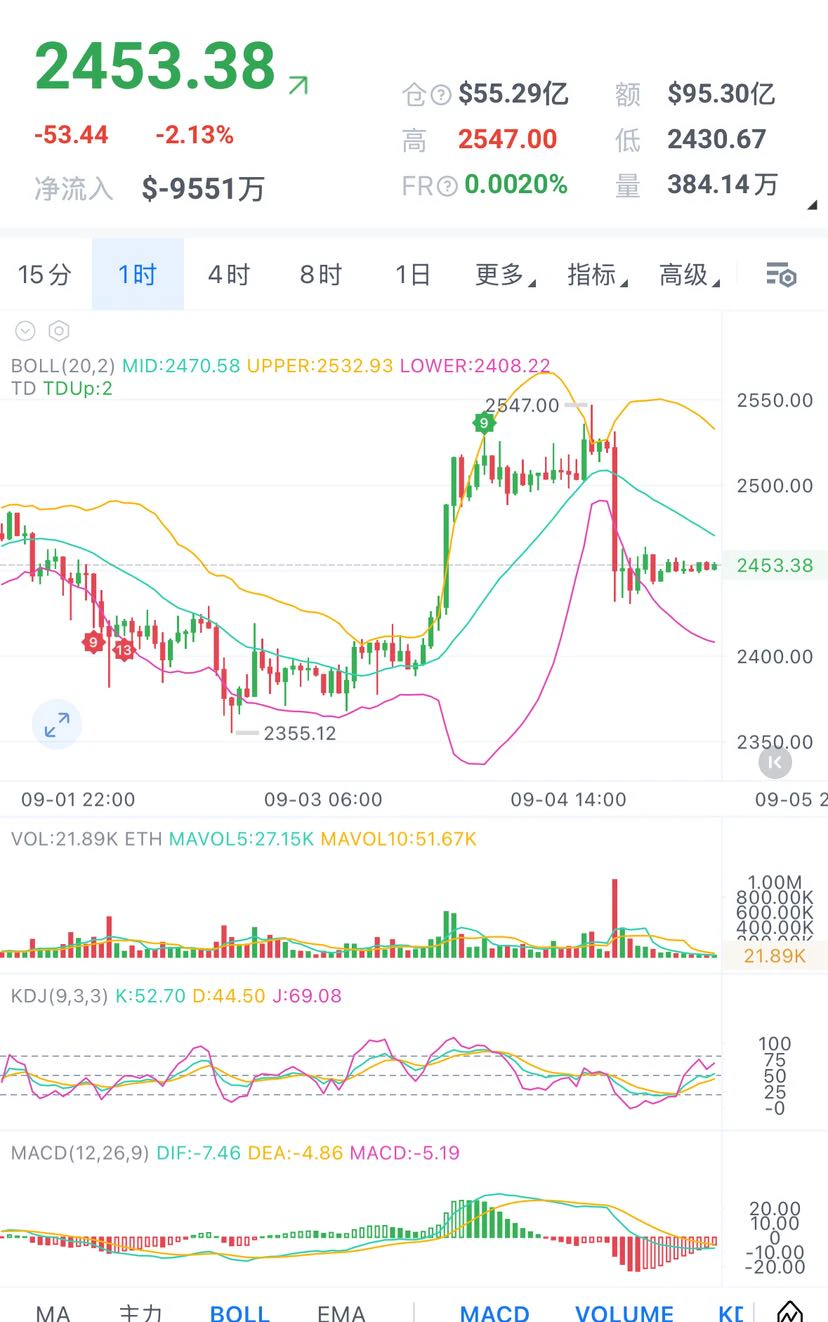
ETH is currently entering a high-level pullback phase, with signals across multiple timeframes gradually coming under pressure. Rebounds on smaller timeframes are mostly corrective moves during the decline, rather than a trend reversal. On the 4-hour timeframe, this adjustment cycle has only reached its midpoint, leaving room for a bottom-reversal signal to emerge. The price is fluctuating near the 4-hour short-term support at 2444, which is currently the key lifeline for the medium-term trend. No strong buying support is visible at present; once this support fails, the pullback could expand f
post-image
ETH-1.96%
$CATI 24 hours surged 22% to 0.0652, with trading volume hitting $11 million, but a late-night wick down to 0.053 quickly recovered. Is this really the market maker’s final dance before dumping, or the first bullish candle of a new narrative taking off? I’ve been watching the chart for three days, and the bulls and bears are so divided they could start fighting.
The bullish case: First, volume broke out from the weekly bottom, and after repeatedly testing the 0.063 resistance level, price held above it—a textbook technical setup. Second, on-chain activity in the CATI ecosystem has surged recen
CATI+17.84%
BTC-1.43%
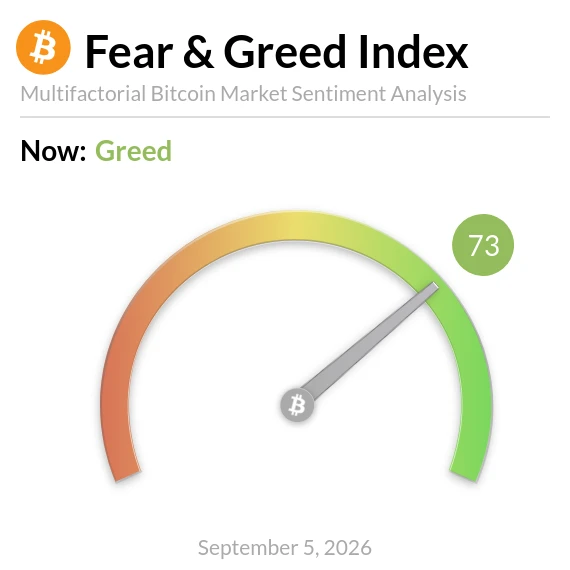
Bitcoin Fear and Greed Index is 73. Greed
$BTC Current price: $79,590
post-image
BTC-1.43%
#晒出我的持仓收益 The pullback is here—open a long and keep making money$PONS
post-image
PONS-3.30%
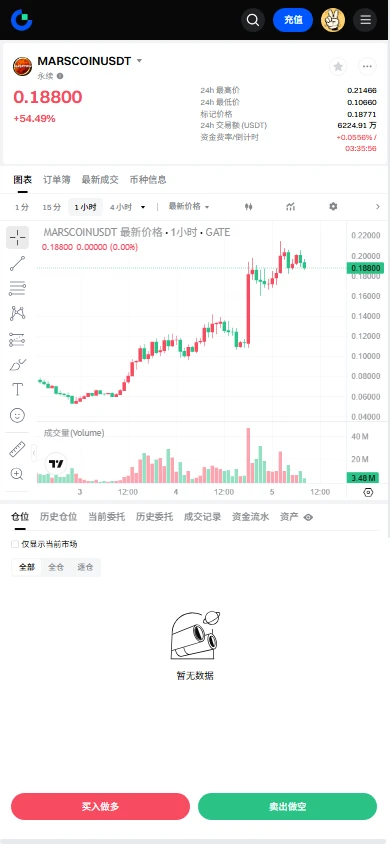
$MARSCOIN Signal】Long Setup: Strong Order Book Support + Pullback Orders
$MARSCOIN Buy-side order book depth imbalance 33.2%, Bid/Ask ratio 1.99, with substantial bids below. The 1H MACD has formed a death cross, with the histogram at -0.0002; bearish momentum is visibly weak. The 4H Bollinger upper band is at 0.2125, while the price is still trading above the middle band. OI is stable, and the funding rate is 0.0498%, so the cost of holding long positions is not extreme.
🎯 Direction: Long
⚡ Entry/Limit Order: 0.1900182 - 0.1905900
🛑 Stop Loss: 0.1886841
🚀 Target 1: 0.1934489
🚀 Target 2
post-image
MARSCOIN+44.25%
BTC-1.43%
ETH-1.96%
SOL-1.53%
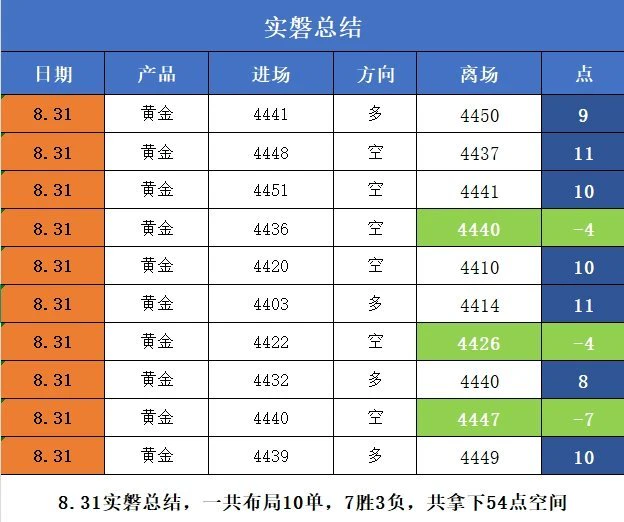
$XAUT Monday Shi Pan Summary
10 trades were placed intraday, with 7 wins and 3 losses, yielding 54 points of room

The market fluctuates constantly, but not every move needs to be traded.
Learning to filter opportunities, knowing when to make trade-offs, and maintaining discipline are the keys to standing firm in the market for the long term! ​​​
post-image
XAUT-0.85%
USDE available liquidity on Aave Ethereum grew 43.9% in seven days.
$231.5M to $333.1M.
@ethena
USDE+0.02%
AAVE-2.03%
ETH-1.96%
ENA-2.30%
  • 3
Load More

Join 40 M users in our growing community

⚡️ Join 40 M users in the crypto craze discussion

💬 Engage with your favorite top creators

👍 See what interests you

View More