Share your thoughts
placeholder
Article
$SPCX still stuck under that 150 resistance I flagged yesterday. Looked like it might confirm the breakout but faded into close and can't punch through today either.
If it pulls back, I'm watching 125 as a buy zone. Not interested in shorting here — no clean setup on the short side right now.
Waiting for either the breakout confirmation above 150 or the dip to 125. No trade in the middle.
#GateEventContractTradeSharingChallenge
post-image
SPCX-1.19%
  • 2
  • 1
#HYPEBreaks88HitsNewAllTimeHigh
HYPE briefly cleared 88 earlier and printed a new all-time high before settling back in the mid-86 range. The token remains up more than 57 percent over the past thirty days. The protocol’s buyback-and-burn mechanism continues to remove supply, daily active traders have climbed to around 42,000, and open interest sits near 2.3 billion dollars. The combination of deflationary pressure and rising participation is still the structural backdrop.
Current price action shows the market consolidating after the ATH tag. The move higher was driven by the same factors tha
HYPE+2.72%
  • 1
Everyone’s staring at MARSCOIN’s bounce—but the 4h clock just started ticking against them.

$MARSCOIN /USDT - SHORT

Trade Plan:
Entry: N/A – N/A
SL: N/A
TP1: N/A
TP2: N/A
TP3: N/A

Why this setup?
- 1D trend is *range*, meaning no rescue rally is coming—just chop that bleeds longs.
- RSI on 15m is already at 36, yet bias stays SHORT (55% conf): weakness is reloading, not reversing.
- Entry at 0.22511 is the line in the sand; if this fails, the next bid is a memory.
- Why now? The "Armed" status means the trigger is live—waiting for confirmation is waiting for a worse price.

Debate
MARSCOIN+21.62%
U.S. Nonfarm Payrolls Surge 162,000 in August, Nearly Triple Forecast, Boosting September Rate Hike Odds to 58.6%
Data released by the U.S. Bureau of Labor Statistics showed that U.S. nonfarm payrolls added 162,000 jobs in August, nearly three times the market consensus forecast of 56,000. Revisions to June and July data added a combined 55,000 jobs, while the unemployment rate held steady at 4.1%. In response to this robust data, the CME FedWatch tool raised the market-implied probability of a September Federal Reserve rate hike from 49.4% to 58.6%, with some data sources indicating odds brie
post-image
CME-0.25%
  • 4
  • 2
Robinhood Executives Divest $4.16 Million in Stock on September 3
Robinhood Markets Inc. (HOOD) witnessed significant insider selling on September 3, 2026, as two top executives collectively divested shares worth approximately $4.16 million, according to filings with the U.S. Securities and Exchange Commission. Chief Brokerage Officer Steven M. Quirk sold 24,416 shares at an average price of $120.33 per share, totaling approximately $2.94 million, reducing his direct holdings to 77,839 shares. On the same day, Chief Legal Officer Daniel Martin Gallagher Jr. sold 10,000 shares at an average pri
post-image
HOOD-2.12%
  • 2
This position actually felt rather uncomfortable when I entered, with $FF still hovering around 0.10489 and a strongly bearish sentiment across the market. I went long not purely out of contrarian thinking, but mainly because I’m accustomed to watching whether key levels hold or break—since the previous key level was not decisively broken, the probability of a shakeout was somewhat higher than that of a reversal from a short-term positioning perspective. From entry until now, although the price action has been somewhat choppy, the overall direction has remained largely intact. After the price
post-image
FF+10.60%
SOL+3.34%
ZEC+16.16%
🔥Sunday daytime free strategy levels👇
🔥Long entry levels (see the pinned subscription post for the second entry level + short entry level + take-profit levels; long- and short-term spot setups are also in the pinned post)
===========
79250 long, 78950 long, stop-loss 77550
2455 long, 2435 long, stop-loss 2390
#美国8月非农超预期
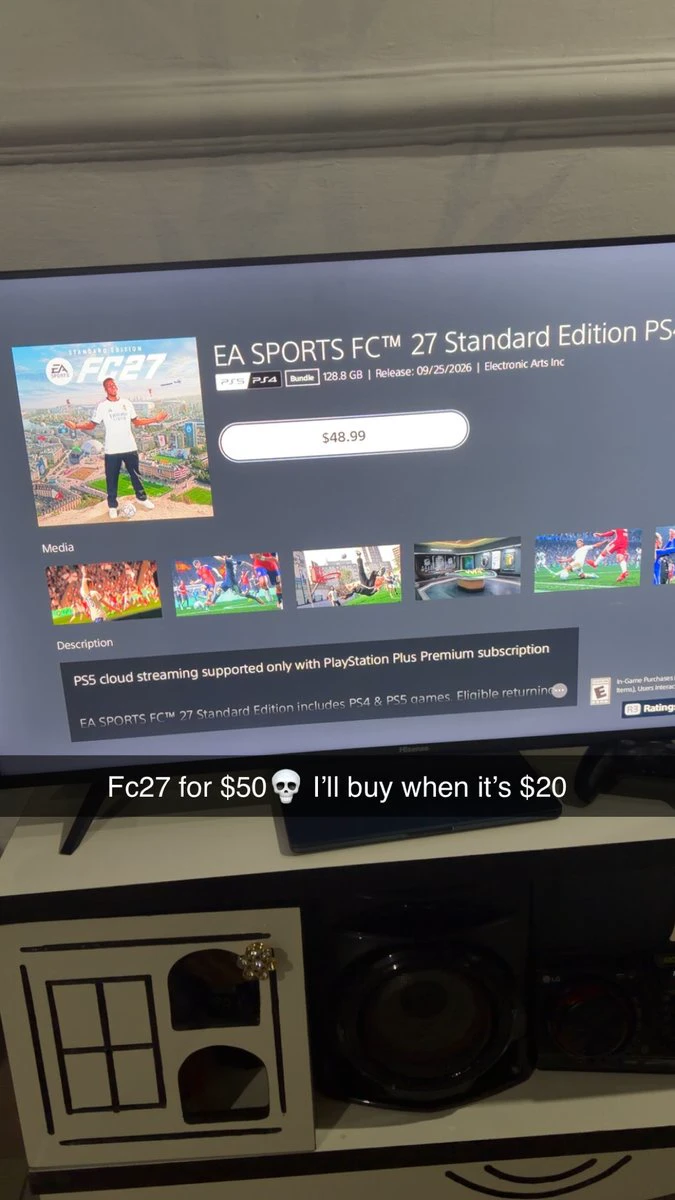
Ukraine's security service raided a warehouse in Vinnytsia expecting a crypto mining farm.
- Found PS4 consoles stacked floor to ceiling instead
- 3,800 of them
- Every single one running FIFA 21 on autopilot
- Farming Ultimate Team coins 24 hours a day to sell on the black market
The damage:
- $259,000 in electricity stolen every month
- Power blackouts across the entire city
- The consoles alone are worth $1.5 million
The numbers behind why anyone would do this:
- EA makes $1.6 billion a year from Ultimate Team alone
- The FIFA coin black market is worth over $200 million a year
- 3,800 cons
EA-0.03%
9.6 Ether
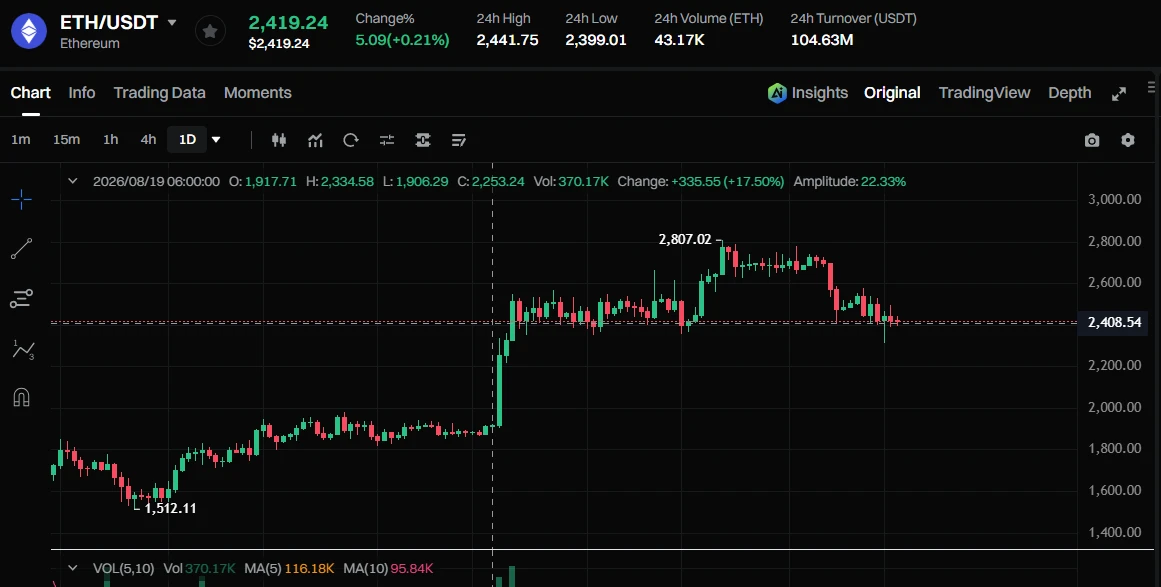
After a sharp rally on the left to a high near 2550, a long bearish candle immediately appeared, followed by a steep plunge—a typical liquidity hunt combined with long liquidation, directly smashing the price back to around 2450. The price then entered an extended period of sideways consolidation within the 2440–2460 range, forming a slow upward climb with higher lows. It recently broke out of the consolidation range and is now approaching the previous minor high near 2510–2520. The 2547 high ahead was a clear failed breakout, confirmed by a long upper wick followed by a plunge. Week
post-image
ETH+2.20%
BTC retums to $78,000! The market rebounds after finding suppor
live-cover
LIVE1,671
$BTC ‌– Bitcoin Holds Above $80K as ETF Inflows Surge, Macro Test Looms
Current Market Data:
· Last Price: ~$80,000
· 24h Change: +0.5–0.6%
· 24h High: $80,200
· 24h Low: $79,482
· 24h Vol (BTC): ~2.11K
· 24h Vol (USDT): ~168.59M
---
The Macro Picture:
Bitcoin is trading near the psychologically significant $80,000 level on September 6, having reclaimed the mark after a volatile week that saw prices swing from lows near $76,200 to highs above $82,200. The recovery is not clean — BTC has been moving in a "two steps forward, one step back" rhythm, with institutional buying providing a floor whi
post-image
BTC+0.15%
  • 5
  • 2
Tong Ge’s 9.6 BTC strategy
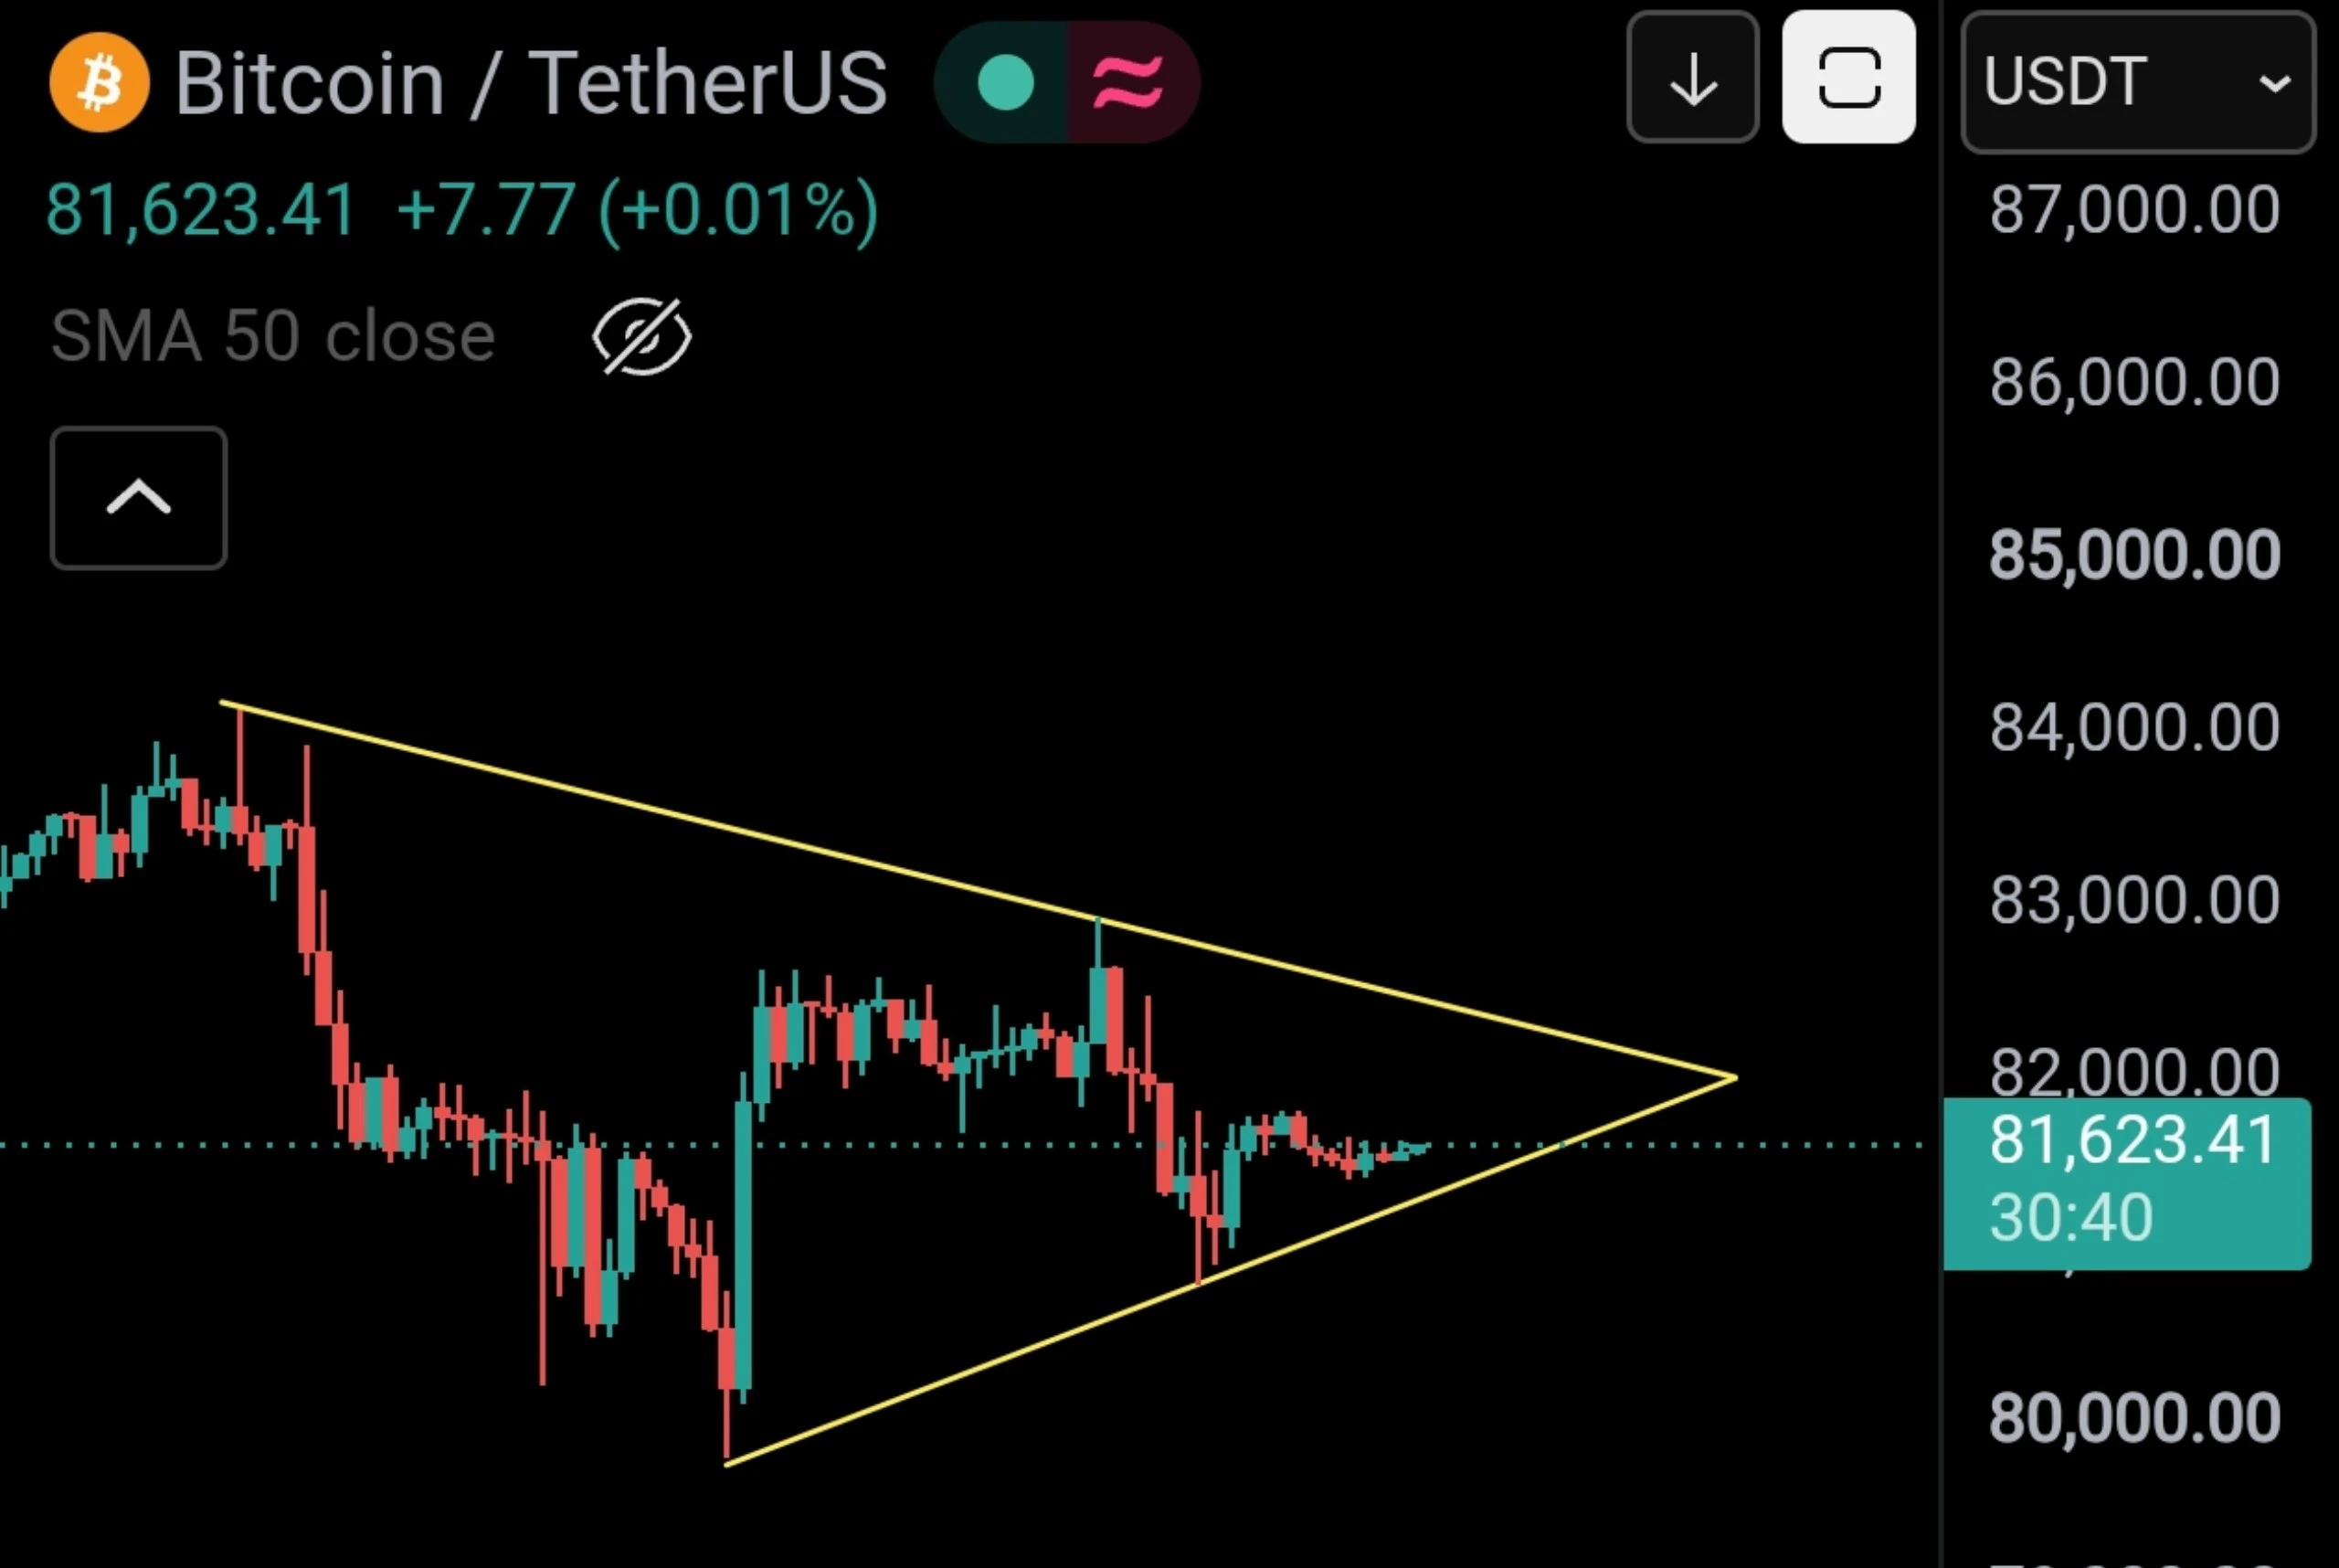
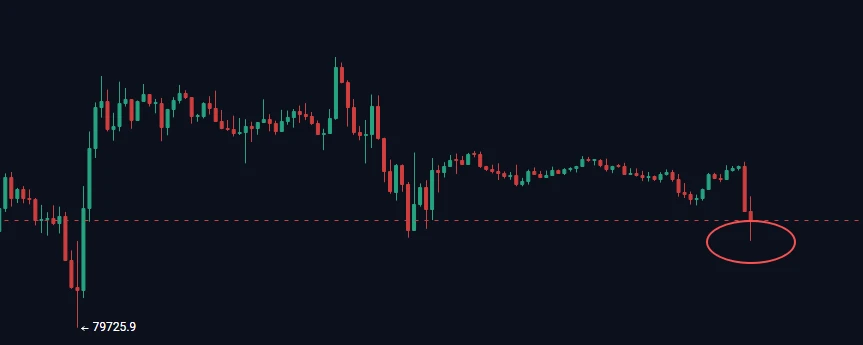
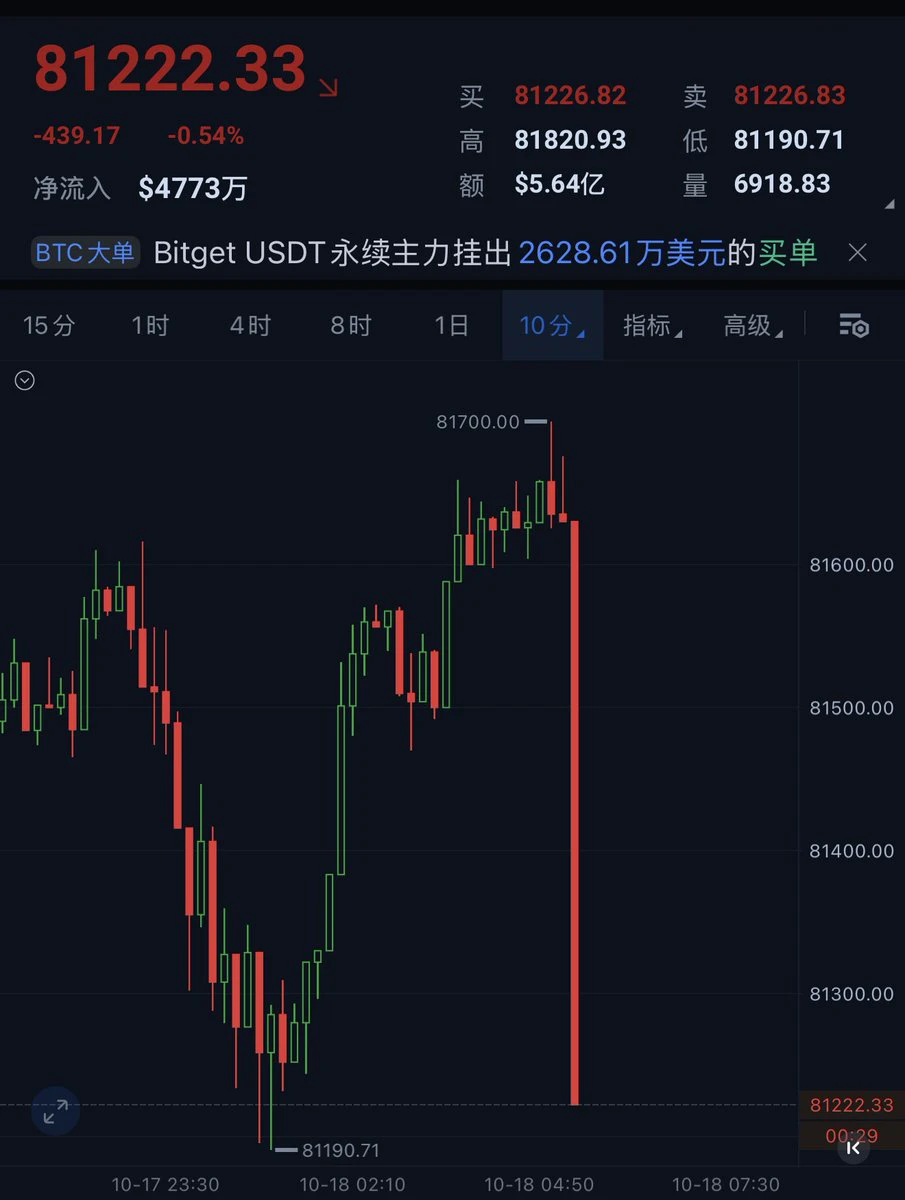
Enter a short around $BTC 805-810, with a stop-loss at 815, first target 790, second target 785.
Current price: 79737. The market tentatively touched 80167 but failed to hold above it and quickly pulled back. There is selling pressure above 800, so this move cannot yet be considered a breakout.
Moreover, it is the weekend today, and liquidity is already thin, so even a slight price move can easily trigger back-and-forth wicks.
There is no need to force trades in this market. Short if it moves up to the entry level; do not chase if it moves down.
If 815 holds, withdra
post-image
BTC+0.15%
#Gate用户突破6000万
I still remember the exact day I clicked “Register” on Gate. It was a cold January morning in 2025. Crypto Twitter was busy arguing about the next big narrative, my portfolio was looking a bit sad after the previous cycle 🥹, and I was just looking for a platform that didn’t feel like it was trying to sell me dreams every five minutes. Gate felt… calm. Professional. A little understated. So I joined.
Fast forward 20 months and here we are: Gate has officially crossed **60 million users worldwide**. Sixty. Million. 🤯
When I joined in January 2025, the platform was already soli
post-image
BTC+0.14%
ETH+2.17%
MEME-0.30%
Most traders will ignore LINK at 12.249—that’s exactly why you shouldn’t.

LINK/USDT - LONG

Trade Plan:
Entry: 12.219 – 12.279
SL: 11.956
TP1: 12.468
TP2: 12.615
TP3: 12.834

Why this setup?
Why now? The 4h chart is “Armed” with a 95% long confidence, while the 1D trend stays bullish—this isn’t a coin flip.
- RSI (15m) at 56.42 shows room to run before overbought.
- ATR (1h) of 0.1218 means tight stops, but TP1 at 12.468 is only 1.8% away—low hanging fruit.
- Invalid only below 11.460, so your risk is defined. The setup is compressed, and compression precedes expansion.

Debate:
Are
post-image
🚨BREAKING: #XAUUSD READY FOR THE NEXT LEG DOWN, ARE YOU?
  • 5
$1000 to $100,000 Crypto Trade Challenge Today
live-cover
LIVE1,415
Everyone’s watching Bitcoin—but DASH just flashed a 77% short signal nobody’s talking about.

$DASH /USDT - SHORT

Trade Plan:
Entry: 73.41 – 74.97
SL: 83.92
TP1: 66.89
TP2: 62.03
TP3: 54.73

Why this setup?
Why now? The 4h chart shows a textbook rejection zone:
- Price pinned at 74.19 with a hard ceiling at 74.97—that’s the line in the sand.
- RSI on the 15m is cooling at 59.74, losing upside momentum right as we tap resistance.
- ATR (1h) at 3.11 means volatility is ripe for a squeeze—but direction leans down.
- Target map: TP1 at 66.89 (-10%), TP2 at 62.03 (-16%). This isn’t a di
DASH+4.39%
#HYPEBreaks88HitsNewAllTimeHigh
$HYPE
$HYPE is currently trading around **$86.56** after briefly breaking above the $88 level and printing a fresh all-time high.
Key Price Levels
- **New All-Time High**: **$88.06 – $88.15** (reached on September 3–4, 2026)
- Previous major high: ~$83.50 (late August 2026)
- Current price: **$86.56** (slight pullback from the peak)
- Distance from ATH: Approximately -1.7% to -1.8%**
Technical Snapshot
- Structure: Strong higher-highs sequence remains intact. The break above the prior $83.50 resistance confirmed continuation of the broader uptrend that began
post-image
Falcon_Official
#HYPEBreaks88HitsNewAllTimeHigh
$HYPE
THE BREAKOUT HAS COOLED BUT THE STORY IS NOT OVER
HYPE is currently trading around $83.98, after recently pushing through the $88 area and printing a fresh all-time high. The move has now entered a more interesting phase: instead of chasing the breakout candle, the market is testing whether HYPE can build a strong base after the record move. From the recent data, HYPE remains one of the strongest-performing large crypto assets, with 24-hour trading activity still around the $1.6B+ area, showing that participation remains substantial.
FROM BREAKOUT TO RETEST
The move above $88 was important because HYPE entered price-discovery territory. Once the previous high was broken, historical resistance above that level disappeared. But price discovery does not mean straight-line growth. HYPE has now pulled back toward $83.98, making the $88 region an important reference point. If buyers can eventually reclaim $88 and turn it into support, the market could start focusing on the next psychological levels rather than treating $88 as resistance.
THE TECHNICAL MAP
At $83.98, HYPE is sitting below its recent record, so I would focus on confirmation rather than simply chasing momentum. The first important support area is around $83.5–$84, almost exactly where the current price is trading. Holding this region would keep the immediate bullish structure alive. Below that, $80–$81 becomes the major breakout/retest zone. A deeper correction could bring $75–$76 into focus, but losing that region would represent a much larger deterioration in the short-term structure.
RESISTANCE IS CLEAR
On the upside, $88–$88.5 remains the first major resistance because this is where the recent record was established. Above that, $90 becomes the next psychological level, followed by $95 and the major $100 milestone. A clean break above $90 with strong volume would make the $95–$100 zone much more interesting. The important condition is that HYPE must demonstrate acceptance above resistance rather than simply creating another short-lived wick.
WHY HYPE STILL HAS ATTENTION
The strength behind HYPE is not based only on chart momentum. Hyperliquid has become a major on-chain derivatives venue, and the ecosystem's trading activity remains a central part of the HYPE narrative. The token also has a structural connection with protocol economics through fee-funded buybacks, giving traders another reason to monitor ecosystem activity alongside the chart. Recent market data continues to show substantial HYPE trading volume and a market capitalization around the high-$18B/low-$19B range.
BUT THERE IS A SUPPLY WARNING
The bullish structure comes with an important risk that traders should not ignore. HYPE has recurring token unlocks, and another significant unlock is scheduled for September 29, involving roughly 14.2M HYPE according to current unlock tracking. That represents approximately 1.4% of total supply and around 2.7% of market capitalization at the cited valuation. This does not automatically mean HYPE must fall, but additional supply can increase volatility and profit-taking pressure if demand weakens.
MY BULLISH SCENARIO
My preferred bullish sequence is:
$83.98 → $88 → $90 → $95 → $100
If $83.5–$84 continues to hold and buyers return with stronger volume, HYPE could make another attempt at $88. A confirmed break above $88–$88.5 would reopen price discovery, while a move through $90 could bring $95 and eventually $100 into focus.
The most convincing setup would not be another vertical candle. I would rather see HYPE break resistance, consolidate, and successfully defend the previous breakout area. That would show that buyers are actually absorbing supply instead of simply chasing momentum.
MY BEARISH SCENARIO
The first warning would be a decisive loss of $83.5. If that happens, I would watch $80–$81 very closely. That area is important because it can act as the major breakout/retest zone. If HYPE loses $80 with strong selling pressure, the short-term structure becomes significantly weaker and $75–$76 could become the next major area of interest.
A correction from the current level would not automatically destroy the bigger bullish trend. After a powerful rally and a new ATH, consolidation can actually be healthy. The real danger would be losing multiple major supports while volume expands on the downside.
THE REAL TRADING DECISION
At $83.98, my approach is bullish but selective. I would not treat the current price as an automatic buy simply because HYPE previously reached $88. The better confirmation would be either a strong reclaim of $88–$88.5 with expanding volume or a controlled pullback toward $83.5–$84 / $80–$81 followed by a clear bullish reaction.
The difference between a good breakout and a dangerous chase is confirmation.
HYPE has already proved that buyers can push the token into new territory. Now the market has a different job: proving that the breakout can survive its first serious test.
For me, the map is simple:
Above $88.5 with volume → bullish continuation
$83.5–$84 holds → buyers remain in control
$80–$81 holds → major retest opportunity
Below $80 → caution increases
$90 breaks → $95/$100 becomes the next focus
The $88 breakout created the headline. $83.98 is where the market is now testing the foundation.
If buyers defend this area and return with volume, HYPE could get another shot at $88, $90, $95 and eventually $100.
But I am not chasing the candle.
I want HYPE to prove that $88 was a breakout not just a temporary liquidity sweep. @Gate_Square
repost-content-media
HYPE+2.72%
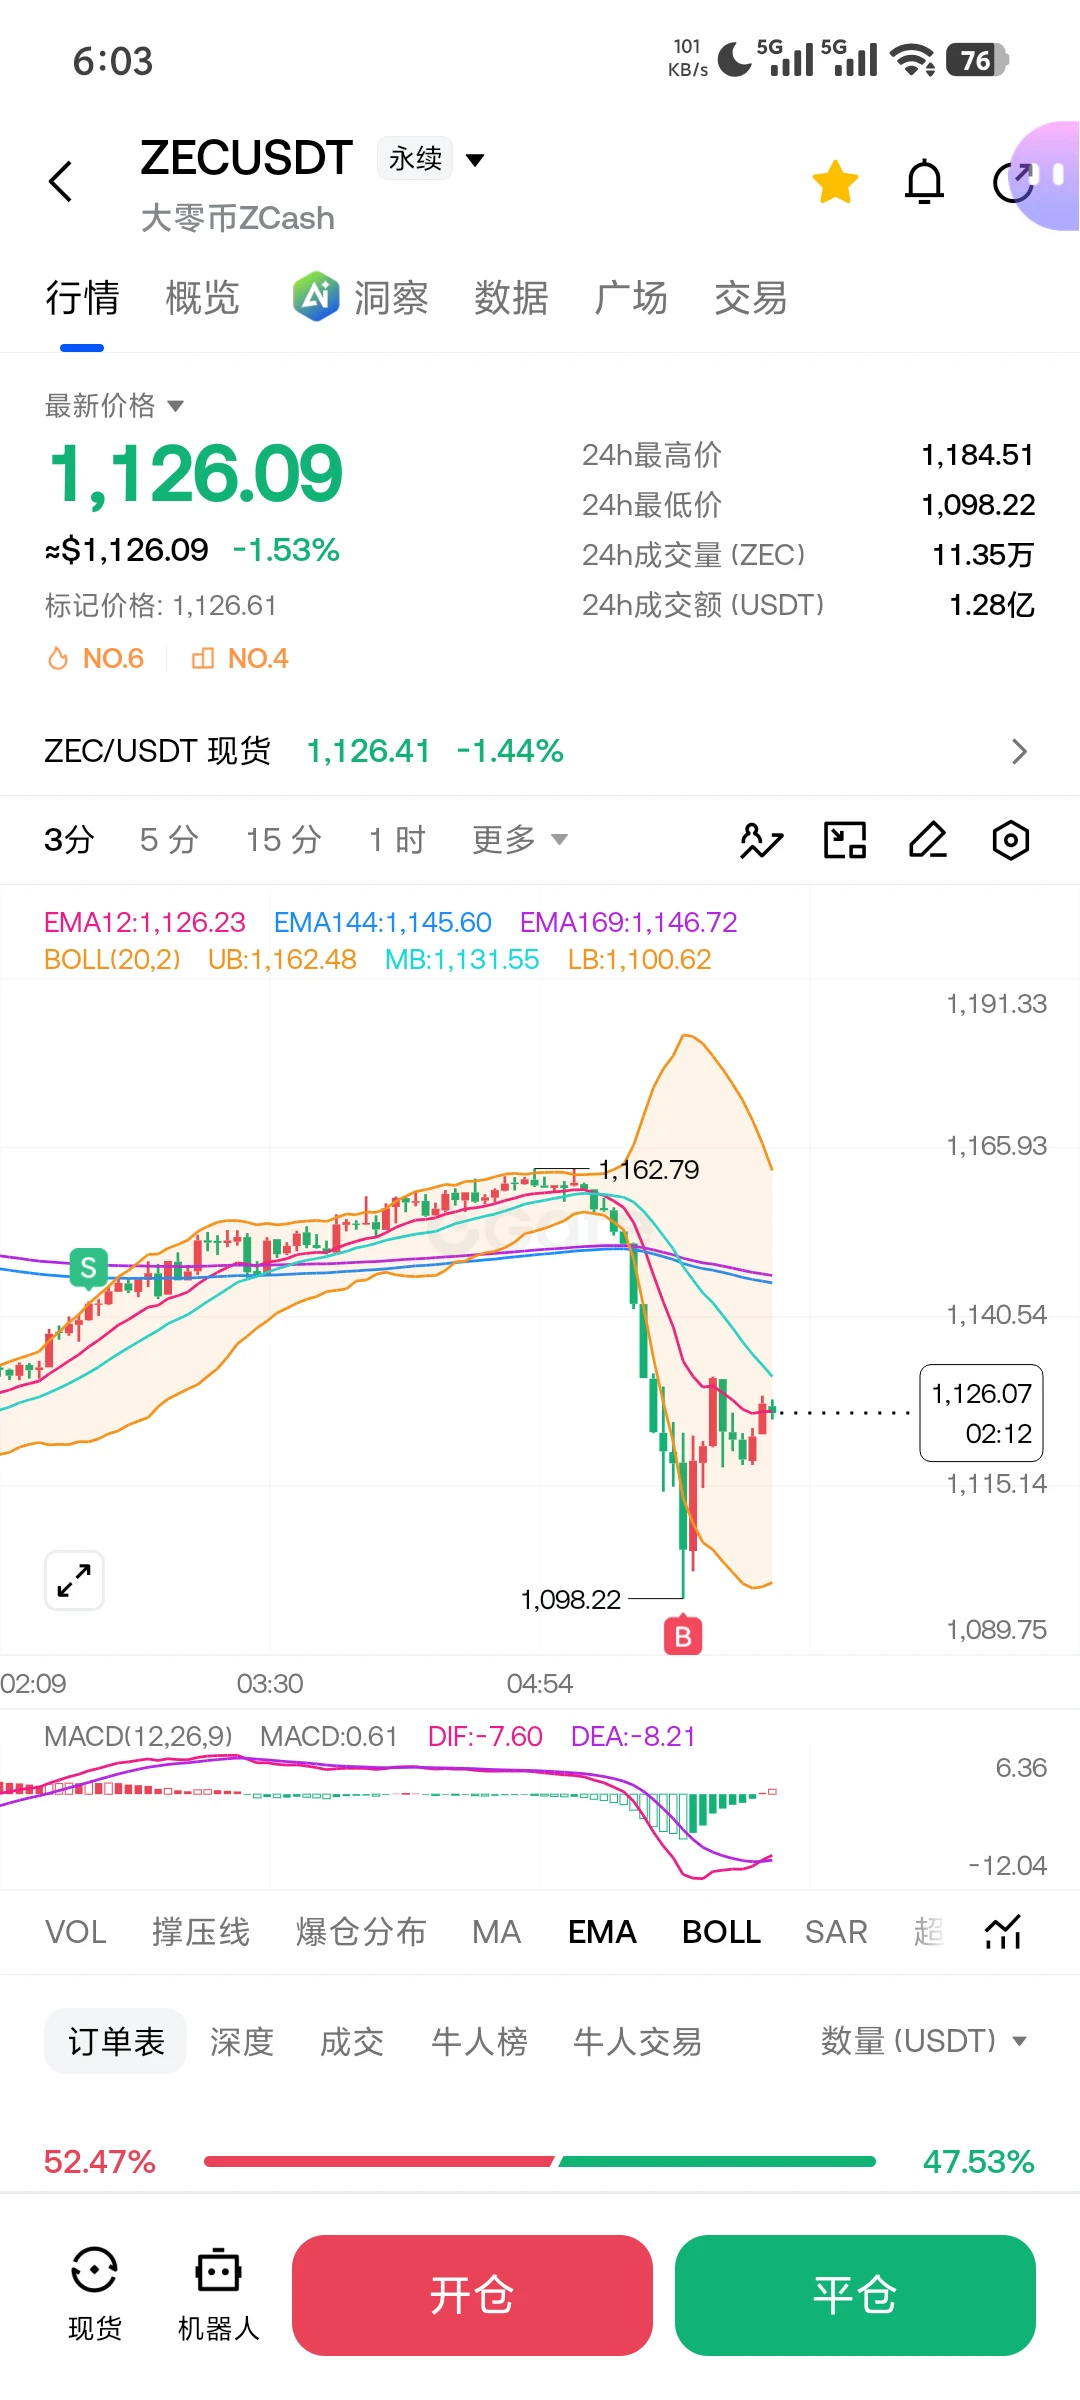
Everyone’s cheering ZEC’s bull run—but the 4h clock just struck 84% short confidence.

ZEC/USDT - SHORT

Trade Plan:
Entry: 1165.66 – 1178.98
SL: 1255.43
TP1: 1109.99
TP2: 1068.43
TP3: 1006.09

Why this setup?
- 1D trend says bullish, yet 15m RSI is screaming 82.11—overbought exhaustion at the top.
- Price pinned at 1172.32, hugging the 1h ATR (26.63) like a coiled spring.
- The “waiting” status means the trap is set: TP1 at 1109.99 is a 5.3% drop, TP2 at 1068.43 is 8.8%—while invalidation sits far below at 935.53.
- Why now? The 4h structure is fading momentum against a daily uptrend
ZEC+16.16%
Load More

Join 40 M users in our growing community

⚡️ Join 40 M users in the crypto craze discussion

💬 Engage with your favorite top creators

👍 See what interests you

View More