Square
Following
Hot
News
Notifications
Profile
Share your thoughts
placeholder
Article
On the 4-hour chart, going long $XRP : buyers need to hold 0.934. I’d like to see price hold this level on a retest. If it breaks below 0.923, I’ll abandon this idea. This is a bounce below the trend, so a stop-loss is crucial. The 4-hour price is at 0.935, below the 0.970 EMA50, so a stop-loss is important. The stop-loss distance is 1.4%, and the distance to TP3 is 2.2%. If the move goes as expected, the risk-reward ratio is about 1.6R. BTC’s short-term trend is bullish, which is a tailwind here.
Long 0.9344–0.9366 Take profit 0.9432 / 0.9484 / 0.9561 Stop-loss 0.9226 Not investment advice ·
post-image
XRP-1.15%
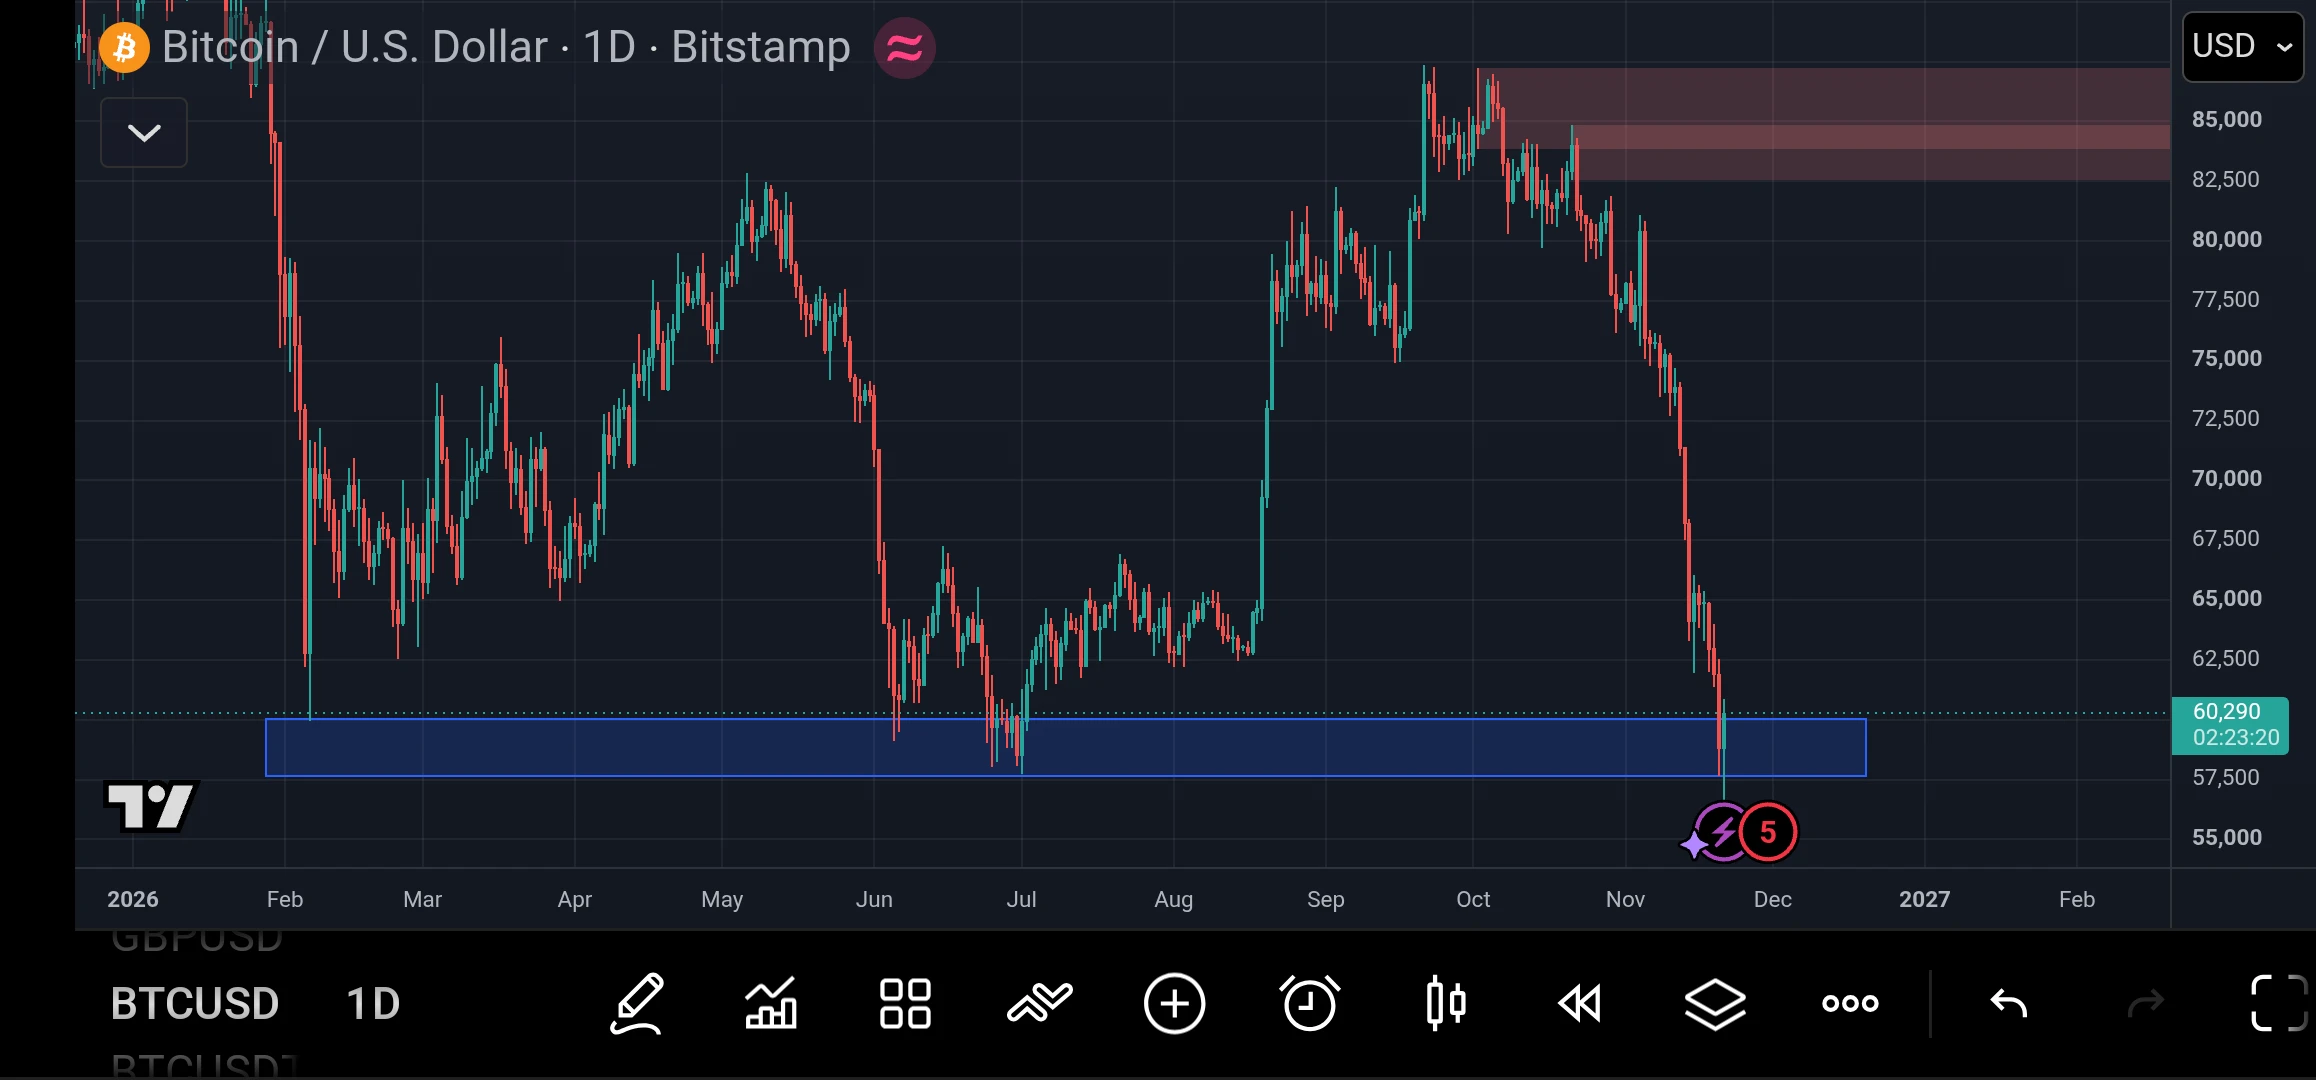
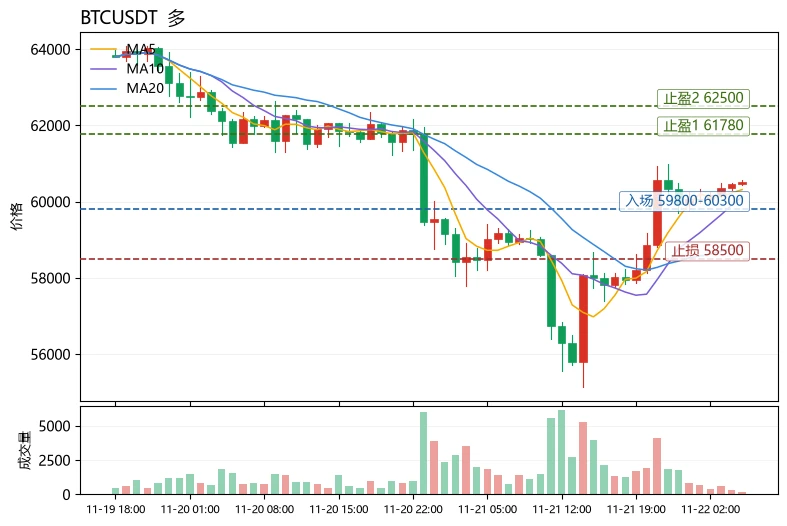
$BTC dipped below $57.5K and bounced to $60.3K. Buyers defended this zone in June and July, but the daily chart still shows lower highs.

I’m watching the daily close. Holding $60K would put $62.5K in play, while reclaiming $65K would give the recovery more weight. A close below $57.5K would leave $55K exposed.

#Bitcoin #BTCAnalysis
post-image
BTC-0.67%
  • 1
Trenches
IDOL
I
bade
b
IDOL
0x3b...ab07
Market Cap
$.
Change
.
24h Vol
$.
Holders
.
PIEVERSE
P
bade
b
PIEVERSE
0x0e...25a9
Market Cap
$.
Change
.
24h Vol
$.
Holders
.
FIONA
F
bade
b
FIONA
B34n...pump
Market Cap
$.
Change
.
24h Vol
$.
Holders
.
Singularity
S
bade
b
Singularity
7R4M...pump
Market Cap
$.
Change
.
24h Vol
$.
Holders
.
CLAUDIA
C
bade
b
CLAUDIA
2j5S...W2ZM
Market Cap
$.
Change
.
24h Vol
$.
Holders
.
BTC Technical Outlook: Bitcoin Drops Toward $60K

Bitcoin is facing strong selling pressure after breaking below its previous support structure and the rising trendline. BTC is currently trading around $60,193, following a sharp decline from the $80K–$86K region. Price is now testing the major support area near $60,155, while momentum remains heavily bearish.

The latest breakdown, combined with increased selling volume, suggests that sellers remain in control. However, the RSI has entered oversold territory, meaning a short-term relief bounce is possible if buyers defend the current support.
BTC-0.65%
  • 4
$SOL Under pressure—is $68 the next target???$SOL It has broken below the rising wedge, suggesting the price could fall further to $70.20; if selling pressure continues, it could even drop to $68. Will bulls defend these levels, or will the price continue to fall???
post-image
SOL-0.77%
Join the Gate 2026 Annual Gala: register to get 100 boost points and vote for your favorite stars of the year. For every 100 boost points you use, you get 1 draw chance(s) for a shot at surprise prizes. https://www.gate.com/competition/Annual-Gala?ref_type=165&ch=Direct&ref=BVIRBA8M$BTC ‌$ETH ‌vote for discovery gate queen 👑 discovery 👑
discovery
Join the Gate 2026 Annual Gala: register to get 100 boost points and vote for your favorite stars of the year. For every 100 boost points you use, you get 1 draw chance(s) for a shot at surprise prizes. https://www.gate.com/competition/Annual-Gala?ref_type=165&ch=Direct&ref=BVIRBA8M
repost-content-media
BTC-0.67%
ETH-1.26%
$EVAA Almost 7x now, keep holding and wait for 10x
EVAA-0.49%
Watching for a long opportunity on the 4-hour timeframe for $XRP : the key is whether buyers can hold 0.934 as support. My idea is that the price holds above this level on a pullback; if it loses 0.923, I’ll abandon the trade entirely. Essentially, this is a rebound within a downtrend, so a stop-loss is essential.
The current 4-hour price is at 0.935, still trading below the 0.970 EMA50, making a stop-loss even more important. Let’s do the math: the stop-loss distance is about 1.4%, and the distance to the third target is about 2.2%, giving a risk/reward ratio of roughly 1.6R if the trade goes
post-image
XRP-1.15%
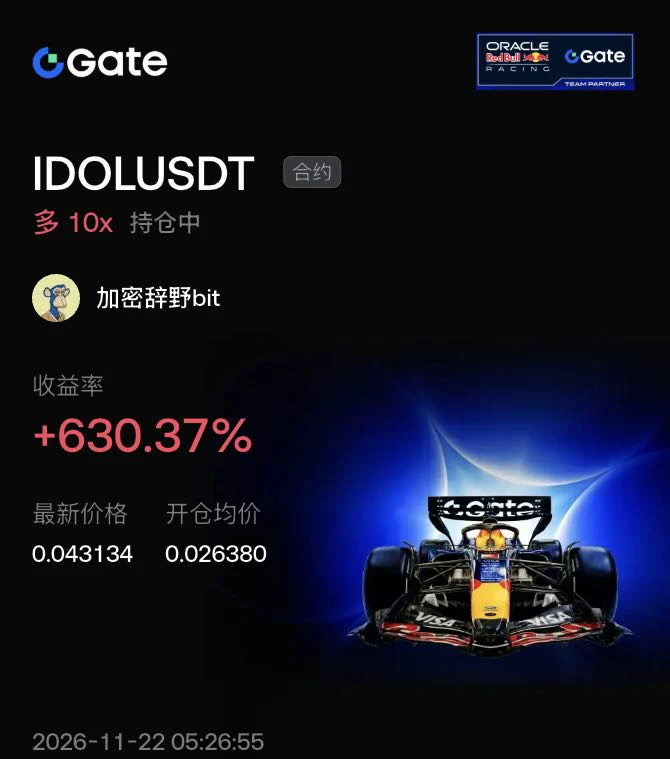
$IDOL The scariest thing in trading isn’t getting the direction wrong—it’s getting it wrong and stubbornly refusing to admit it. This IDOL move took the “epic comeback” to the extreme.

Looking at the 1-hour chart, a pullback was expected after the price moved sideways around 0.026. But who could have expected the whales to suddenly play dirty, unleash massive volume, and send a huge bullish candle soaring straight up, instantly breaking through every resistance level?

Seeing that, I immediately realized the trend had changed. Without a second thought, I closed my position and reversed, going
post-image
IDOL-6.71%
BTC-0.65%
  • 1
GT is dropping like crazy, screaming, screaming, screaming aoaoj
post-image
GT-2.41%
  • 1
I signed up for the annual gala, and I’m campaigning in the plaza now. Guys, head to the event page and give me some support points. It’s completely free, and after you send them, you can still enter the support-point raffle. You’ll win the prize yourself—I just want the ranking. Just click the link below. Help me out 🙏
https://www.gate.com/zh/competition/Annual-Gala?ref_type=165&ch=Direct&ref=UVdMV1w
  • 1
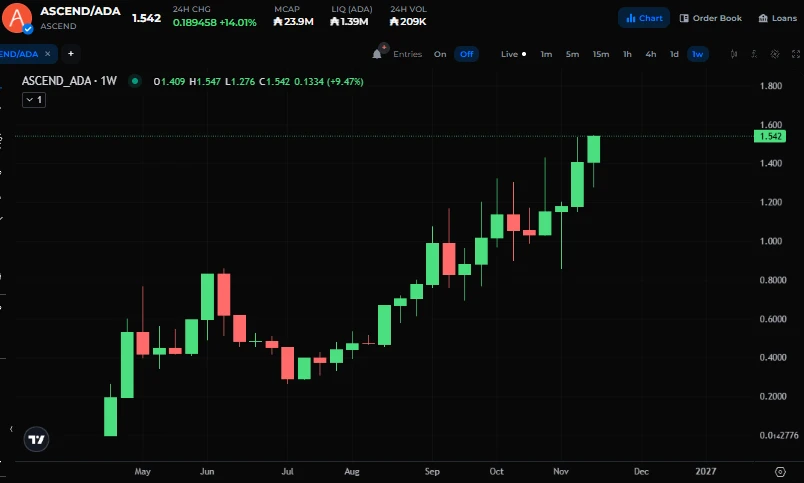
Midnight's perpetuals platform $ASCEND hits a new ATH🚀
post-image
NIGHT-3.07%
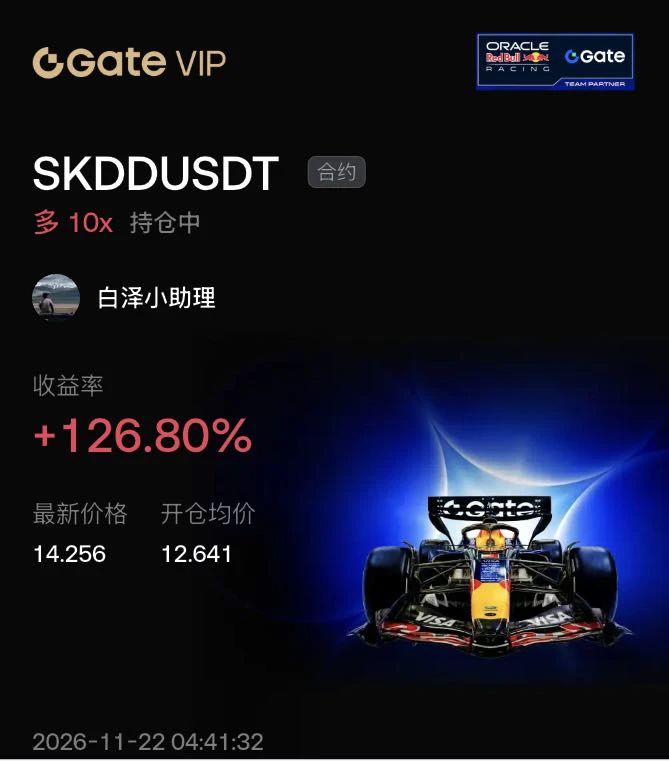
This is the most important thing right now: after the 11/20 close, SK Hynix returned to 106.3 to 106.5, up 2.6% to 2.8%; $SKDD meanwhile fell from 15.56 to 14.56 to 14.80, down 5% to 6.4%.

Whenever the other side bounces, it gives back its gains. The leverage is still 2x, and the same applies in the opposite direction.

Then look at its fundamentals: assets total only $6 million to $8 million, the annual management fee is 2.2%, and average daily trading volume is 4.45 million shares. It’s a very small fund, so gaps and severe slippage are common.

During the early morning hours, the underlyi
post-image
SKDD-1.02%
BTC-0.65%
  • 1
WEEKEND PREDICTION
live-cover
LIVE1,300
BTC-0.65%
SOL-0.74%
DOGE-0.18%
ZEC+1.29%
XAU+0.38%
For this short, keep the stop-loss tight: $BLESS . Entry: 0.012807 - 0.012905TP: 0.01210 - 0.0115SL: 0.013292Good luck to the bears; this weak rebound is just a trap before the next leg down. Caution: a sudden spike in 15m volume could invalidate the bearish thesis and push the price toward 0.01350. Don’t go all in, guys. Use a position size that suits your account.
post-image
BLESS-2.00%
🚀 BUILDING MY NEXT BULL RUN WATCHLIST! 💎
Hunting for promising gems with serious upside potential. 👀🔥
Here's what's on my radar:
$CKOM $RET $BETA $VRA $ALCX $PEPE $BONK $HOLD $POND
#Dogecoin #Pepe2 $WEB $HOT $GEO $WSM $WTC $DEXO $CAT
👇 WHAT AM I MISSING?
Drop ONE project you believe deserves a spot on this watchlist and tell us why!
Let's discover some hidden gems together. 🔥
#Crypto #Altcoins #Memecoins #BullRun
post-image
ALCX+0.13%
PEPE+0.97%
BONK-2.29%
HOLD+0.00%
POND-3.32%
The most unusual detail in today’s market is that $BTC rose 3.60% against the trend while the Fear & Greed Index was just 12 (Extreme Fear), yet the funding rate was -0.0048%—shorts are paying to hold positions, while the price has climbed above MA5 (60316.5) and MA20 (58840.4). This is a classic short-squeeze structure, not a healthy trend. In terms of volatility, the range across 30 candlesticks is about 9.69%, and the upper Bollinger Band at 61786.8 is close at hand, so the risk/reward of chasing higher has already deteriorated. My rule is to go long only after a confirmed pullback, not to
post-image
MMT-2.35%
$XMR thinks the view from the intraday high is already pretty nice. Looks like after that surge, it wants to pause and catch its breath for a while. TP: 472.63SL: 512.97Quick market check: $YB : Current price 0.05518 - 24-hour change: +16.76%$ZEC : Current price 793.17 - 24-hour change: +6.44%
post-image
XMR+0.00%
YB+2.91%
ZEC+1.16%
#NvidiaDropsNearly14Percent

Nvidia shares fell 14%, losing $491 billion in value
Nvidia shares closed Friday down 14.01% at $125.53. News that the SEC is reviewing its accounting practices and selloffs spreading across AI stocks led to a loss of approximately $491 billion in the company's market value in a single day.
The selloff was not limited to Nvidia
Double-digit losses were also seen in semiconductor companies such as AMD and Broadcom during Friday's session. The sharp decline in the Nasdaq showed how vulnerable stocks tied to the AI theme have become to shared risks. Therefore, interp
post-image
NVDA-13.84%
AMD-13.27%
AVGO-12.23%
NDAQ-0.95%
new market update
live-cover
LIVE12
BTC-0.67%
ETH-1.26%
SOL-0.77%
USDC+0.01%
XRP-1.15%
$DOGE Whales keep selling, but the price just won’t fall. That itself is a signal. Since November 3, whales holding 100k to 100 million tokens have sold a cumulative 750 million. The selling pressure is real. But after DOGE hit a low of 0.05077, buyers stubbornly pushed it back up. The bears can’t drive it lower anymore.‌

How many people kept shorting after seeing the on-chain data showing “whales trimming their holdings,” convinced that 0.05 would eventually break? But the price kept finding support above 0.05. Short sellers saw higher lows each time, and sentiment shifted from “waiting for
DOGE-0.18%
BTC-0.65%
ETH-1.23%
Load More

Join 40 M users in our growing community

⚡️ Join 40 M users in the crypto craze discussion

💬 Engage with your favorite top creators

👍 See what interests you

Trending Topics

BTCBreaksBelow60K

2.1M Views30K Discussing

BTC fell below $60,000 on November 20 for the first time since July, alongside a tech stock selloff and broader pressure on risk assets. Will $60K become resistance, or can BTC quickly reclaim it? What price or volume signals would convince you that selling pressure is easing?

GateDirectIPOPhase3ANTAllocates92100Shares

791.6K Views4.9K Discussing

NvidiaDropsNearly14Percent

331.6K Views7.6K Discussing

View More