
Share your thoughts
placeholder
Article
Choose your founder:
@VitalikButerin
@vladtenev
@cz_
@SBF_FTX
I originally wanted to cut my losses as a sacrifice to heaven, but heaven never got its offering—the meat cooked itself.

When I checked the charts after lunch, TSLAX surged again. I stared at the price action for quite a while. The resistance above was obvious, and every push higher fell just short—the bull-trap smell was far too strong. Not shorting it here would have let myself down after watching the chart for so long.

Putting risk control first is called rationality; cutting after taking a loss is called heroically cutting off a limb.

The script afterward was easy to guess: after ent
post-image
TSLAX+0.95%
XRP+1.28%
BNB+7.28%
Everyone’s staring at Bitcoin while ONDO quietly prints a 95% confidence setup.

$ONDO /USDT - LONG

Trade Plan:
Entry: 0.3685 – 0.3703
SL: 0.3608
TP1: 0.3758
TP2: 0.3801
TP3: 0.3865

Why this setup?
- 1D trend is bullish, but the 4h entry zone (0.3685–0.3703) is the low-risk trigger.
- RSI 15m at 48.9 = room to run, not overbought.
- ATR 1h (0.0036) means tight stops—SL at 0.3608 is only 2.3% away.
- Why now? Price is coiling right under TP1 (0.3758) with momentum ready to snap.

Debate:
If we break 0.3703, do you trust TP3 at 0.3865 or fade the first green candle?

⚠️ Personal mar
ONDO+3.52%
Financial News, Crypto Updates, Real-World Strategies
live-cover
LIVE1,345
crypto market prediction
live-cover
LIVE27
Everyone’s chasing longs on $SUI /USDT, but the 4h just armed a trap most will ignore.

$SUI /USDT - SHORT

Trade Plan:
Entry: 0.7980 – 0.8032
SL: 0.8252
TP1: 0.7821
TP2: 0.7698
TP3: 0.7513

Why this setup?
Why short now?
- 1D trend is *range*, not breakout—mean reversion is the edge.
- RSI 15m at 48.6 shows no momentum to push through 0.8032 supply.
- Entry ref 0.8006 with TP1 0.7821 is a clean 2.3% drop before any news.
- ATR 1h (0.0103) confirms volatility is low, so the slide will be quiet—perfect for stealth shorts.
- Confidence 55 isn’t max, but the risk/reward to SL (0.8252
SUI+6.11%
But there is one type of person I don’t recommend chasing: those who only want to get in after seeing a rise. Entering at this level leaves them uneasy, and they’ll run at the first bout of volatility. Wait and see what the next round of structure brings. Putting risk control first is called rationality; cutting losses after taking a hit is called decisive loss-cutting. There will be more opportunities ahead. Opportunities are waited for, not snatched.
$SOL $DOGE
post-image
SOL+1.93%
DOGE+7.32%
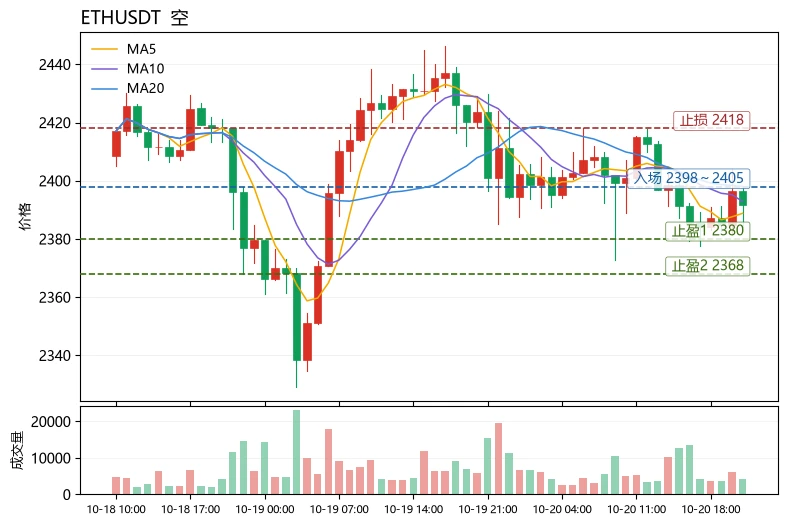
Everyone’s long ETH here—but the 4h tape is quietly whispering a different name.

$ETH /USDT - SHORT

Trade Plan:
Entry: 2471.39 – 2476.31
SL: 2497.44
TP1: 2456.16
TP2: 2444.36
TP3: 2426.67

Why this setup?
- $ETH /USDT sits at 2473.85, pinned in a 1D range while the 4h bias flips SHORT (conf: 55).
- RSI on 15m is hot at 62—buyers are exhausted, not impulsive.
- ATR 1h at 9.8 means the squeeze is tight; invalidation at 2460.15 is the line in the sand.
- Why now? We’re waiting at entry, but the path of least resistance is down toward TP1 2456, then TP2 2444.

Debate:
If 2460 breaks, d
ETH+1.09%
$TUT Signal】Long + negative funding rate short-squeeze buying dominates
$TUT Depth ratio 1.22, bid depth exceeds ask depth by 20%, and the 4H MACD histogram at 0.0010 remains above the zero line. The funding rate is -0.0172%, with shorts continuing to pay. The 1H RSI is 58.92 and the 4H RSI is 53.93, not yet in an extreme zone. The current price of 0.02808 is near the upper bound of the entry range, while the stop loss at 0.0277992 is about 1% away below, and intraday volatility is sufficient to trigger an exit.
🎯Direction: Long
⚡Entry/orders: 0.0279958 - 0.0280800
🛑Stop loss: 0.0277992
🚀T
post-image
TUT+21.47%
BTC+0.07%
ETH+1.07%
SOL+1.85%
"I'm once again telling you to buy $URCOIN "
post-image
Everyone’s staring at NEAR’s dip—but the 95% confidence score says this pullback is the trap.

$NEAR /USDT - LONG

Trade Plan:
Entry: 2.1571 – 2.1813
SL: 2.0529
TP1: 2.2564
TP2: 2.3146
TP3: 2.4019

Why this setup?
- RSI on the 15m is crushed at 33.82—oversold fuel for a bounce, not a breakdown.
- 1D trend remains bullish; this 4h setup is a classic retest of 2.1692 support.
- With ATR at 0.048, the squeeze is primed: TP1 at 2.2564 is just 4% away, but TP2 at 2.3146 is the real prize.
- Why now? The entry window (2.1571–2.1813) is open, and momentum is coiling for a vertical push.

De
NEAR+2.31%
$PENGU : Breakout Retest Under Pressure
PENGU broke above descending resistance and reached near $0.0090, but is now testing the $0.0082–$0.0084 breakout zone.
Key levels: • $0.0082–$0.0084 — support
• $0.0090–$0.0095 — resistance
• $0.0100–$0.0102 — confirmation
Daily short-sale volume has cooled below 1M, while reported short positioning remains above 11M.
The key: holding $0.0082 keeps the breakout structure intact. Losing it weakens the setup.
No prediction — just the levels and positioning worth watching.
#PENGU #PudgyPenguins #Crypto
post-image
PENGU+3.96%
$ETH Signal】Long | 1H Bollinger upper band breakout + MACD momentum expansion
$ETH RSI(1H)64.05, with the price at 2482.53 holding above the 1H Bollinger upper band at 2481.64.
The 1H MACD histogram is 3.87, while the 4H MACD histogram is 0.47 and remains in a bullish crossover state, with short-term momentum clearly dominant. EMA20/50 are tightly clustered around 2454-2462, and the price is above all moving averages. The order book Bid/Ask ratio is 0.70, with sell orders relatively heavy, so chasing longs directly carries a high risk of getting wicked. OI is stable, the funding rate is 0.005
post-image
ETH+1.09%
BTC+0.07%
SOL+1.85%
What rebound? This is CPR for my account, isn’t it? When the screen was glowing green, I was wondering: Can this market still be traded? Then, right after I finished reading the bearish news, $BZ was forcibly pulled from 92.57 to 96.44, giving me a slap in the face and telling me: Stop being stubborn—the trend is king.
The entry logic was actually very simple: the pullback held, and buying pressure strengthened. When it stops falling, it stops falling; both volume and price were hinting that someone was buying the bottom. While everyone else was running, I chose to look at the weekly structur
post-image
BZ+0.57%
LAB+2.80%
ETH+1.09%
$4 Signal】MACD dual-timeframe expansion, follow long
$4 RSI (4H) 80.32, 1H 77.68; MACD dual-timeframe bars expanding, with price moving along the upper Bollinger Band. The latest 4H candle closed at 0.034113, with aggressive buy orders accounting for 52%. The funding rate is 0.1381%, long position costs remain high, and the order book has not been overwhelmed. Order-book depth imbalance is -0.78%, with slightly greater sell-side depth. Risk-reward ratio 1.5; trade the momentum and do not overstay.
🎯Direction: Long (long)
⚡Entry/limit order: 0.03403459 - 0.03413700
🛑Stop-loss: 0.03379563
🚀T
post-image
4+36.71%
BTC+0.07%
ETH+1.07%
SOL+1.85%
15 years ago today, Bitcoin was $8
Me 15 years ago :
post-image
BTC+0.07%
  • 1
Ping Yeh, a software engineering manager at $GOOG Quantum AI, believes useful quantum computing is more than five years away
Hartmut Neven, who heads Google Quantum AI, has said recent results leave him confident that useful applications only quantum computers can handle will arrive within five years
“He is very confident,” Yeh said at the SEMICON forum. “I am a little skeptical. I want to be more conservative.”
post-image
GOOG-1.06%
GOOGL-1.12%
Everyone’s long $MU /USDT at 1017—I’m watching the 4h trap snap shut.

$MU /USDT - SHORT

Trade Plan:
Entry: 1016.38 – 1018.26
SL: 1029.04
TP1: 1008.53
TP2: 1002.68
TP3: 993.89

Why this setup?
- 1D is range, not bull—so 1017 is resistance, not launchpad.
- RSI 15m at 63.5 says local heat, but 4h structure says fade.
- TP1 at 1008 is 0.9% away—fast money, but TP3 at 993 is the real gravity well.
- ATR 3.75 on 1h means noise is thin—this move is clean.

Debate:
Is your stop above 1029, or are you praying the range breaks first?

⚠️ Personal market analysis only. NFA — manage risk and
MU+0.05%
$AKE Hold forever; 1,000x is the goal.
AKE+43.76%
I originally wanted to cut my losses as a sacrifice to the heavens, but the sacrifice never happened—the meat roasted itself. When I checked the chart after lunch, $SKHYNIX was grinding around 1235.91 and testing my patience. One look at that lower wick told me everything: this was a textbook pullback holding support, with bottom-fishing bids absurdly strong.

The thinking at the time was very simple: hold as long as the key level stayed intact, and leave only if it broke. Who could have imagined it would surge straight to 1276.07 in the afternoon, sending paper profits soaring to +229.4%? T
post-image
SKHYNIX0.00%
BTC+0.11%
SOL+1.93%
Load More

Join 40 M users in our growing community

⚡️ Join 40 M users in the crypto craze discussion

💬 Engage with your favorite top creators

👍 See what interests you

View More