Square
Following
Hot
News
Notifications
Profile
Share your thoughts
placeholder
Article
The BTC short setup shared early today played out as expected. Congrats to everyone who took profits🎉$BTC
#BTCETF资金持续流出
post-image
BTC-0.67%
Repost: I didn’t expect Jensen to actually collapse. Roughly speaking, the worst-case scenario is that Jensen’s wife gets half the shares and sells them all for cash. She would hold $75.7 billion worth of NVDA, equivalent to about 3.5 days of trading volume, with an approximately 10% impact on the market.
But California divorces have a T+6-month timeline, and the money is held in a trust. So if they divorce next year, the company’s $235 billion in buybacks in 2028 would be enough to absorb the shares.
Tech stocks, already facing considerable uncertainty, will most likely price this in early. N
post-image
NVDA+2.80%
Trenches
ZIG
Z
bade
b
ZIG
0x8c...1145
Market Cap
$.
Change
.
24h Vol
$.
Holders
.
BTC
B
bade
b
BTC
C5xp...pump
Market Cap
$.
Change
.
24h Vol
$.
Holders
.
STONK
S
bade
b
STONK
6GmA...UNgx
Market Cap
$.
Change
.
24h Vol
$.
Holders
.
ANSEM
A
bade
b
ANSEM
9cRC...pump
Market Cap
$.
Change
.
24h Vol
$.
Holders
.
MAGGIE
M
bade
b
MAGGIE
8rHo...PmZV
Market Cap
$.
Change
.
24h Vol
$.
Holders
.
Why Can the Same Trading Strategy Perform Completely Differently on Different Exchanges?

Suppose you test a BTC breakout strategy on one exchange and get good backtest results.

You then copy it to another exchange, using the same parameters and the same entry signals, only to find that profits are lower, drawdowns are larger, and even a strategy that was originally profitable starts losing money.

What went wrong?

Often, traders focus only on price signals and overlook one fact:

The way a strategy generates signals may be the same, but that doesn’t mean the conditions for filling orders ar
post-image
BTC-0.67%
ETH-1.26%
Morning update with skyvera
live-cover
LIVE1,653
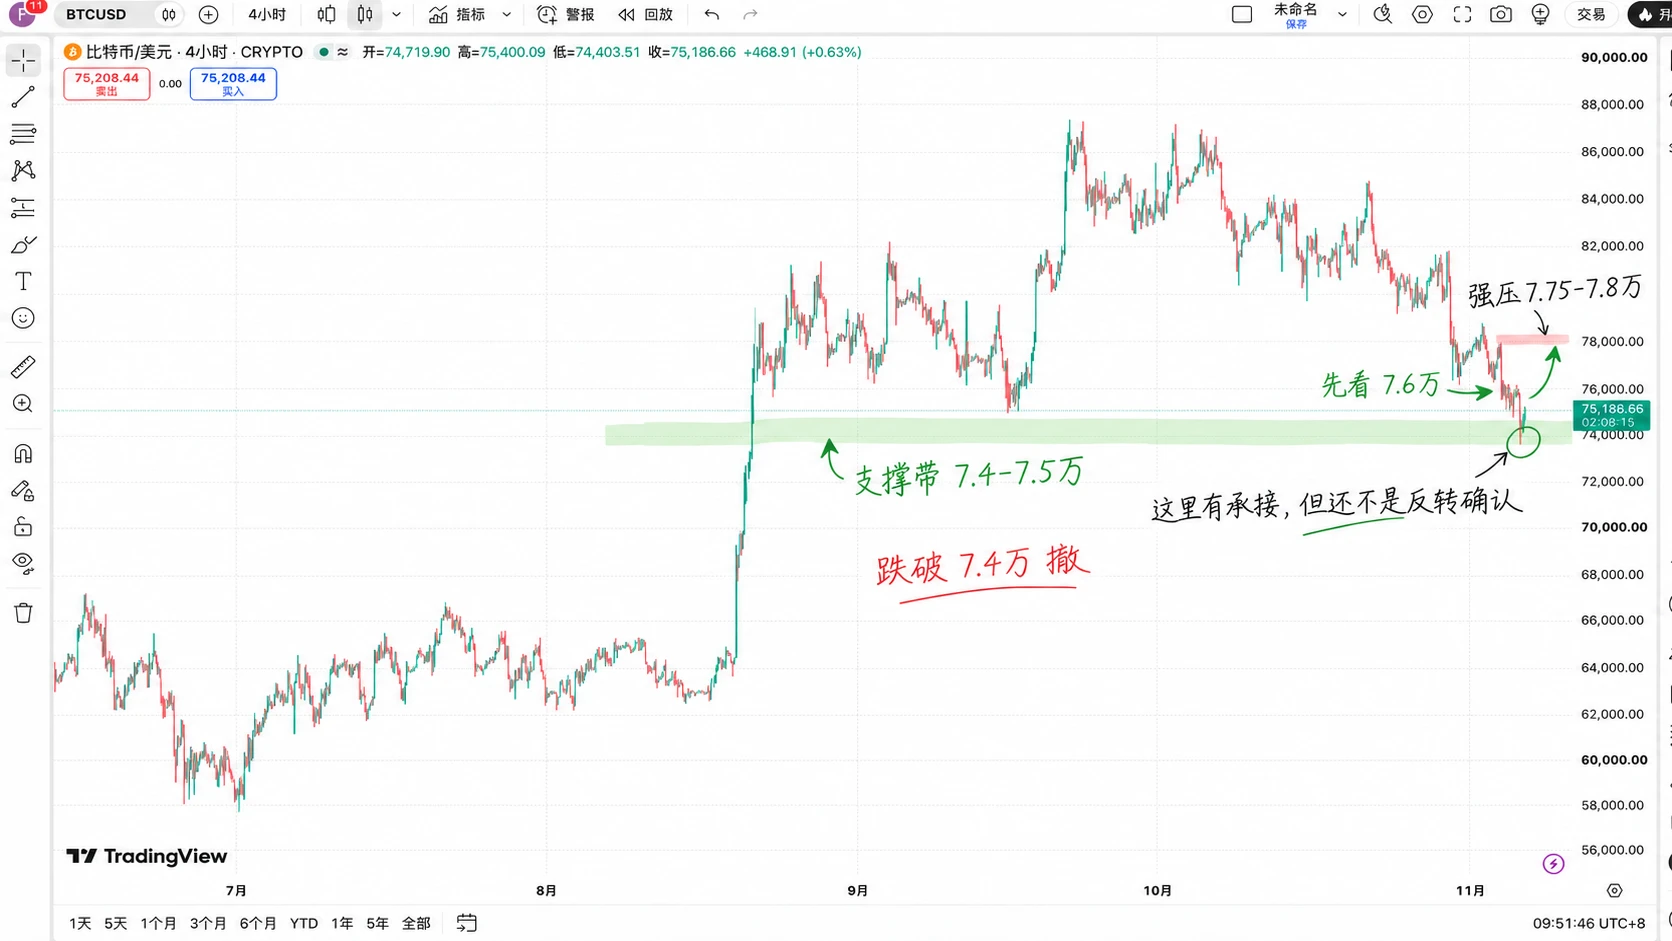
#BTCETF资金持续流出 Wow, BTC has fallen this far. Is 75k still a good level to buy the dip?

First, look at the chart. $BTC It plunged from around 87k all the way to 74k, breaking through support at 80k and 78k one after another. Now it’s finally bounced back to 75k, and people are already calling for the bull market to return.

So, has it really bottomed this time?

Honestly, I’m not that optimistic, but there’s no need to be overly pessimistic either.

There’s a detail on the 4-hour chart: BTC just broke below 74k, then bounced back above it, which shows there are still buyers below. But there’s s
post-image
At the 75k level
Golden buying opportunity
The starting point of the next downturn
1 Participants
Ends In 23 Hour
BTC-0.65%
  • 2
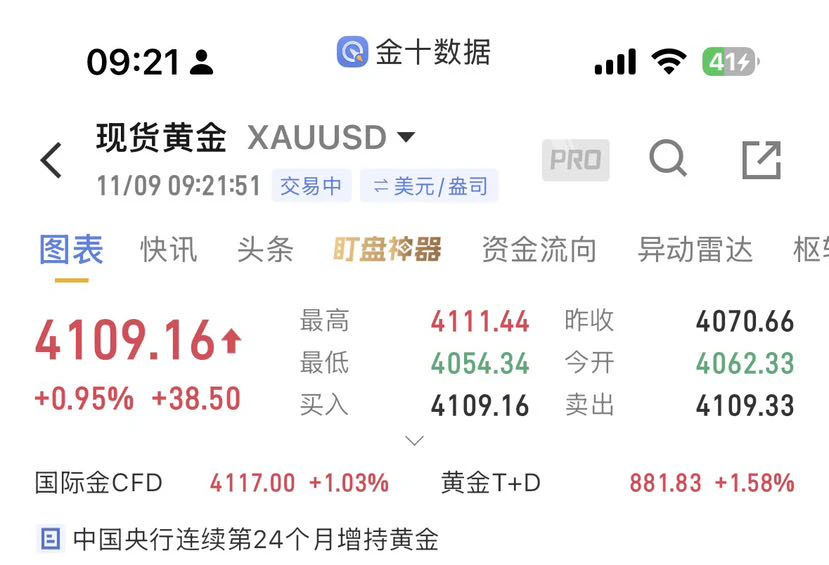
11.09 Qiqi on Gold Morning Review: Strong Early-Session Rally—Can the Bulls Keep Pushing Higher?

Gold prices surged early, briefly pulling back to 4054 before finding support and continuing higher. They have now reached around 4104, as short-term bullish momentum has surged. Bullish sentiment is picking up, but after a sustained rally, a pullback for consolidation may be needed, so chasing prices higher is not advisable.

Short-term moving averages are in a bullish alignment, and the MACD red bars are expanding. However, indicators are gradually entering overbought territory, so beware of a p
post-image
XAU+0.38%
Why do many trading strategies perform consistently in backtests, then suddenly fail when market conditions change?

A trading strategy may generate consistent profits over several months.

It may perform well in a trending market, with a beautiful backtest curve. But when the market enters a ranging phase or liquidity suddenly declines, signals that once worked may start failing frequently.

At that point, many people’s first reaction is: Are the parameters poorly tuned?

But the problem may not be the parameters at all. It may be that the market conditions the strategy relies on to make mone
post-image
Tong Ge's 11.9 BTC outlook
Enter short around $BTC 755-760, stop-loss at 765, targets: 745-740-735-730.

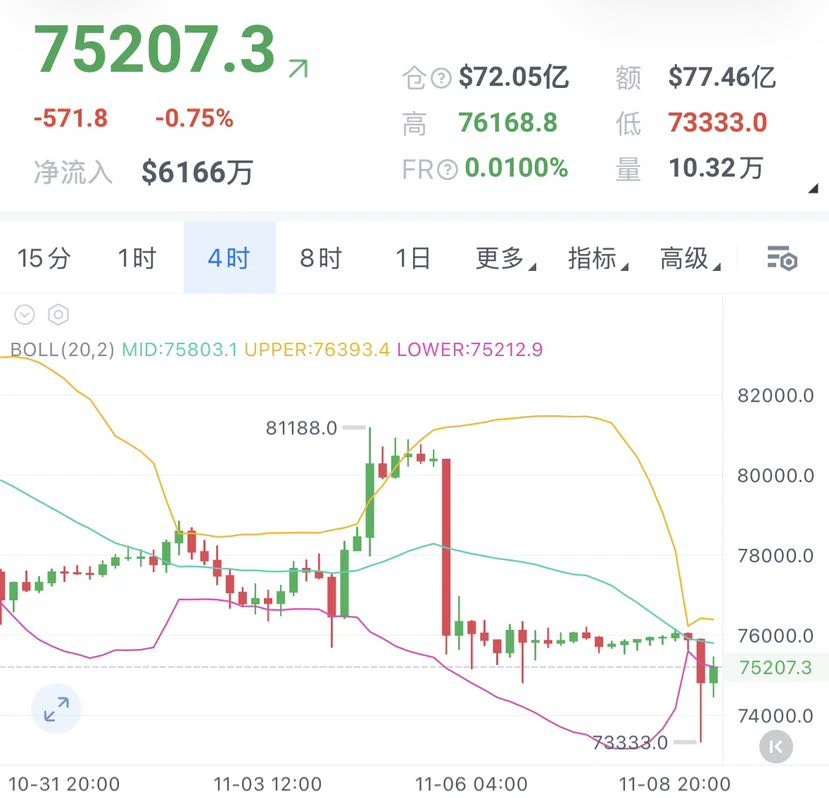
The new week has just begun, and at 5 a.m. the bulls were dealt a heavy blow. Bitcoin plunged straight from around 757 to 73333, then rebounded after becoming oversold to the current price near 752. More than 2,000 points vanished in an instant, as pent-up weekend sentiment spilled out all at once.

Remember Tong Ge's words: rebounds after sharp drops are often fast, but a fast bounce doesn't mean the trend has reversed.
On the larger time frame, the daily chart remains firmly below the mid
post-image
BTC-0.65%
I don’t think it’s a big deal
Can’t you enjoy yourself after spending your whole life building an empire?
But in the chip business, the biggest taboo is falling in love with a customer
post-image
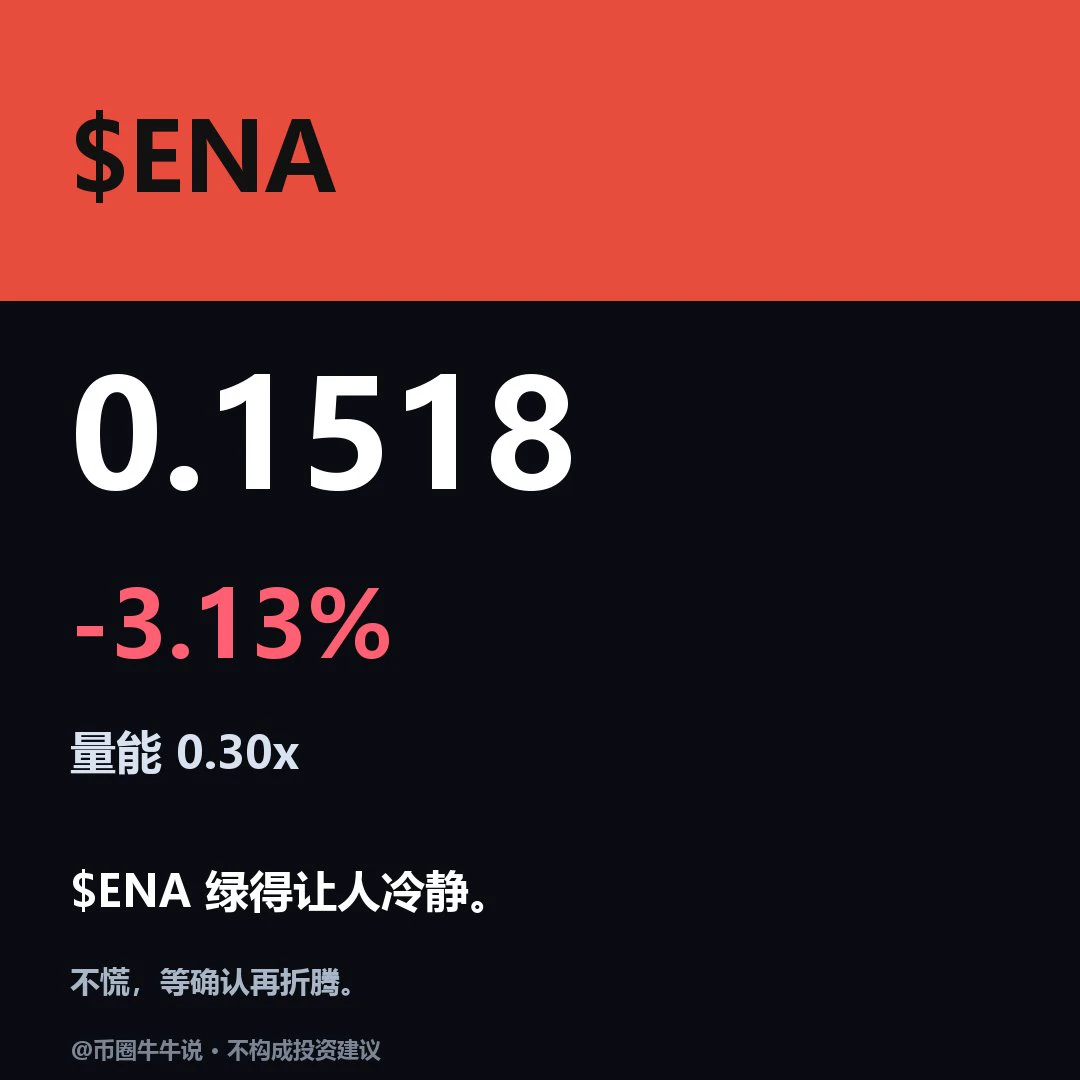
$ENA Current price: 0.1518, down 3.13% over 24H. 1H is weak: RSI 42.3/EMA20 0.1529, support 0.1441/resistance 0.1561; 4H is weak: RSI 22.7/EMA20 0.1594, support 0.1441/resistance 0.1826. For an upside move, price needs to hold above the 0.1561 resistance; on the downside, watch for a break below the 0.1441 support. Review whether 0.1561 holds and whether price can recover after losing 0.1441; the setup is invalidated if price breaks below 0.1441 and fails to recover. The market is highly volatile; for observation only.
post-image
ENA+8.04%
SHIB Key Price Levels: Rebound or Further Decline?

On November 9, Shiba Inu (SHIB) weakened further, falling below the psychological $0.00000500 threshold and sliding to around $0.00000447. The market is now at a stage where bullish and bearish forces are contending again, and price action in the coming days may determine SHIB’s short-term direction.
From a technical analysis perspective, SHIB is currently facing clear trend pressure. The daily 200-day moving average is around $0.00000545, well above the current trading price, indicating that the broader market remains bearish. Meanwhile, the
MU+4.71%
SHIB-1.31%
  • 15
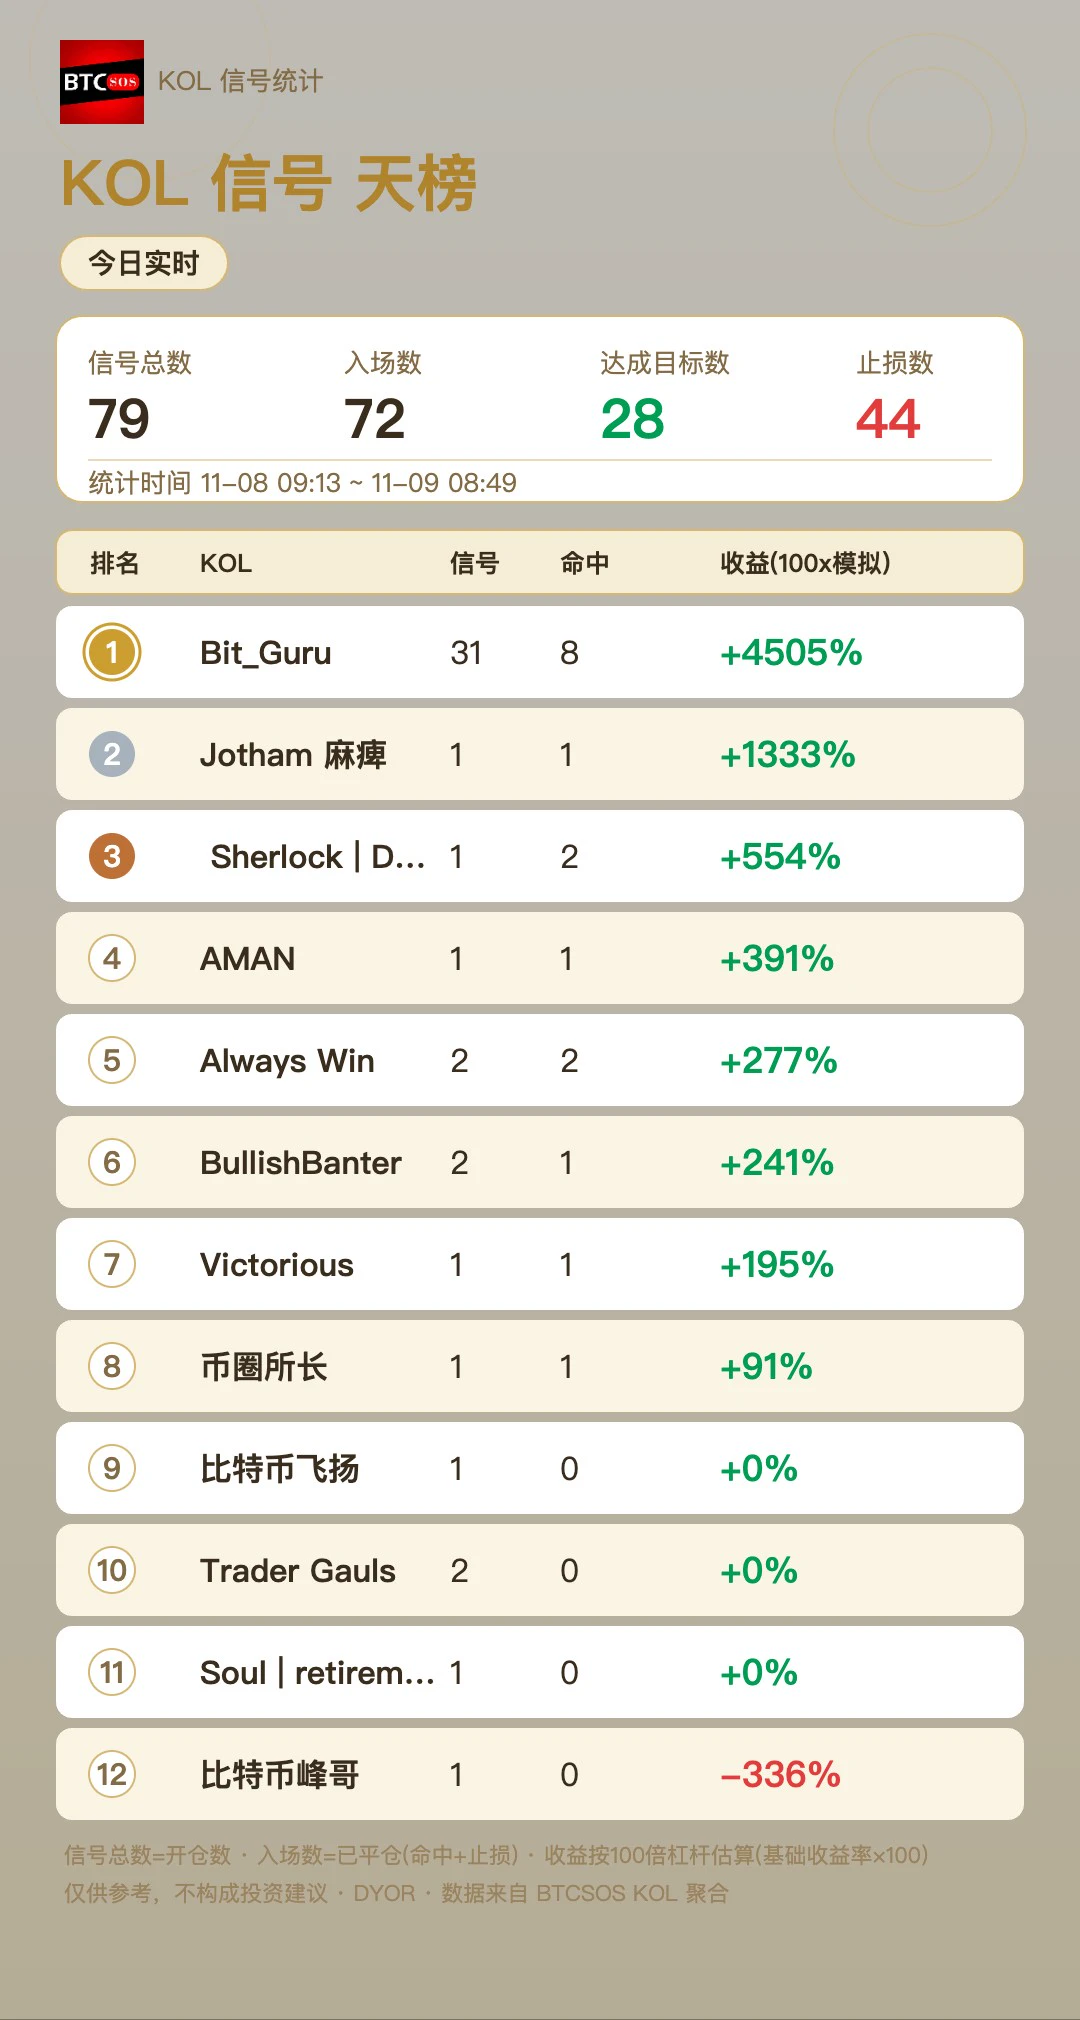
【Today’s KOL Performance Ranking】The btcsos signal feed had 79 signals, with 72 settled (28 hits / 44 stop-losses). Topping the chart: Bit_Guru, with 24 settled signals, 8 hits, and simulated returns of +4505%. See the image for the full ranking; data is live from the KOL signal feed. Notably, Bit_Guru also topped the previous ranking (11-09) with +6686%, making it a back-to-back winner. 👀#BTC and ETH spot ETFs saw net outflows of over $1.6 billion in a single week
post-image
BTC-0.31%
ETH-0.91%
Why might a trading strategy’s returns come from just a few trades?

A strategy has high cumulative returns and a decent win rate.

But if you remove the few most profitable trades and the entire strategy goes from profitable to losing, would you still consider it to have a stable trading edge?

This question is more worth exploring than simply looking at returns.

I. First, look at where the returns actually come from

Suppose a strategy completes 100 trades and ends up with a net profit of $1,000.

On the surface, the strategy is profitable.

But a closer breakdown reveals:

* The first 5 pr
post-image
11.9 ETH Silk Road

### Market Analysis
$ETH ‌#美伊谈判出现新进展
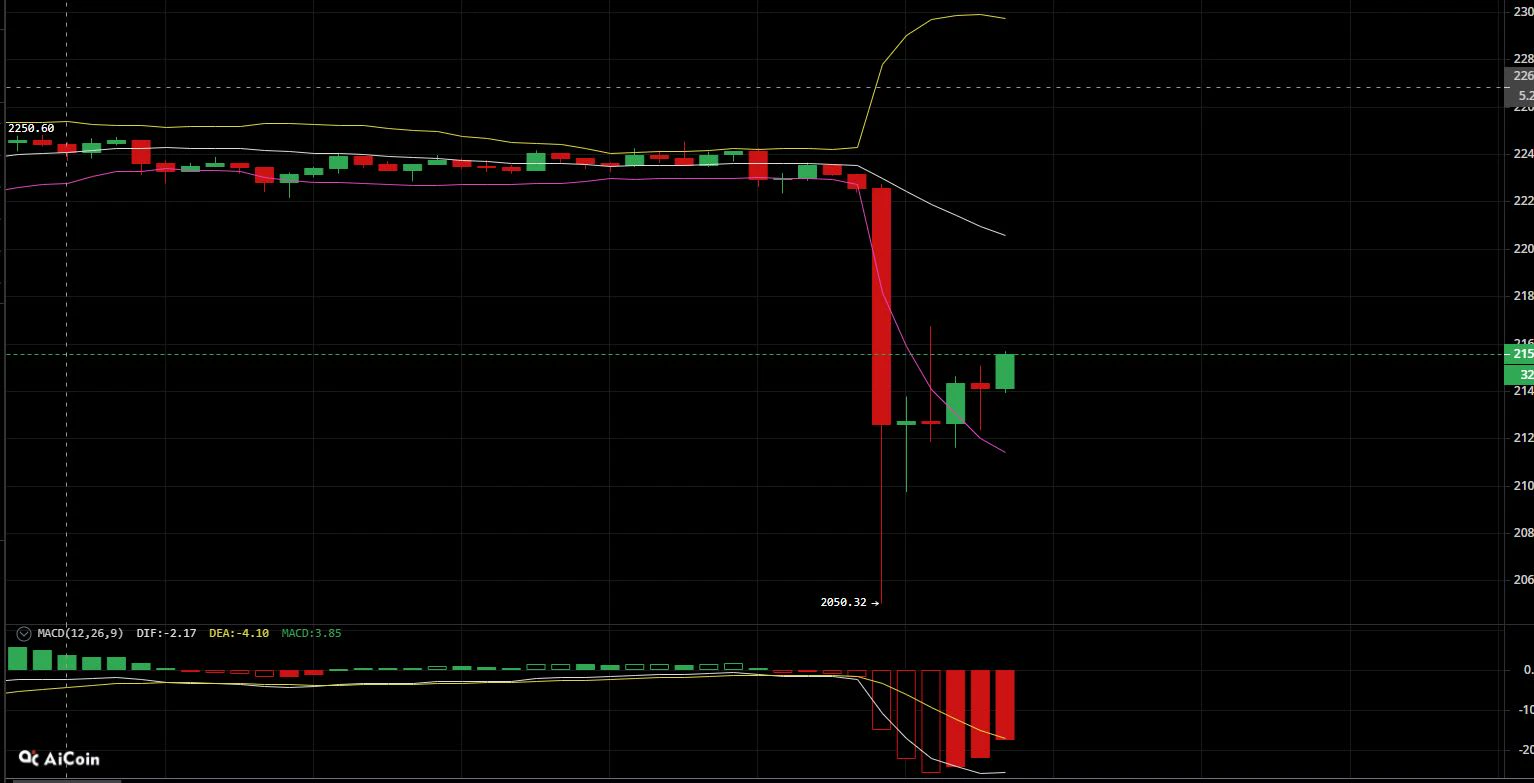
The asset previously consolidated sideways for an extended period around 2250. A large bearish candle decisively broke below the trading range, and the price quickly dropped to 2050.32, unleashing concentrated bearish momentum. The current move is a technical recovery bounce after the sharp decline, with the price rebounding to around 2150 and the MACD green bars gradually contracting, indicating easing short-term selling pressure. However, a bearish moving-average alignment has formed, and the previous trading range combined with the
post-image
ETH-1.23%
Recent dip buyers are left hanging! How much is left of those top KOLs’ supposedly 90%-win-rate Martingale strategies when they face a one-way market?

Why have I repeatedly warned people not to rush into buying the dip?

Yesterday, BTC fell to a low of around $74,780. The continued decline left many dip buyers on the back foot. This morning, it fell further to around 733.
Every time the price drops another leg, someone thinks it has hit bottom; after a rebound of a few hundred points, they think the trend has reversed. They keep adding to their positions and averaging down, until their positi
BTC-0.65%
ETH-1.23%
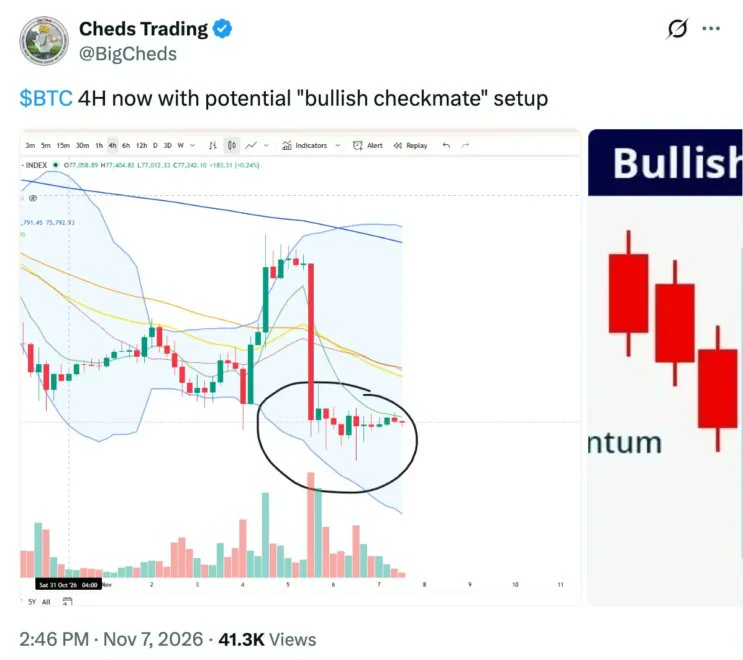
Bitcoin Technical Analysis: Bullish Checkmate Setup Near $76K
Bitcoin is going quiet after a violent week, and chart watchers think that calm could be the setup for the next move higher.
Our Bitcoin technical analysis shows that currently, BTC is trading at $75,865, down 0.41% on the day, inside a tight range between $75,645 and $75,979. That is a 0.4% daily range after a week in which Bitcoin was knocked back to the critical $76,000 level by the AI-driven sell-off.
⚠️ Personal market analysis only. NFA — manage risk and DYOR.
Educational content, not investment advice or a recommendation to b
post-image
BTC-0.67%
Gold spot trade

Short near the current price of 4110, add to the position at 4117, stop at 4122, with downside targets at 4000-4090-4070$XAU ‌
post-image
XAU+0.38%
  • 1
Feeling great. I’ll never bet against BLG again in my life 🫡
Basically a 3:0—I bet on them four games in a row. Made a little profit.
post-image
AI stocks plunge, but tech giants are insisting that demand hasn’t disappeared! Is this round of AI
live-cover
LIVE2,104
Load More

Join 40 M users in our growing community

⚡️ Join 40 M users in the crypto craze discussion

💬 Engage with your favorite top creators

👍 See what interests you

Trending Topics

USCPIDataIncoming

21.09k Views1.72k Discussing

The U.S. October CPI report will be released on November 10 at 8:30 a.m. ET. September CPI came in at 3.7% year over year, and markets will be watching closely for signs that inflation is cooling, especially in core CPI. A softer-than-expected reading could strengthen rate-cut expectations, while hotter inflation may pressure risk assets through higher Treasury yields and a stronger dollar. How do you think this CPI print will move $BTC, U.S. stocks and gold?

BTCFlashCrash

11.44k Views65.99k Discussing

USAIStocksHitHard

31.15k Views3.75k Discussing

View More