Share your thoughts
placeholder
Article
I had just switched the app to the background when it suddenly popped back up—are you playing hide-and-seek with me? I wasn't expecting much from this move, but $ARB really knows how to surprise people.

Luckily, I hadn't canceled the order I placed before bed a few days ago, and it steadily caught the price around 0.10885. At the time, I saw it forming a bottom without breaking down, while funds were quietly flowing in, so I knew this level would most likely deliver an answer. Looking again today, the current price has already shot up to 0.1787, with a +3689.72% return sitting there—it compl
post-image
ARB+46.42%
ETH+1.40%
ADA+4.03%
🇺🇸 US dollar has lost 97% of its purchasing power since the Federal Reserve was created.
A $3 item in 1913 would cost $100 today.
post-image
With this move, I don't even need to think—the account is dancing on its own.

Right after lunch, when I checked the chart, $ZEC had just pulled back to around 610.37. Volume hadn't contracted, and there were buyers waiting below—a textbook pullback that held support. When an opportunity comes, you have to move fast, so I went long immediately.

The candle has now touched 1035.58, with unrealized gains of +4942.73%. That was a satisfying bite of profit—the people on board should all be waking up laughing. Being flat isn't a sin; opening positions recklessly is the mistake. I'll take 75% off
post-image
ZEC+0.82%
LAB+1.71%
DOGE+6.44%
Four signals 🔥 to understand current crypto market changes!
A roundup of four industry trends worth watching closely recently 👇
✅ Morgan Stanley continues increasing its BTC holdings
It has accumulated a total of 355 BTC over the past 4 days, while spot BTC-ETF net inflows continue. The single-day increase is not explosive, but the consistency is what matters. Traditional institutions are steadily entering the market in batches. Short-term inflows do not yet mean the trend has completely reversed.
✅ Fierce competition for USDH issuance rights
Several major players, including Paxos, Frax, and
post-image
BTC+0.34%
HYPE+1.07%
SNDK+11.88%
market overview
live-cover
LIVE1,441
WLD's 4h chart is whispering a short—but 55% confidence means the market is laughing at certainty.

$WLD /USDT - SHORT

Trade Plan:
Entry: 0.3960 – 0.3982
SL: 0.4076
TP1: 0.3892
TP2: 0.3839
TP3: 0.3760

Why this setup?
Why now? The 1D trend is *range*, not breakout—so mean-reversion rules. RSI on 15m sits at 51.01, dead neutral, giving price room to drop without overbought friction. Entry ref at 0.3971, with TP1 at 0.3892 (a clean 2% sweep) and TP2 at 0.3839—that's where the range's lower lip likely bites. ATR on 1h (0.004387) is tight, so the move should be slow, not violent—perfect for a
WLD+3.17%
📊 $CRV looking interesting.
The level to watch is $0.40–$0.45 on the weekly.
• Flip + hold ✓ → 1W 200EMA next
And if $CRV flips the 1W 200EMA into support, then $1.0–$1.4 comes into play for the med term. 📈✍️
#CRV #CRVUSDT #Curve #Alts #Crypto
post-image
CRV+10.88%
A few days ago, I checked $AKE ’s chart before going to bed. After a series of small bullish candles formed, I chose not to add to my position, but moved up the take-profit level for my long position first. I entered around 0.0129703, and the current price is 0.0183729, giving an unrealized gain of +1022.45%.
Since the area above was a previous high-volume trading zone, I did not close everything at once. Instead, I first closed 70% of the position and moved the take-profit level for the remaining 30% above the entry price, letting it run a little longer.
The difficulty at this level is that t
post-image
AKE+39.67%
ZEC+0.82%
SNDK+1.83%
Everyone’s waiting for XLM to break out—but the 4H chart just whispered a dirty secret nobody’s pricing in.

$XLM /USDT - SHORT

Trade Plan:
Entry: 0.18434 – 0.18508
SL: 0.18823
TP1: 0.18207
TP2: 0.18031
TP3: 0.17767

Why this setup?
- XLM is stuck in a 1D range, and the 4H bias is SHORT with 55% confidence—not a screaming sell, but a “don’t get greedy” warning.
- RSI on 15m sits at 49.73—neutral, meaning no buying panic to save the dip.
- Entry at 0.18471 with TP1 at 0.18207 (1.4% drop) and TP2 at 0.18031—that’s your “why now?”: price is stalling under resistance while ATR (0.001466) s
XLM+3.27%
Most traders will fade this WLD/USDT short—that’s exactly why I’m watching 0.3974 break.

WLD/USDT - SHORT

Trade Plan:
Entry: 0.3964 – 0.3984
SL: 0.4073
TP1: 0.3900
TP2: 0.3850
TP3: 0.3776

Why this setup?
- 4h bias is SHORT (55% confidence)—not a screaming signal, but the range top is rejecting.
- RSI 15m at 51.5 shows zero momentum; we’re coiling under resistance, not above support.
- ATR 1h (0.00413) is tight—volatility is about to expand, and the path of least resistance is down to TP1 at 0.3900.
- Why now? We’re waiting at entry_ref 0.3974 while 1D stays range-bound—this is a sc
WLD+3.06%
Everyone’s buying gold’s dip—but XAUT’s 4h just armed a trap most won’t see.

$XAUT /USDT - SHORT

Trade Plan:
Entry: 4426.6 – 4429.0
SL: 4437.1
TP1: 4420.8
TP2: 4416.2
TP3: 4409.3

Why this setup?
Why now?
- 1D trend is **range**, not breakout—so chasing longs is gambling.
- RSI 15m at 48.7 shows zero momentum; price is stalling under 4427.8 resistance.
- ATR 4.6 on 1h means volatility is thin—perfect for a quiet grind to TP2 at 4416.
- With 55% confidence, this is a probability play, not a certainty—risk is defined at 4437.

Debate:
If XAUT slips below 4426, do you trust TP2 at 4
XAUT+0.03%
$MEME
run it back.
post-image
MEME+3.81%
I originally just wanted to mooch a breakfast, but the market ended up making dumplings out of me for half a year. I opened the charts this morning, and before my eyes were even fully open, I saw the price bubbling up on its own. A few days ago, while watching the market in the early hours, $TAC had been moving sideways at the bottom. Everyone was waiting and watching. I stared at the order book for a while and saw funds entering slowly but steadily, with small orders constantly providing support at the bottom. In situations like this, I don't hesitate—I reached in and bought some around 0.002
post-image
TAC-4.39%
ZEC+0.82%
LAB+1.71%
Giveaway 3 GTD spots @Chomponhood
Requirements
> Drop evm wallet
12 Hours
post-image
I just switched the app to the background, and it shot right back up—are you playing hide-and-seek with me?

When I checked the chart after lunch, it was still grinding along the bottom, but the K-line had already printed several long lower wicks in a row. When I opened it again in the afternoon, I happened to catch the high-volume breakout. This kind of upward move clearly isn't something retail traders can lift, so I went with the trend and opened a long at 13.489, starting with a small position to test the waters.

Now at 17.821, $SNXX the rally has been very clean, and the return on my p
post-image
SNXX+3.39%
SNDK+1.83%
LAB+1.71%
morning update 🥰🌹
live-cover
LIVE1,925
Nobody’s watching ADA while it quietly sets up a trap at 0.2191—are you the exit liquidity?

ADA/USDT - SHORT

Trade Plan:
Entry: 0.2185 – 0.2197
SL: 0.2245
TP1: 0.2150
TP2: 0.2123
TP3: 0.2083

Why this setup?
Why now?
- 4h bias is SHORT with 55% conviction, but the 1D trend is *range*, meaning this isn’t a breakout—it’s a rejection play.
- RSI 15m at 49.56 = zero momentum, so price is drifting into the kill zone (0.2185–0.2197) without buyers.
- ATR 1h (0.0023) is thin—low volatility means stop hunts are cheap. Target TP1 at 0.2150 before the real move.
- Invalid only if we lose 0.
ADA+3.92%
$COIN Signal】Long · 1H buying support enters
$COIN 4H RSI 70.07, MACD histogram narrowed to 0.0056, with the price moving sideways in the 0.176-0.181 range. 1H MACD bearish expansion, with buying support appearing repeatedly at the 0.1699-0.1717 lows and buyers providing real-time support. Depth imbalance is 1.77%, Bid/Ask depth is 1.04, and selling pressure is being absorbed quickly.
🎯Direction: Long
⚡Entry/limit order: 0.178164-0.178700
🛑Stop-loss: 0.176913
🚀Target 1: 0.181381
🚀Target 2: 0.182721
🛡️Trade management: - Execution strategy: After reaching target 1, reduce the position by
post-image
COIN+0.57%
BTC+0.31%
ETH+1.41%
SOL+1.39%
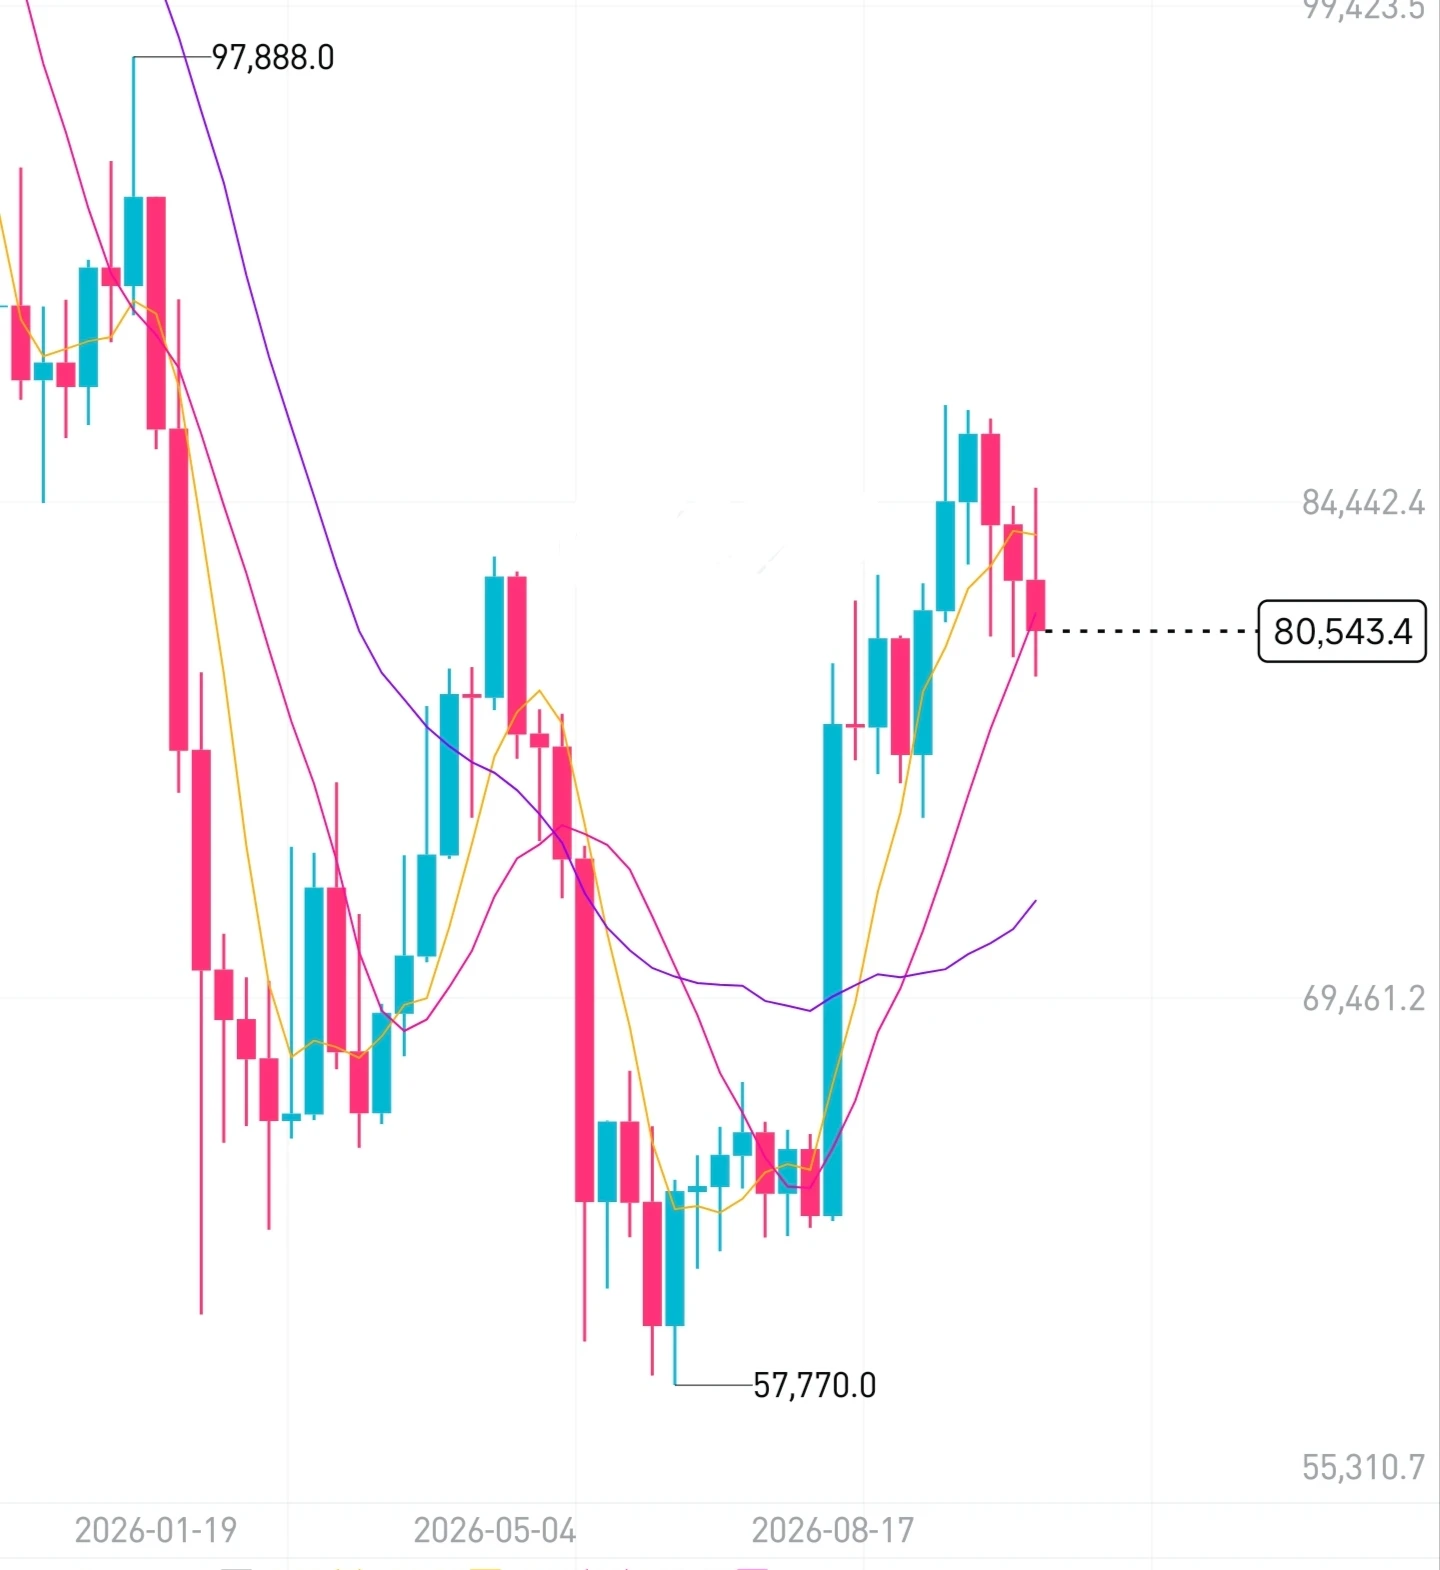
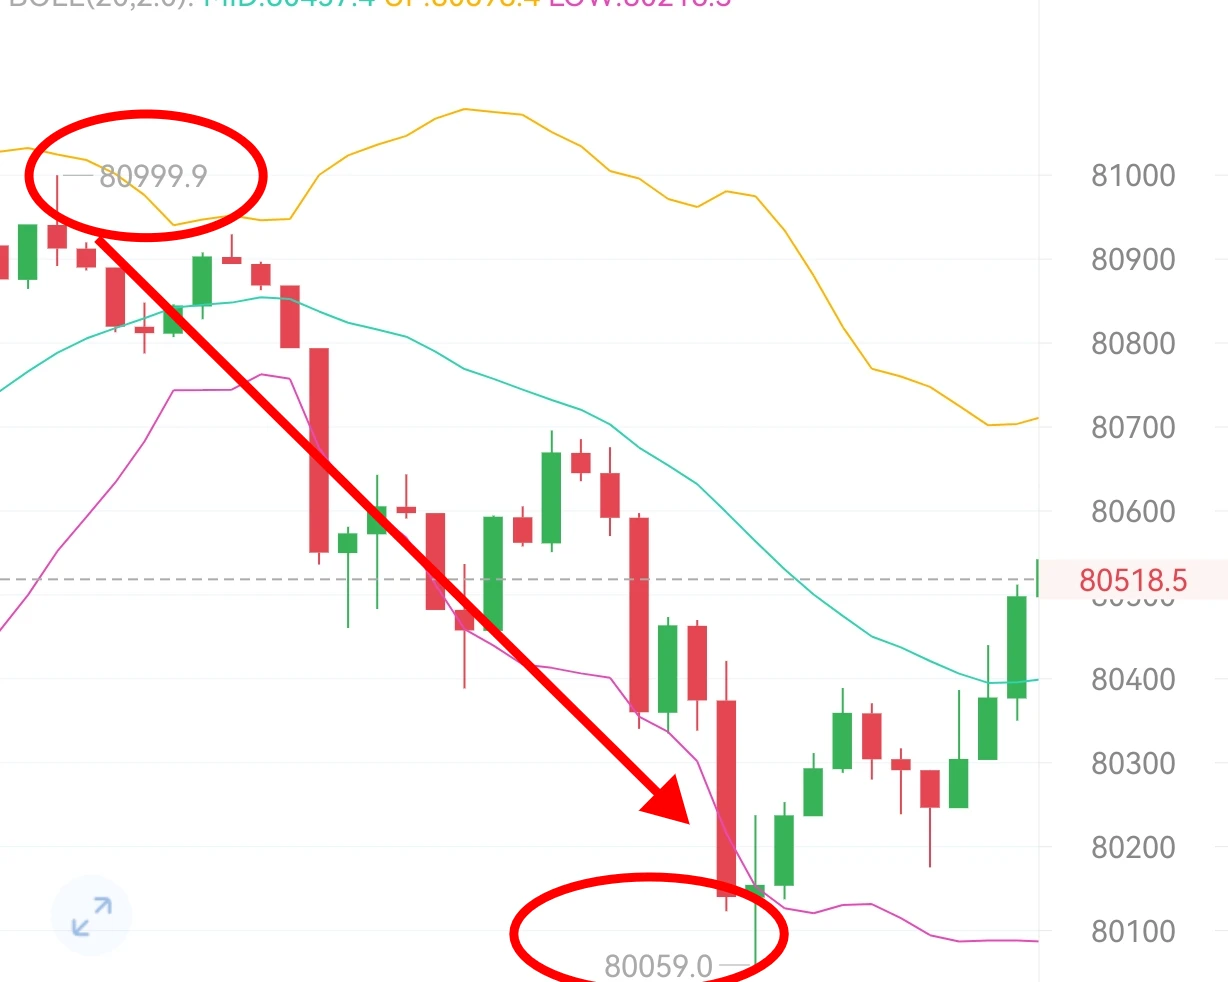
#BTCReclaims80K BTC Reclaims $80K, Market Confidence Returns
Bitcoin reclaiming the $80,000 level is more than just another move on the price chart. It represents an important psychological milestone for the market, because round-number levels often become powerful areas where traders decide whether momentum is strong enough to continue or whether another correction could begin.
The recovery above $80K shows that buyers are willing to step back into the market after periods of uncertainty. When Bitcoin successfully moves back above a major psychological level, market sentiment can change quick
BTC+0.31%
Load More

Join 40 M users in our growing community

⚡️ Join 40 M users in the crypto craze discussion

💬 Engage with your favorite top creators

👍 See what interests you

View More