
Square
Following
Hot
News
Notifications
Profile
Share your thoughts
placeholder
Article
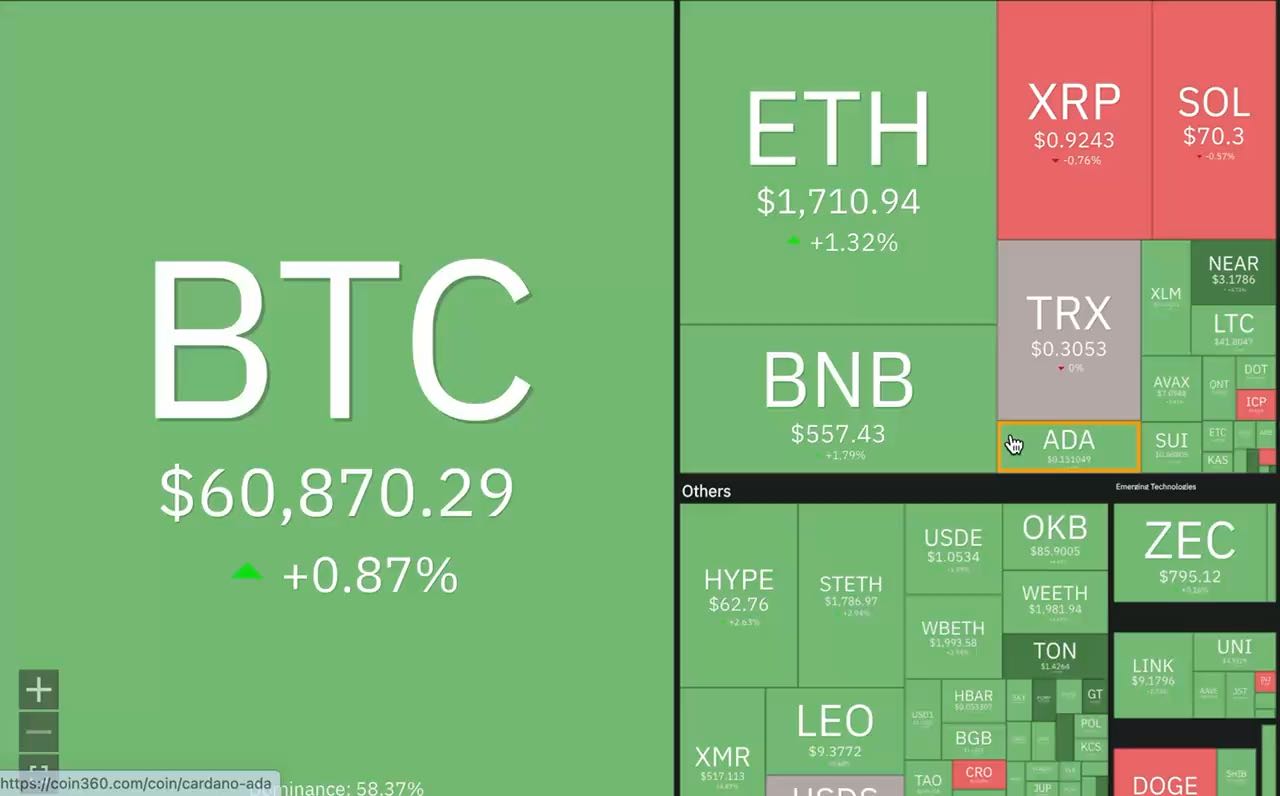
$BTC holding $60.8K
$ETH up 1.32%
$BNB up 1.79%
$XRP down
$SOL down

Even the top coins can’t agree on market direction

The market's giving us a little green and suddenly we’re all back to being long-term investors

Who is actually buying these levels?
BTC-0.67%
ETH-1.26%
BNB-0.76%
XRP-1.15%
SOL-0.77%
Fund flows diverged sharply today, with different assets clearly moving out of sync:
The order books for $BTC and $SOL show buyers stepping in to provide support, while $ETH looks weak, with capital flowing out. In this divided market, don’t mistake a rebound for a reversal.
$BTC : Net inflows of 135.85 BTC in a single day, with the share of inflows from very large orders especially notable, indicate that big money is actively stepping in to buy. $ETH : Net outflows of 1791.29 ETH in a single day; major players are exiting, not adding to their positions. $SOL : Net inflows of 16.9k SOL in a
post-image
BTC-0.67%
ETH-1.26%
  • 1
Trenches
PIEVERSE
P
bade
b
PIEVERSE
0x0e...25a9
Market Cap
$
Change
.
24h Vol
$.
Holders
.
IDOL
I
bade
b
IDOL
0x3b...ab07
Market Cap
$.
Change
.
24h Vol
$.
Holders
.
JAGENT
J
bade
b
JAGENT
0x8e...ae15
Market Cap
$.
Change
.
24h Vol
$.
Holders
.
CATE
C
bade
b
CATE
Ai66...pump
Market Cap
$.
Change
.
24h Vol
$.
Holders
.
mihao
m
bade
b
mihao
4Cxj...pump
Market Cap
$.
Change
.
24h Vol
$.
Holders
Nothing to complain about with this $ACE trade. Take the money while it’s profitable. Close the position here. ROI: 183% Profit: 1029 USDT Also running:
$BR : Current price 0.4579 - 24-hour change: +13.74%
$BLESS : Current price 0.016866 - 24-hour change: +32.51%
post-image
ACE-4.36%
BR+6.00%
BLESS-2.00%
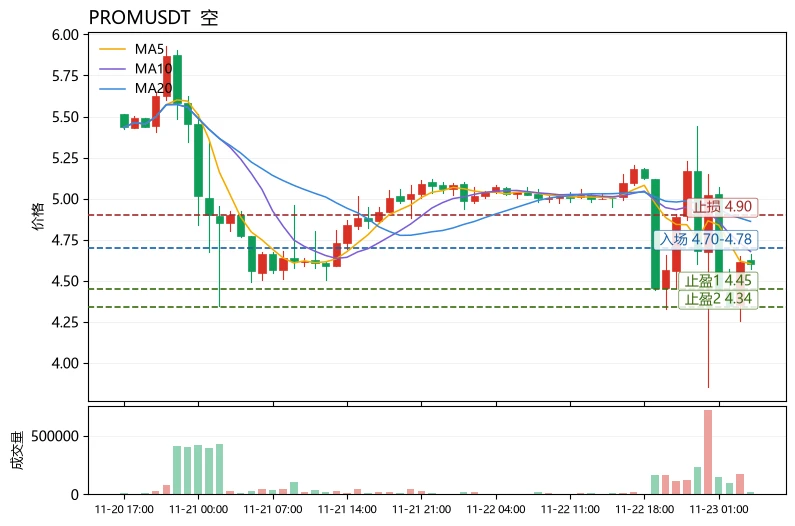
$PROM Current price: 4.604; first resistance above: 4.8616 (MA20); first support below: 4.34 (lower Bollinger Band). Price is hugging the lower Bollinger Band, with MA5 overlapping the current price and far below MA20. The moving averages are bearishly aligned, and the MACD histogram at -0.0411 remains below the zero line, indicating insufficient rebound momentum. However, RSI at 44.7 is not oversold, the funding rate of -0.0123% shows shorts are paying and a short squeeze risk exists, while the extreme fear reading of 11 on the Fear and Greed Index also means the risk-reward for chasing shor
post-image
PROM+0.45%
DOGE-0.22%
SUI-1.05%
Live trading - Analysis crypto coin
live-cover
LIVE2,097
ETH-1.26%
BTC-0.67%
GT-2.41%
Only 6 strong signals this round: AKE, EVAA, IDOL; 2 longs and 4 shorts. First watch volume and structure, then act. Last round: 4 wins, 1 loss, +16.6%. TAO and APT are in the red; the 15 positions currently held are up an average of +2.0%. Steady pace, no rush to declare a winner or loser. 🎯 Last round's returns: TAO entry $189.6700 → exit $189.6700, 5.0x leverage, gained +3.4%; APT entry $0.3817 → exit $0.3794, 5.0x leverage, gained +3.0%━━━ Market View ━━━BTC $60,709, +0.6%. Bearish signals are more concentrated; negative funding rate data is temporarily unavailable, and funds are still ch
post-image
AKE+6.39%
EVAA-0.42%
IDOL-7.01%
ACE-4.27%
BULLA+10.92%
[NEW STREAMER]market update
live-cover
LIVE3,386
BTC-0.67%
🚨🚀 BITCOIN BREAKOUT IS LOADING!!!
$BTC could be preparing for a massive move, and the next few days could get VERY interesting! 👀📈
Bulls, are you ready for the next big pump? 🔥
LET'S GO! 🤑💎
#Bitcoin #BTC #Crypto #BullRun
post-image
BTC-0.67%
Large IPOs are often seen as a signal that the market is peaking, but by the time $ANT made its debut, the broader market had already taken a dive.
$ANT listed on 11/19 at an IPO price of 83, surged to 111.5 at the open for a 34% premium, then retreated to close at 97.17.
The following day, it hit an intraday low of 83.05, nearly falling back to its IPO price, before closing at 88.91.
The closest comparable case is $RIVN .
It went public in November 2021, opening 37% above its IPO price, close to $ANT's first-day gain. Nine days later, the Nasdaq 100 hit the peak of that rally; a year later,
post-image
ANT+0.00%
RIVN-0.73%
QQQ+0.01%
FB-1.17%
ARM-0.05%
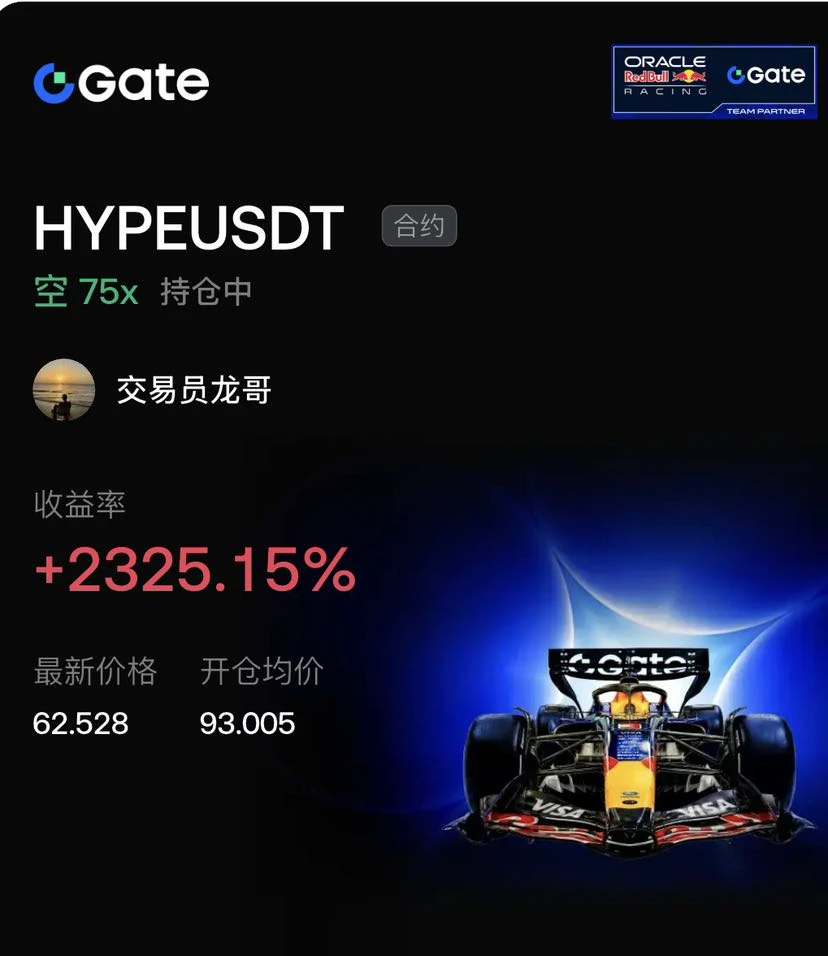
I originally planned to turn in early tonight, but while casually checking the market, I saw $HYPE surge to 93. The bulls were way too aggressive, with a severe price-volume divergence, so I went straight back to my computer and opened a large short position at 75x!

At 75x, there’s almost no room for error. A wick nearly liquidated me in an instant, but thanks to my ironclad rule of keeping the stop-loss pinned at breakeven, I held the position and captured the full 2325% return.

Now HYPE has plunged to around 62.5, and the daily chart shows a clear bearish alignment. It could rebound and s
post-image
HYPE+0.33%
BTC-0.65%
ETH-1.23%
$BTC Market dominance is stuck at 58.7%, unchanged, while the total crypto market shrank 2.96% over 24 hours, falling to $2.08 trillion. The broader market is trending downward, and capital is not pouring into altcoins on a large scale.
Looking at the leading sectors right now side by side: wrapped assets, new token standards, memes on new public chains, the Wojak concept, and TimeFi. Apart from TimeFi, the other sectors all have fairly small market caps. They share a clear trait: short-term on-chain speculation centered on new narratives and newly launched tokens.
Is fresh capital coming in?
post-image
BTC-0.67%
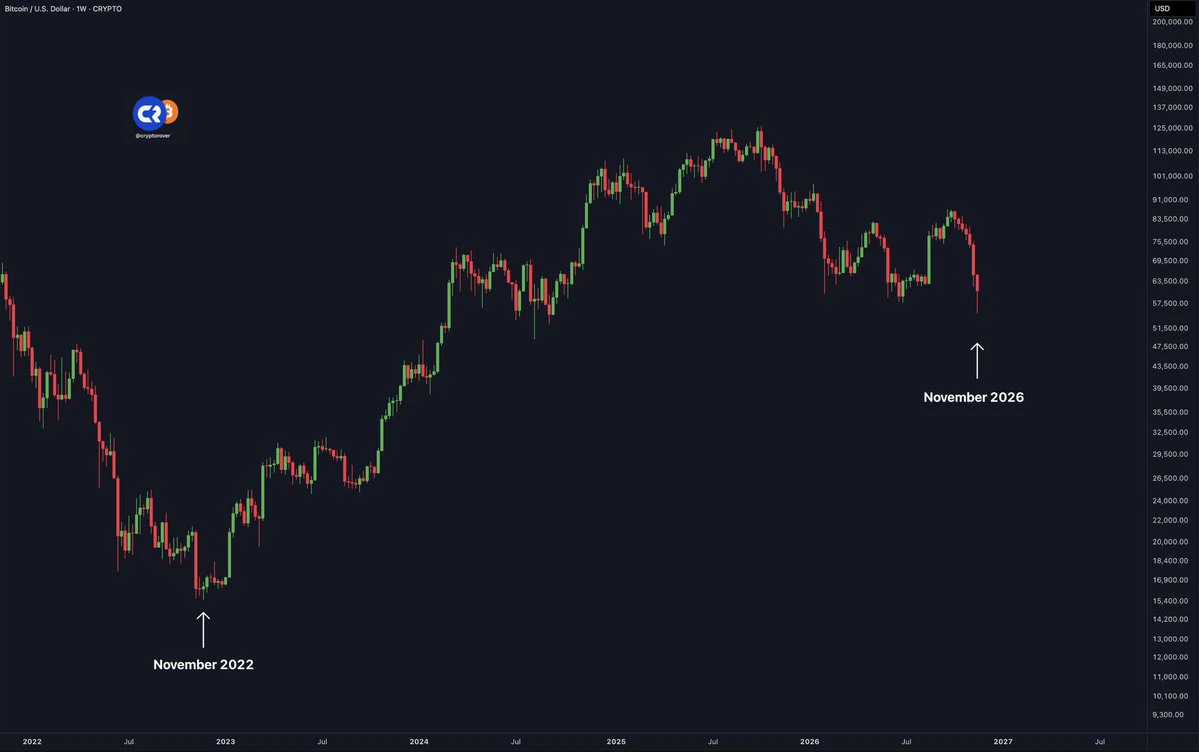
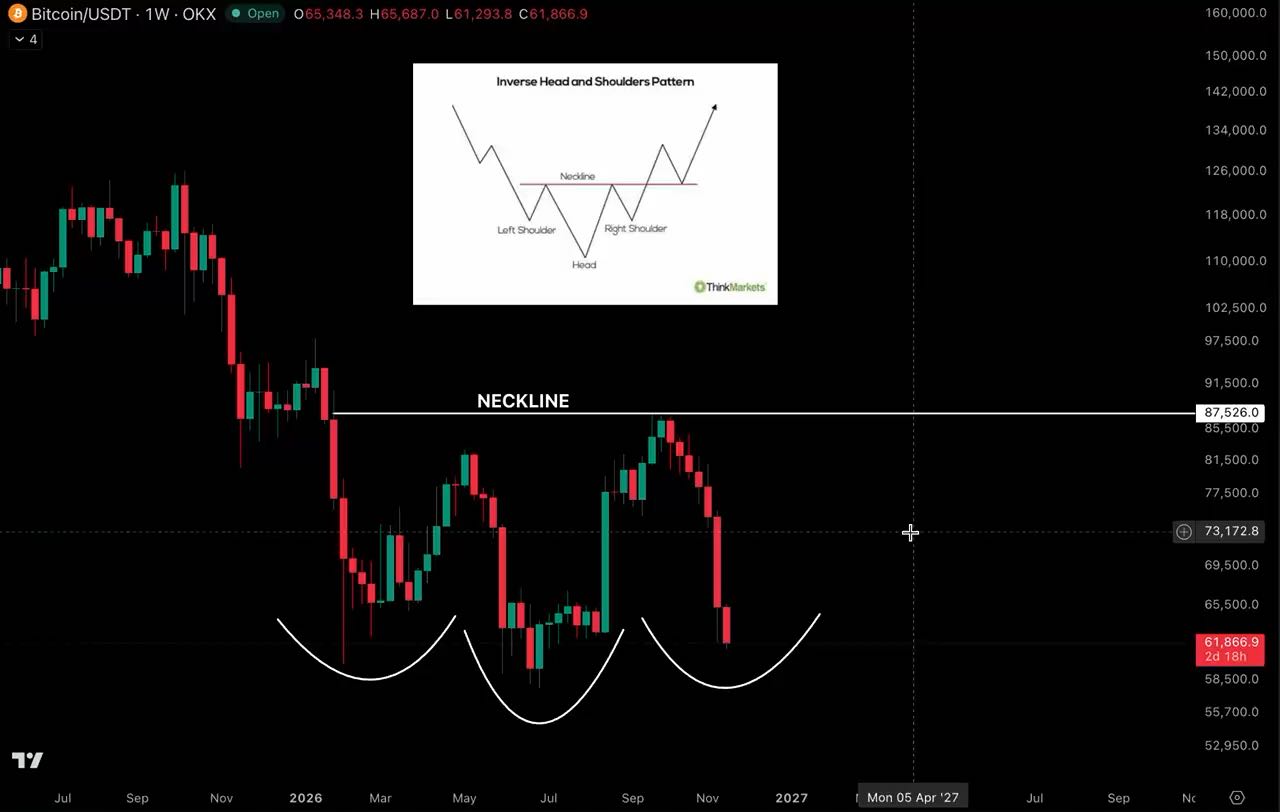
People are looking at $62K and seeing a broken market

I’m looking at the bigger picture and waiting to see whether $BTC can build a proper weekly reversal

There’s a difference between being bullish and being blindly bullish

I’m interested in the setup, let's see if bulls played well here
BTC-0.67%
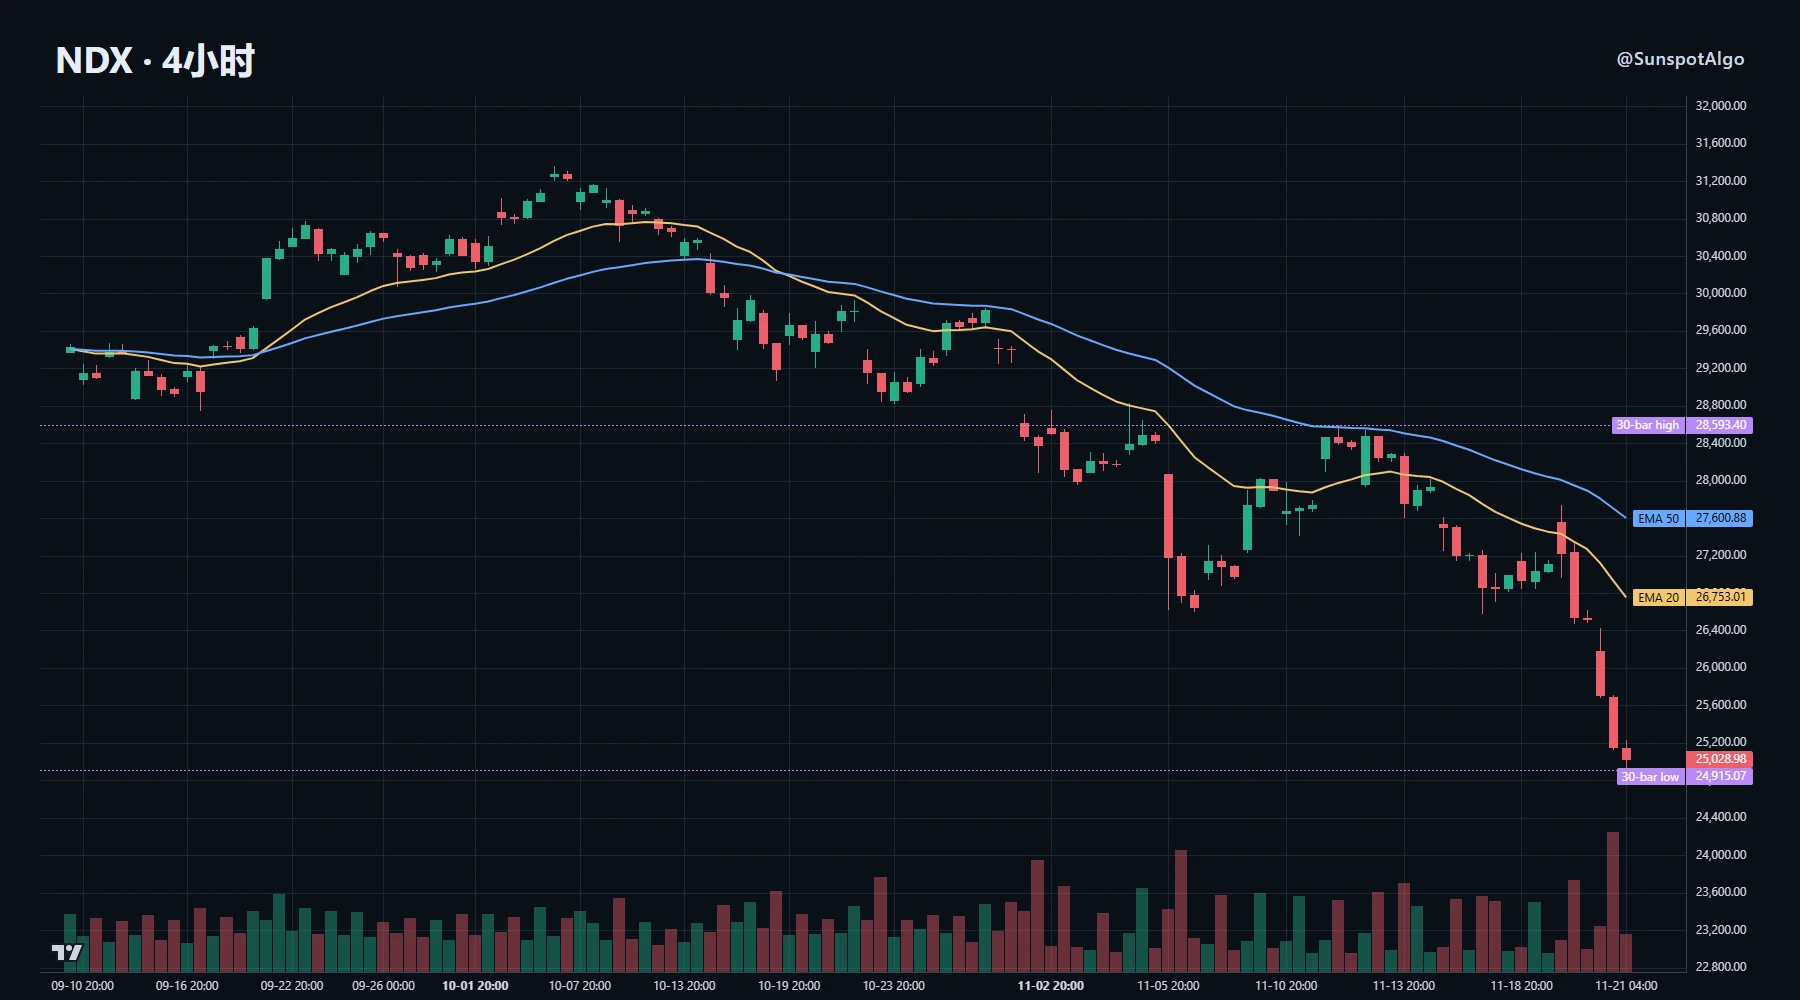
Breaking down the Nasdaq 100’s moves over the past few days, the sell-off has unfolded in stages.

First, price: around 25,000, down about 10% over five days and at the bottom 2% of its 30-day range. The daily 20-day line is at 27,700 and the 4-hour 20-day line at 26,800; price is hugging the lower end of the range. Second, volatility: the volume ratio is 1.58, and ATR as a share of price is near the 88th percentile, indicating elevated volatility expansion. There have been no long-wick stop hunts; selling pressure has been sustained. Third, where capital is going: the 10-year U.S. Treasury yi
post-image
#PCEAndGDPDataNextWeek
PCE + GDP: November 25 Could Change the Direction of BTC, Tech Stocks and Gold

Guys, there is something important coming up this week that I don't think the market can afford to ignore.
Bitcoin is trying to recover, technology stocks are dealing with serious selling pressure, and gold is also facing an important macroeconomic test.
Now, two major US economic releases are arriving on the same day, and their combination could change market expectations for December.
I'm talking about October PCE inflation and the second estimate of Q3 US GDP, both scheduled for November
NVDA-13.84%
ANT-8.68%
MU-13.88%
📊 Altcoin Market Update

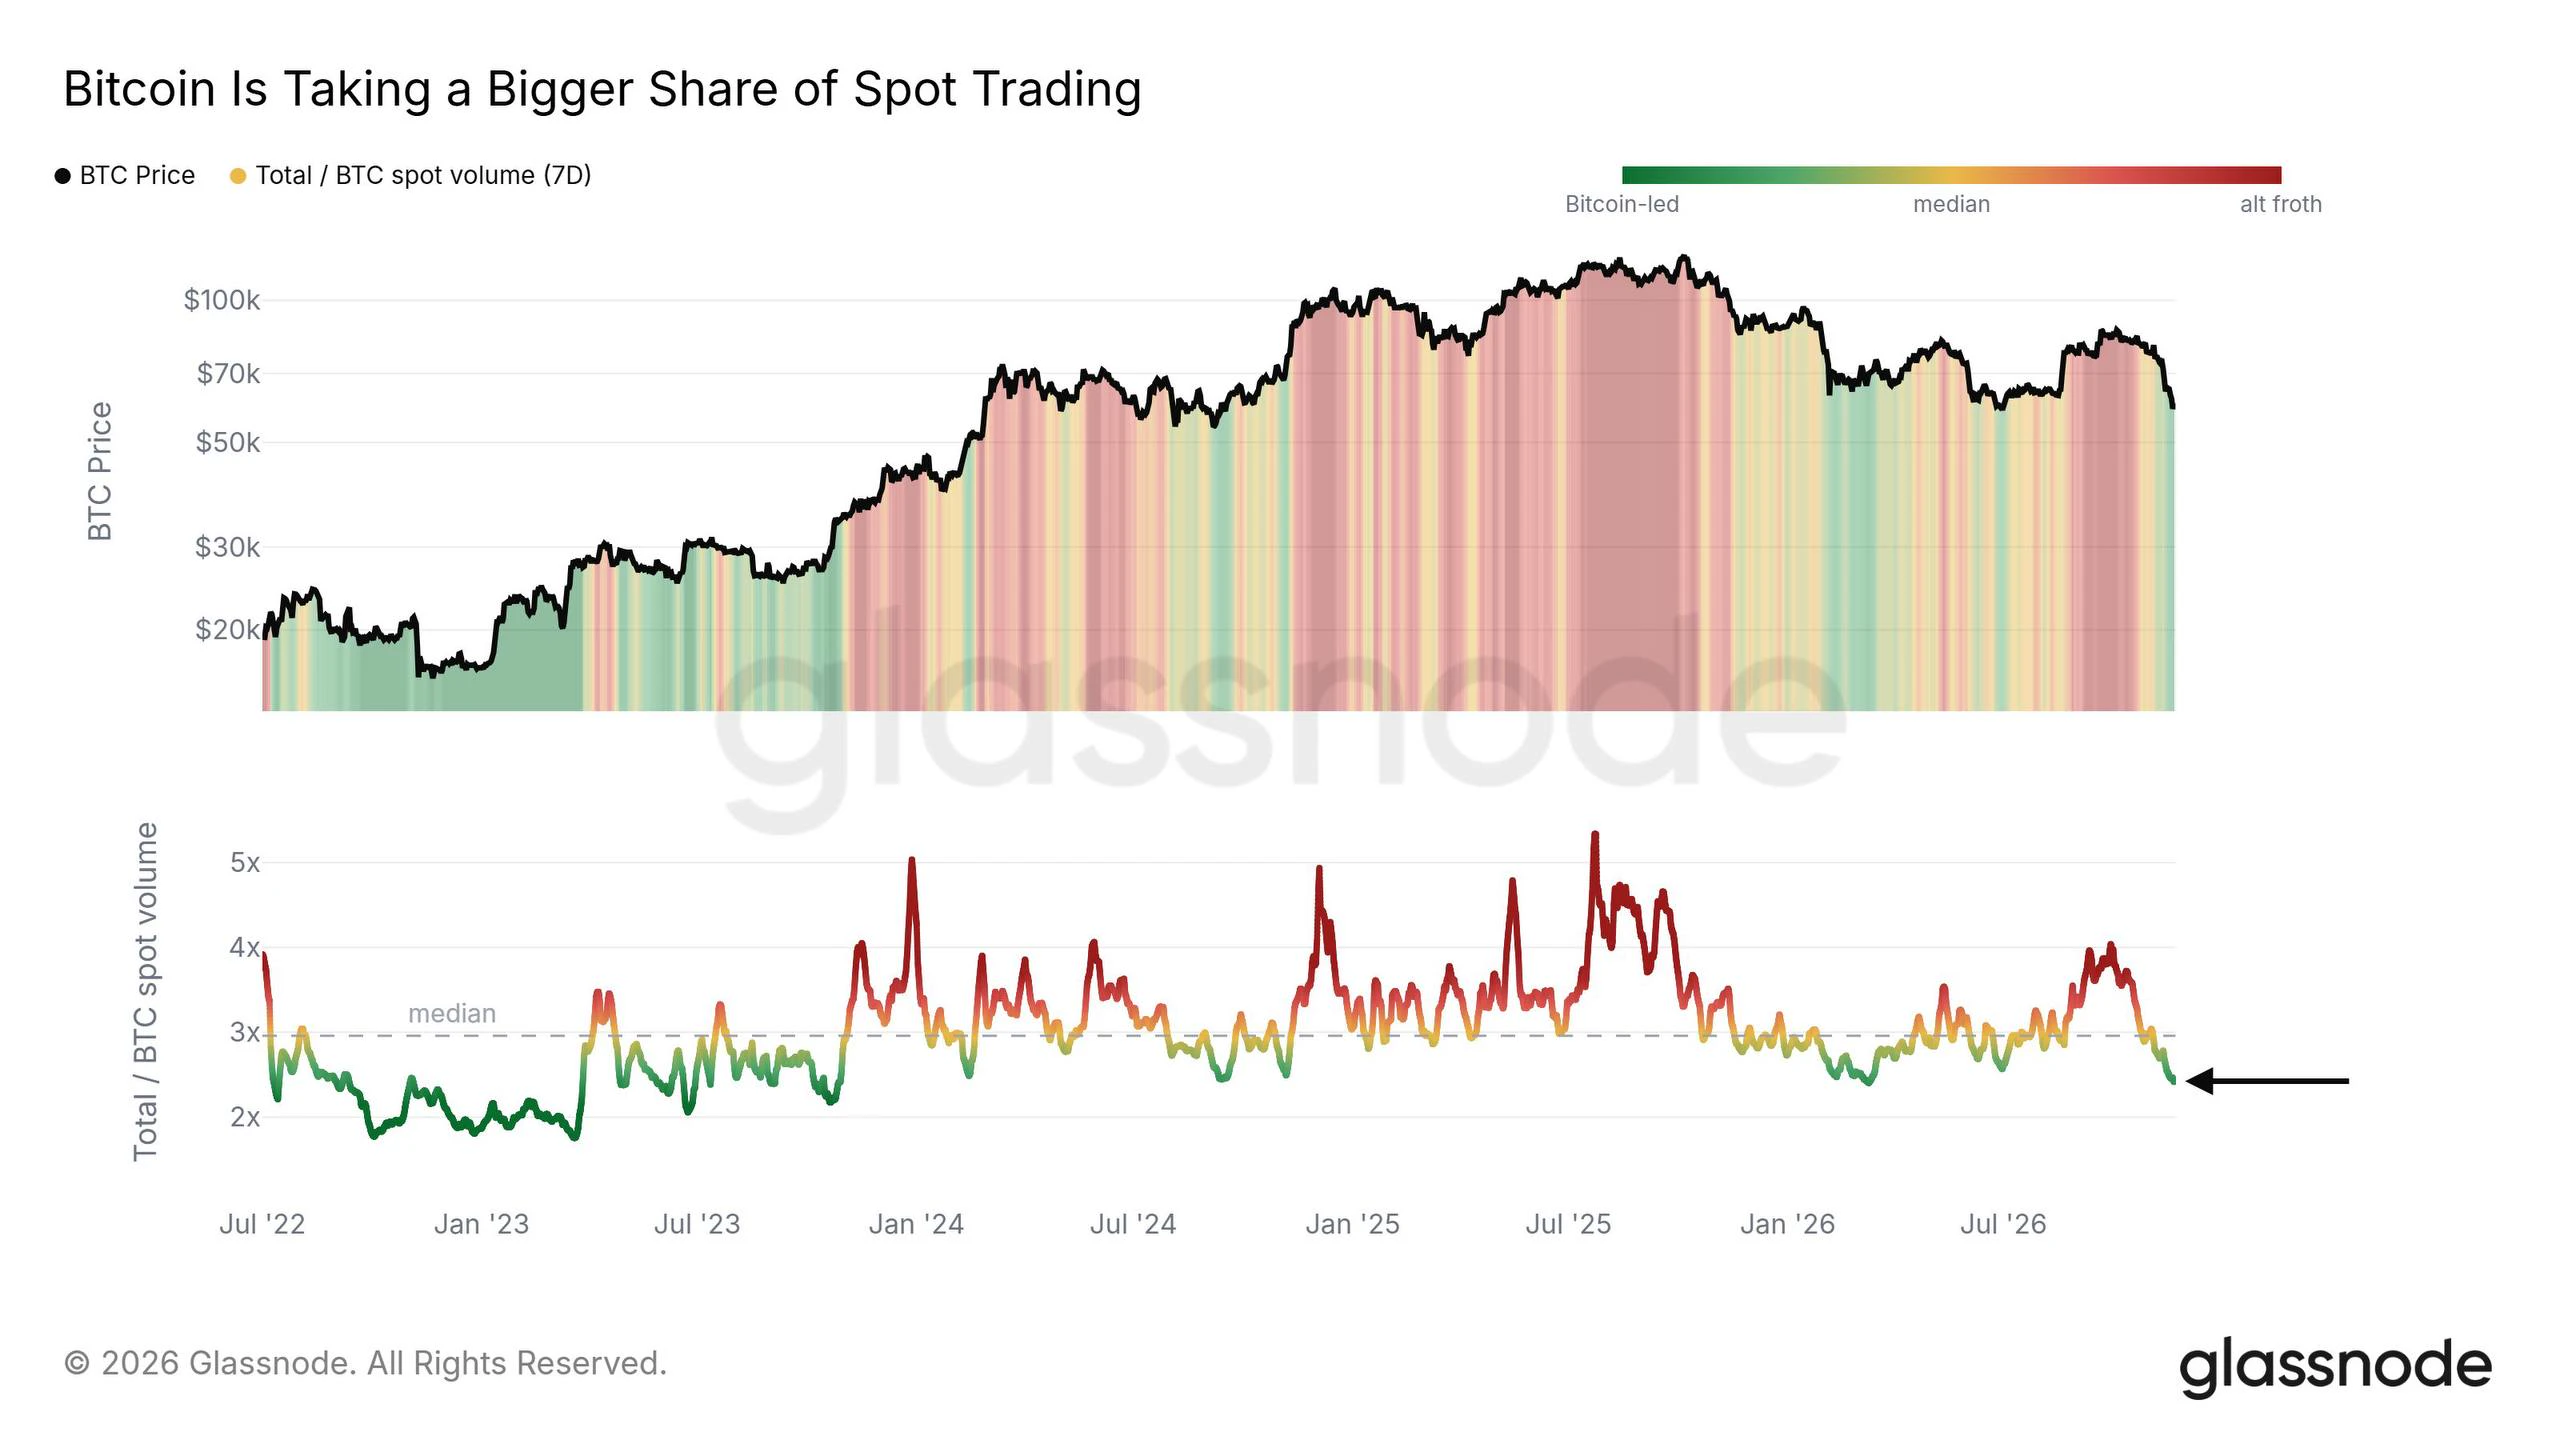
The altcoin froth has largely disappeared.

In late September, total altcoin spot volume was 4x Bitcoin’s volume. Today, that ratio has fallen below even the summer lows.

This shows how capital is rotating with market sentiment:

🔹 Risk-off: Capital consolidates into BTC. 🔹 Risk-on: Capital flows back into higher-risk altcoins.

For now, the market is showing a clear preference for Bitcoin over altcoins.
$BTC ‌#BTCReboundFaces60KTest #GateAnnualGala #ShareWeekly
post-image
BTC-0.67%
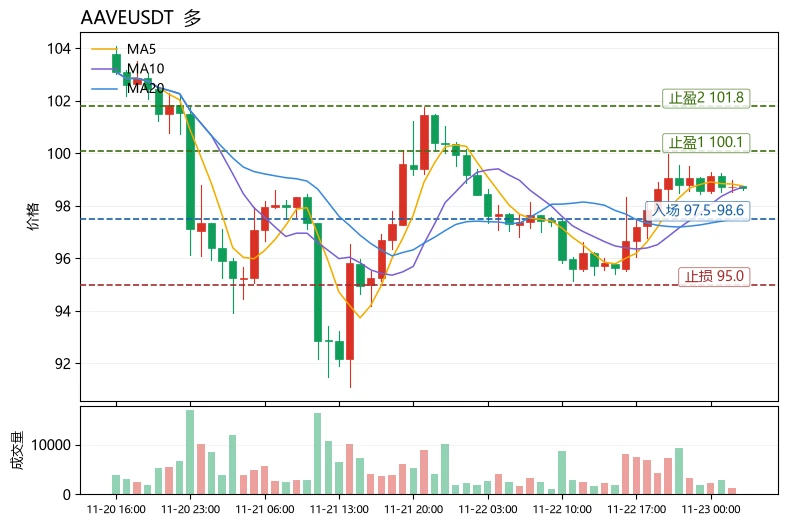
$AAVE Bottom line: Short-term outlook is bullish, but this is a countertrend long in an extremely fearful environment. Position size must be kept below half the usual size, and the stop-loss is non-negotiable.

Volatility and structure: The 30-candle range is 6.46%, indicating low-to-moderate volatility, but the Fear & Greed Index is only 11, placing market sentiment in extreme pessimism. AAVE is currently at 98.64, with MA5=98.756 above MA20=97.5325. The MACD histogram at +0.198 remains bullish, RSI=55 is neutral to strong, and price is near the upper Bollinger Band at 100.139. The funding ra
post-image
AAVE-1.17%
PROM+0.45%
PUMP-1.06%
Between 0.0187 and 0.0118, $BLESS swung back and forth within a 0.46 range that day. Most people see a 35% gain and assume funds are rushing to buy, with the consensus summed up in one sentence: a volume-backed rally means more upside ahead. That judgment isn’t wrong; that’s indeed how things have played out many times before.
But this time is a little different. The 339.3M in trading volume corresponded to a range of nearly 60% from low to high, rather than a one-way push upward. In other words, most of that volume was turnover, not aggressive buying. People who have spent time in primary ma
BLESS-2.00%
  • 1
  • 1
$BLESS Up 29.7% over the past 24 hours, contract trading volume reached 331.35 million USDT, and the current price is 0.016581, with 11.3% upside remaining to the 24-hour high of 0.018687. For bulls to open up a new leg higher, they must first reclaim 0.018687; 0.011809 below is a key support level to watch closely. On the 1-hour chart, the price is trading above the 21 EMA, with the RSI near 61, so short-term momentum remains intact. However, there is currently no clear entry setup, so it is best to wait for a confirmed candlestick pattern before acting. Can buyers push the price to new highs
post-image
EVAA-0.49%
BULLA+10.92%
MU rejected the 24-hour high like shaking off a bad date; short on the pullback to MA99 support. The short on $MU has been initiated. Entry range: 618.69 - 621.78Take profit 1: 590.07Take profit 2: 565.94Risk level: 640.43Try this trade here. Follow $BULLA and $BTC today.
post-image
BULLA+10.92%
BTC-0.67%
I ben saying this
Your coins are going to go wayyy lower than u anticipate
U ate going to become depressed
Most of u will hold rug coins to zero hoping they will recover, they will not
No one here understands liquidity, market dynamics, herd psychology or supply:demand
$BTC
post-image
BTC-0.67%
Load More

Join 40 M users in our growing community

⚡️ Join 40 M users in the crypto craze discussion

💬 Engage with your favorite top creators

👍 See what interests you

Trending Topics

BTCReboundFaces60KTest

2.2M Views30.1K Discussing

BTC rebounded from around $55,300 on November 21, briefly reclaiming $60,000 before pulling back to around $59,300. The $60K level is back in focus as traders assess whether the recovery can last. Is this rebound a sign of stabilization or a short-lived recovery? Would reclaiming and holding $60K be enough, or do you need confirmation from trading volume and fund flows?

PCEAndGDPDataNextWeek

261.1K Views2.6K Discussing

GateDirectIPOPhase3ANTAllocates92100Shares

859.3K Views5.1K Discussing

View More