Square
Following
Hot
News
Notifications
Profile
Share your thoughts
placeholder
Article
Bitcoin has been steadily sliding lately, and market sentiment is on edge. Expectations that the Federal Reserve may continue raising interest rates are still building, while funds continue to flow out of Bitcoin ETFs. The price has already fallen below $70k. 😱
$BTC briefly dipped to around $68,000 today, breaking through several key levels in succession. Long liquidations exceeded $1 billion, and fear is clearly intensifying. Technically, short-term support is around $65,000-$67,000. If that level doesn't hold, there may be further downside.
$ETH has also weakened, falling to around $1,900
post-image
BTC-0.67%
ETH-1.26%
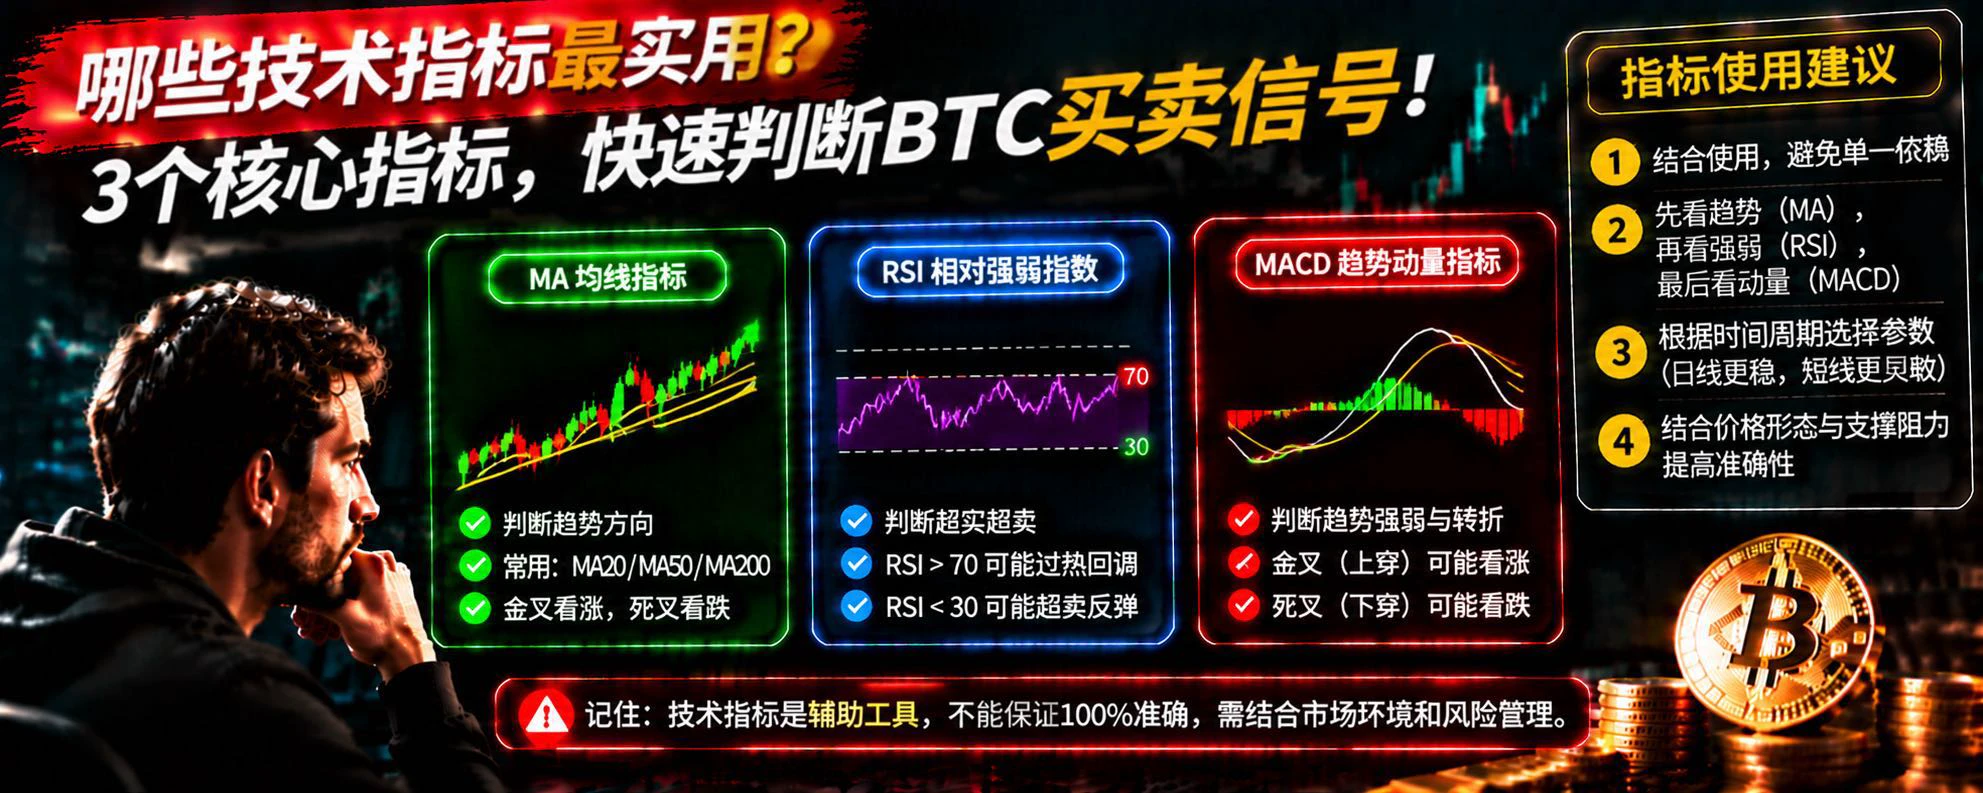
Which Technical Indicators Are Most Useful? 3 Key Indicators to Quickly Identify BTC Buy and Sell Signals

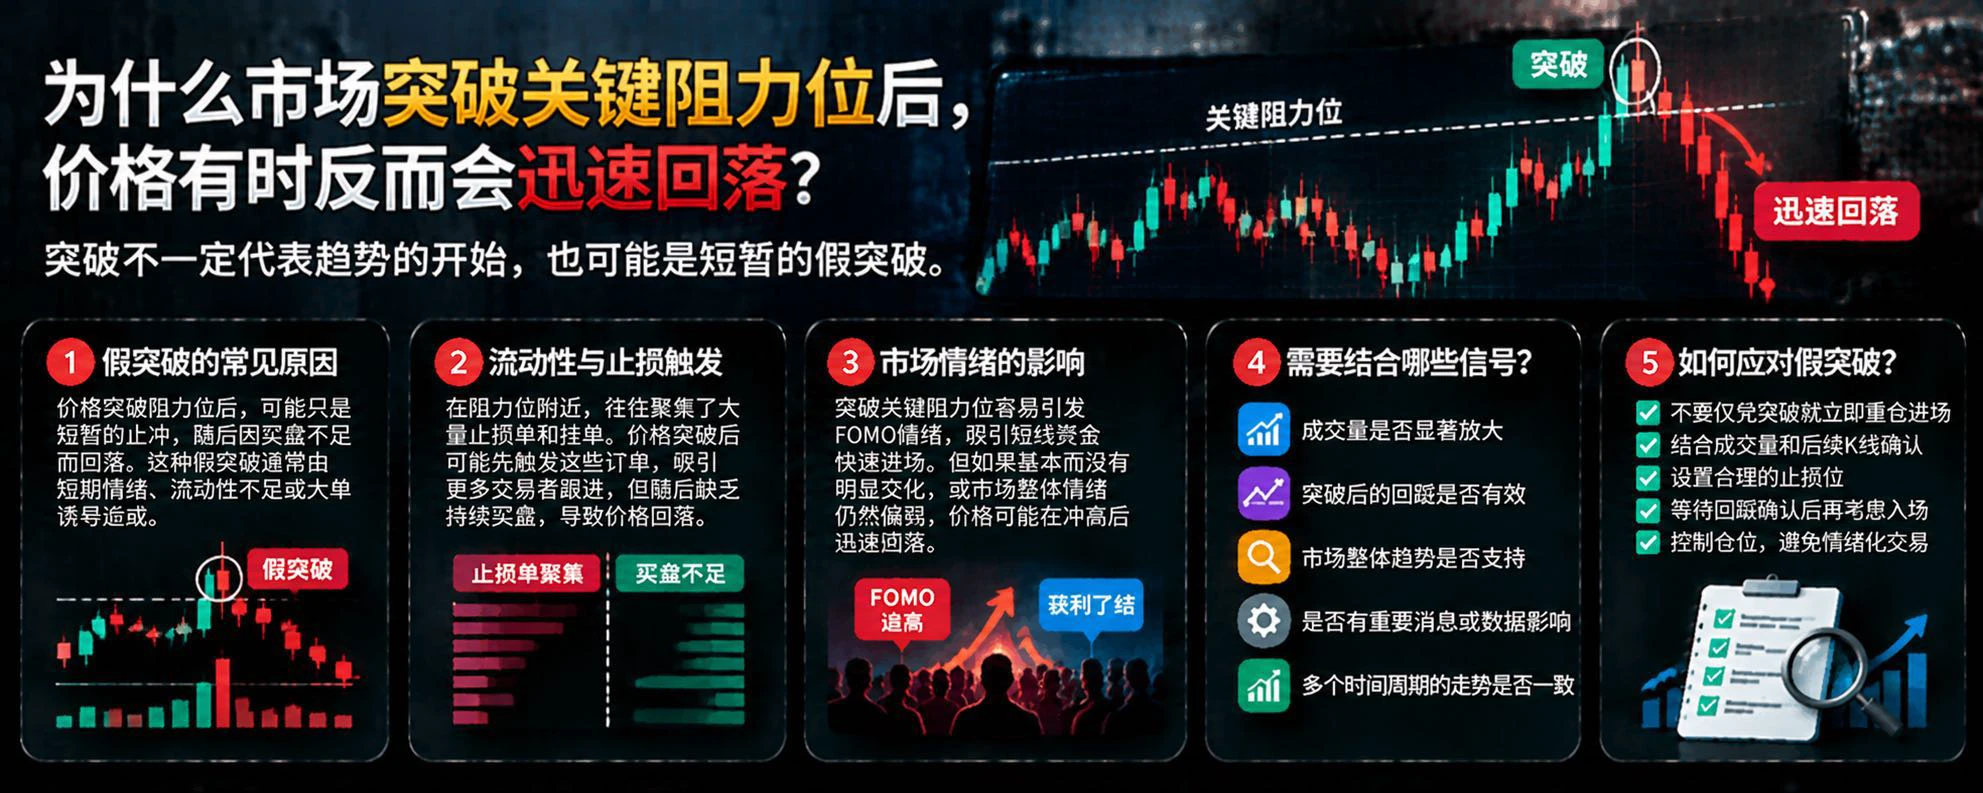
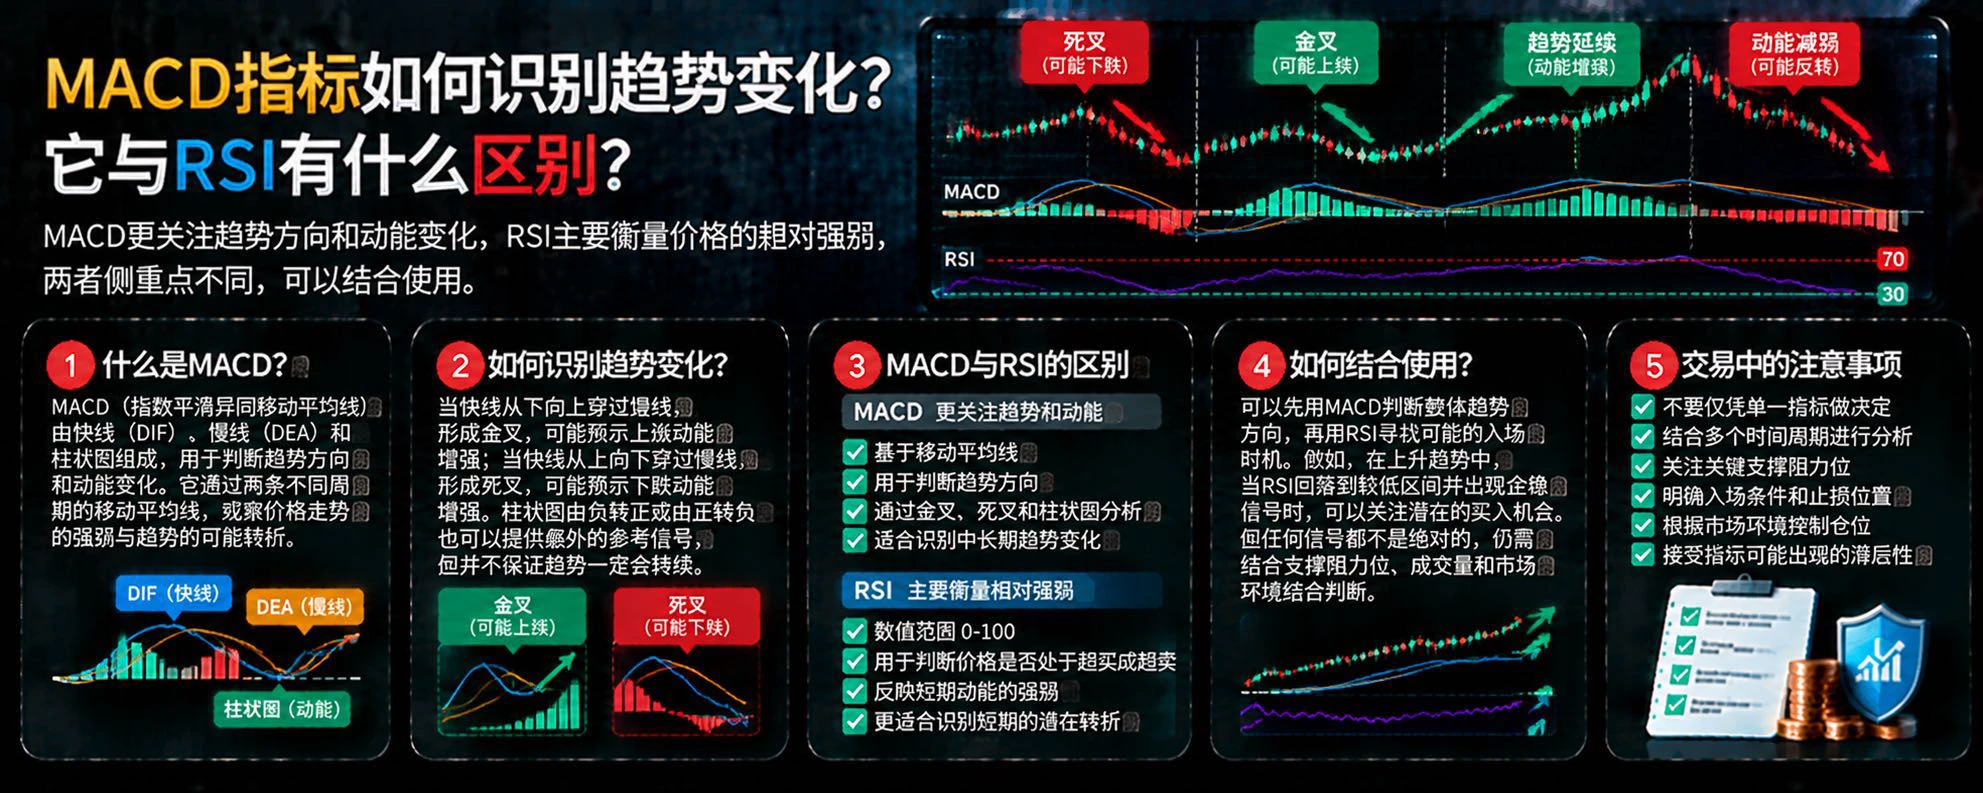
In cryptocurrency trading, many beginners like to add all kinds of technical indicators to their candlestick charts. They don’t want to miss out on RSI, MACD, moving averages, or Bollinger Bands. But do more indicators really make it easier to profit?

In fact, the most important thing in technical analysis isn’t how many indicators you use, but understanding what problem each indicator can solve.

The first is the moving average (MA). It mainly helps identify market trends. For example,
post-image
BTC-0.67%
Trenches
mihao
m
bade
b
mihao
4Cxj...pump
Market Cap
$.
Change
.
24h Vol
$.
Holders
.
AGT
A
bade
b
AGT
0x5d...e274
Market Cap
$.
Change
.
24h Vol
$.
Holders
.
FOOD
F
bade
b
FOOD
FTu5...pump
Market Cap
$.
Change
.
24h Vol
$.
Holders
.
IDOL
I
bade
b
IDOL
0x3b...ab07
Market Cap
$.
Change
.
24h Vol
$.
Holders
.
AI
A
bade
b
AI
2T56...pump
Market Cap
$.
Change
.
24h Vol
$.
Holders
.
What Is Market Depth? How Can You Tell Whether the Order Book Can Handle Your Trade Size?

In crypto trading, many people look at price and trading volume first, but overlook a metric that directly affects trade execution: market depth.

Market depth helps us understand how many buy and sell orders are available at different price levels, and how prices might change when the market faces a trade of a certain size.

First, what exactly is market depth?

In an order book, buy orders are usually placed at different price levels below the current market price, while sell orders are placed above it
post-image
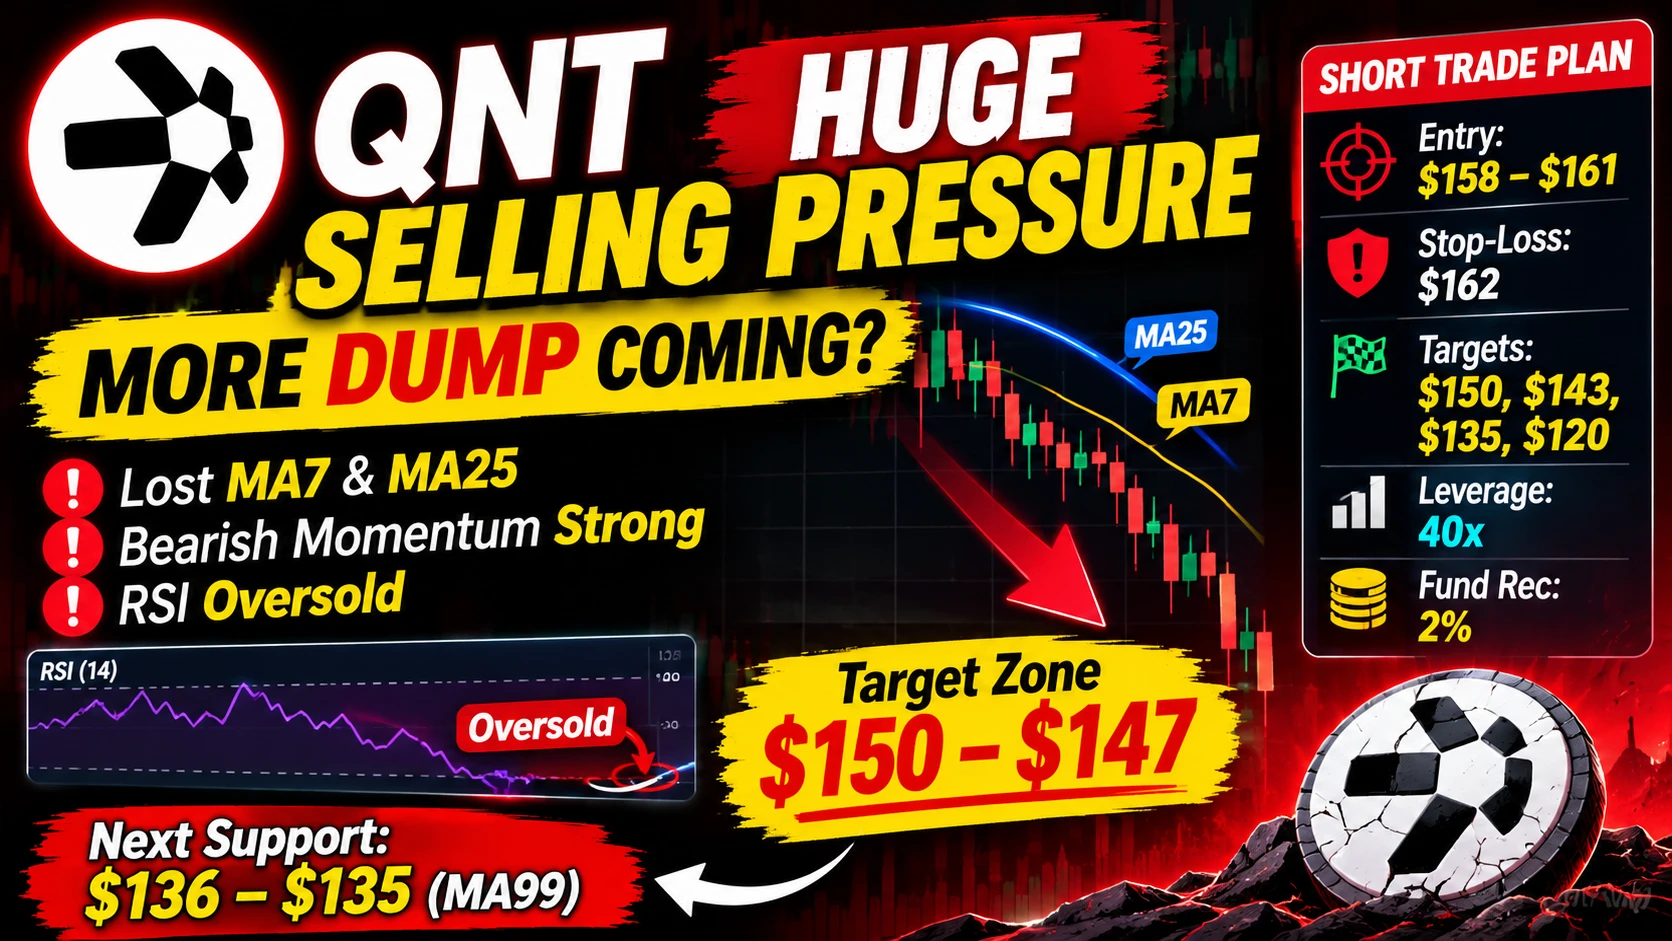
🚨 QNT: SELLERS ARE IN CONTROL, BUT IS A RELIEF BOUNCE COMING?

The interesting part of QNT's current structure is the battle between bearish momentum and oversold conditions.

Losing both MA7 and MA25 suggests buyers are struggling to regain short-term control. Bitcoin's weakness is adding further pressure, making the $150–$147 zone an important area to watch.

However, there's another side to this setup: RSI is deeply oversold. That means chasing the downside without confirmation could be risky. A relief bounce toward resistance might offer a better opportunity to evaluate a short setup.

📉
post-image
QNT+4.83%
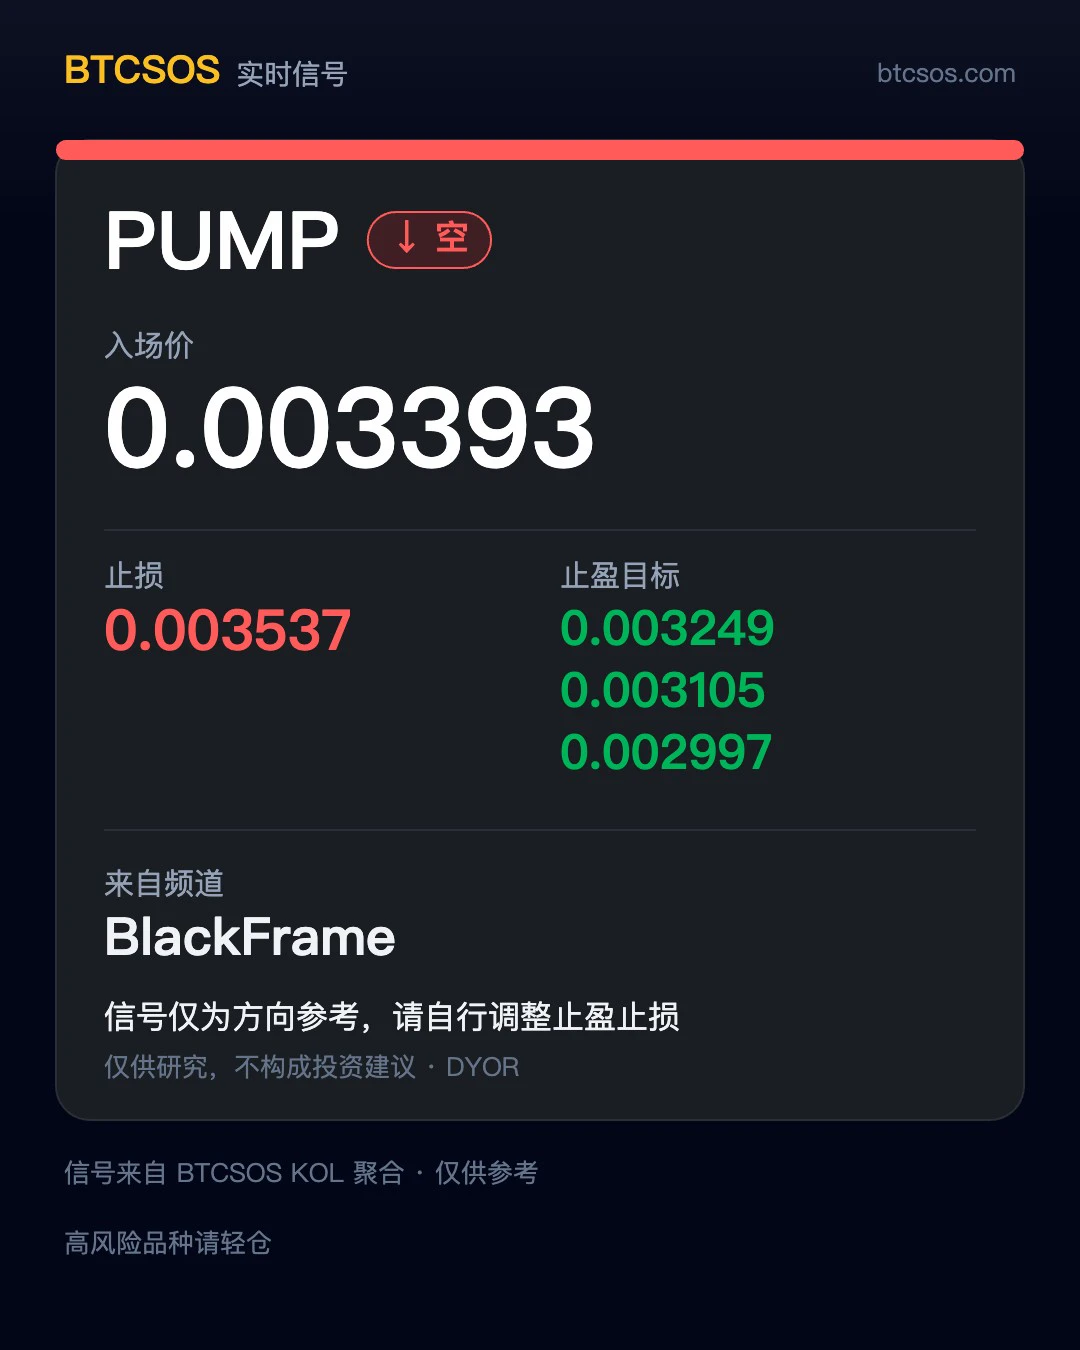
📢 Signal Card Repost | Source: BlackFrame
Asset: $PUMP Short entry: 0.003393 Stop-loss: 0.003537 Targets: 0.003249 / 0.003105 / 0.002997 Time: Not specified
Come to think of it, we reposted BlackFrame’s $RAM trade earlier today, and here it is again. Does this trader have a signal wholesale department or what? 😂
Sis is just reposting the signals as-is. Whether they work out, whether to follow them, and how much to put in are all up to you, dear followers. You can watch the market, but don’t lend out your brain. 💅
Shared for personal record-keeping; not investment advice. #NBISQ3营收同比增长571%
post-image
PUMP-0.99%
RAM+0.63%
NBIS-16.96%
What Does It Mean When Price, Trading Volume, and OI All Rise?

In crypto derivatives markets, traders often watch for a particular combination: prices rise, trading volume increases, and open interest (OI) also rises.

Some see this as a sign of a strong rally, while others worry that the market is accumulating too much leverage. How should this combination be interpreted?

The key is that these data points can provide insight into market participation, but they cannot by themselves prove that prices will continue to rise.

First, what does a rising price mean?

A rising price means that the
post-image
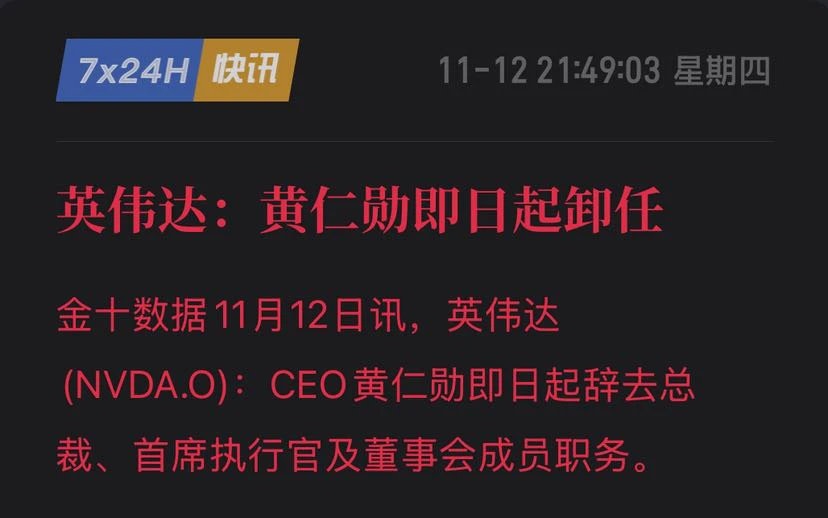
#JensenHuangResigns
#黄仁勋辞职
Jensen Huang Resigns: Is NVIDIA Facing Its Biggest Leadership Crisis, and What Comes Next for the Global AI Market?
The resignation of Jensen Huang as NVIDIA's President, CEO, and board member has sent shockwaves across the global technology and financial markets. This is not an ordinary corporate leadership change. Huang was the central figure behind NVIDIA's transformation from a graphics-processing company into one of the world's most influential artificial intelligence and semiconductor giants.
His departure raises serious questions about NVIDIA's leadership,
NVDA-4.49%
SPX500+0.19%
AMD+5.86%
AVGO+5.47%
  • 3
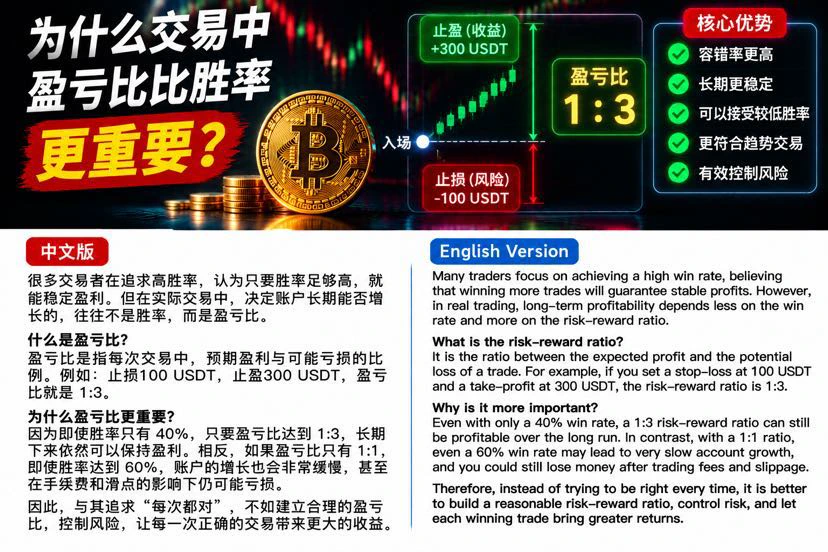
Many traders pay particular attention to their win rate when they enter the market. They hope to win 7 or 8 out of every 10 trades, and may even believe that only a high win rate can deliver consistent profits.

But in reality, what determines whether an account can grow over the long term is often not just the win rate, but also a frequently overlooked metric: the risk-reward ratio.

What is the risk-reward ratio?

Simply put, the risk-reward ratio is the proportion between the expected profit and potential loss on a trade.

For example, if a trade has a 100 USDT stop-loss and a 300 USDT take
post-image
Why Is the Liquidation Price Usually Closer to the Entry Price at Higher Leverage?

In crypto futures trading, leverage allows traders to open a larger notional position with less margin, but it also amplifies the impact of price fluctuations on account equity.

Many people know that higher leverage carries greater risk, but may not understand why: why can even a small price move put a highly leveraged position at risk of liquidation?

First, leverage changes the relationship between margin and position size.

Suppose you use 100 USDT as margin, in a simplified scenario that excludes fees and
post-image
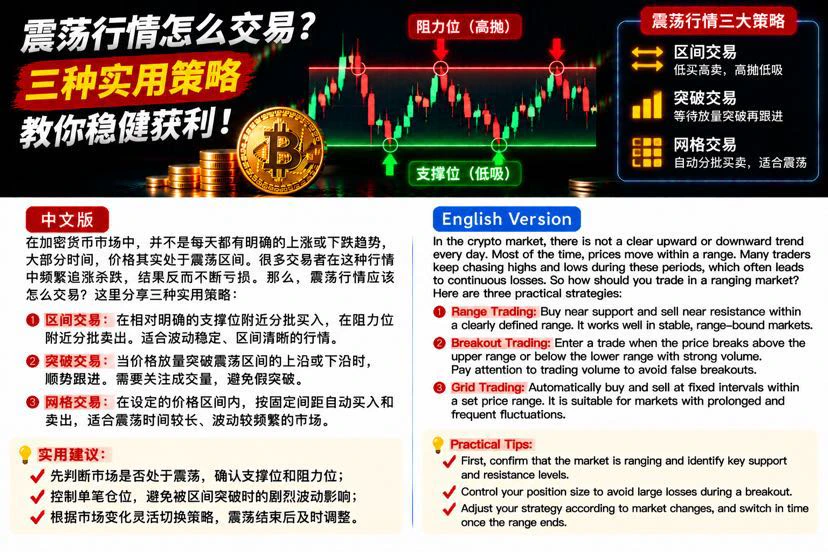
In the cryptocurrency market, there isn’t a clear upward or downward trend every day. Often, BTC fluctuates repeatedly within a price range, pulling back after rising to a certain level and bouncing after falling to a certain level. This is called a ranging market.

Many traders chase rallies and sell off in a panic in ranging markets. As a result, the market fails to move in either direction, while fees and consecutive stop-losses steadily eat away at their account balances. So, how should you trade a ranging market?

First, range trading. Look for buying opportunities near relatively clear s
post-image
BTC-0.67%
What Is the Difference Between Mark Price, Last Traded Price, and Index Price? Why Do They Affect Contract Trading?

In crypto contract trading, some people see that the last traded price has not yet reached their expected level, but their account is already showing a large unrealized loss or even nearing liquidation. Others find that the price on the candlestick chart does not exactly match the price the platform uses to calculate risk.

One important reason is that the last traded price, index price, and mark price are not the same thing.

First, the last traded price: the price of the marke
post-image
market prices updates
live-cover
LIVE78
🚀 Anthropic (ANT) launches with a bang, Gate Direct IPO Phase 3 officially opens

AI giant Anthropic (ANT) has opened USDT subscription registration, with a minimum participation amount of 100 USDT.

🔥 Highlights of this subscription
▪️ Reference price: $70–78/share
▪️ Subscription amount: 100–3,000,000 USDT
▪️ Upon successful allocation, shares will be delivered directly to your Gate stock account, with no lock-up period

📅 Subscription period: November 12, 11:00 – November 17, 17:00 (UTC+8)

🤖 From Claude to enterprise-grade AI applications, which aspect of Anthropic's growth potential a
  • 2
The entire market is down today, and the hardest-hit major coin is $ZEC . I’m bearish on its futures.
It plunged from 997 to 879 today, dropping nearly 12% intraday. The entire market saw $1.47 billion in liquidations over 24 hours, 90% of them from longs, and the Fear and Greed Index has reached extreme fear at 20. After hitting a low of 879 at 1 p.m., it bounced straight back to 955 in a single hourly candle at 2 p.m., looking like it might turn around. But after 3 p.m., three hourly candles at 959, 952, and 951 kept getting lower, and it failed to break above 960 all three times. The rebound
ZEC+1.29%
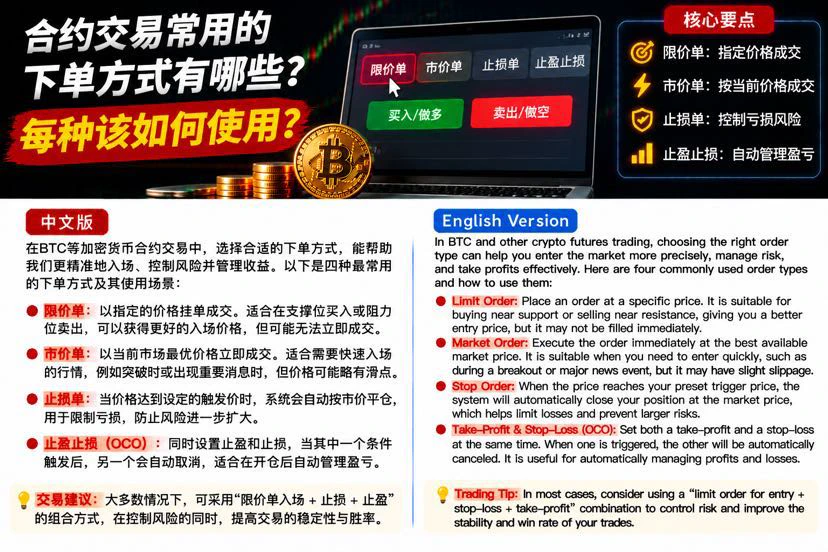
In crypto futures trading, many people spend every day analyzing whether BTC will rise or fall, but overlook a very important question: Do you really understand the different order types on trading platforms?

Sometimes, even if you correctly predict the market, an unsuitable order method can lead to an unfavorable entry price or even unnecessary losses.

First, limit orders. You can set a buy or sell price in advance and wait for the market to reach that price before the order is filled. They are suitable for looking for buying opportunities near support or planning to sell near resistance. T
post-image
BTC-0.65%
$HANA BOOM🤑🤑 The market is starting to surge strongly. TP1 has been filled. Guys, quickly check whether the funds have arrived!🙈💸$AKE $DODOX
post-image
DODOX
DODOXDODOX
Pump.Fun
MC:$3.17KHolders:86
6.67%
HANA-3.22%
AKE+6.07%
Why Can the Order Book Look Deep, Yet Liquidity Suddenly Disappear When You Place an Order?

In crypto markets, you may sometimes see a large number of buy orders stacked in the order book and assume there is ample support below. But when prices start falling rapidly, these buy orders can quickly dwindle, and a market that seemed stable can suddenly become fragile.

Why does this happen?

First, orders can be canceled at any time.

The order book shows currently visible limit orders, not completed trades. Traders can modify or cancel orders as the market changes. So large orders only indicate
post-image
Jensen Huang has really resigned, and this time it’s officially confirmed

Nvidia announced that Jensen Huang has resigned as CEO, president, and director, effective immediately, with CFO Colette Kress temporarily taking over

Honestly, the impact on $NVDA could be more complicated than a bad earnings report; NVDA contracts briefly plunged to around 149 last night, then recovered to around 166, and the market is clearly still digesting the news

I’ve always felt that part of Nvidia’s valuation comes from the personal premium attached to Jensen Huang:

From its technology roadmap and customer
post-image
NVDA-0.35%
  • 3
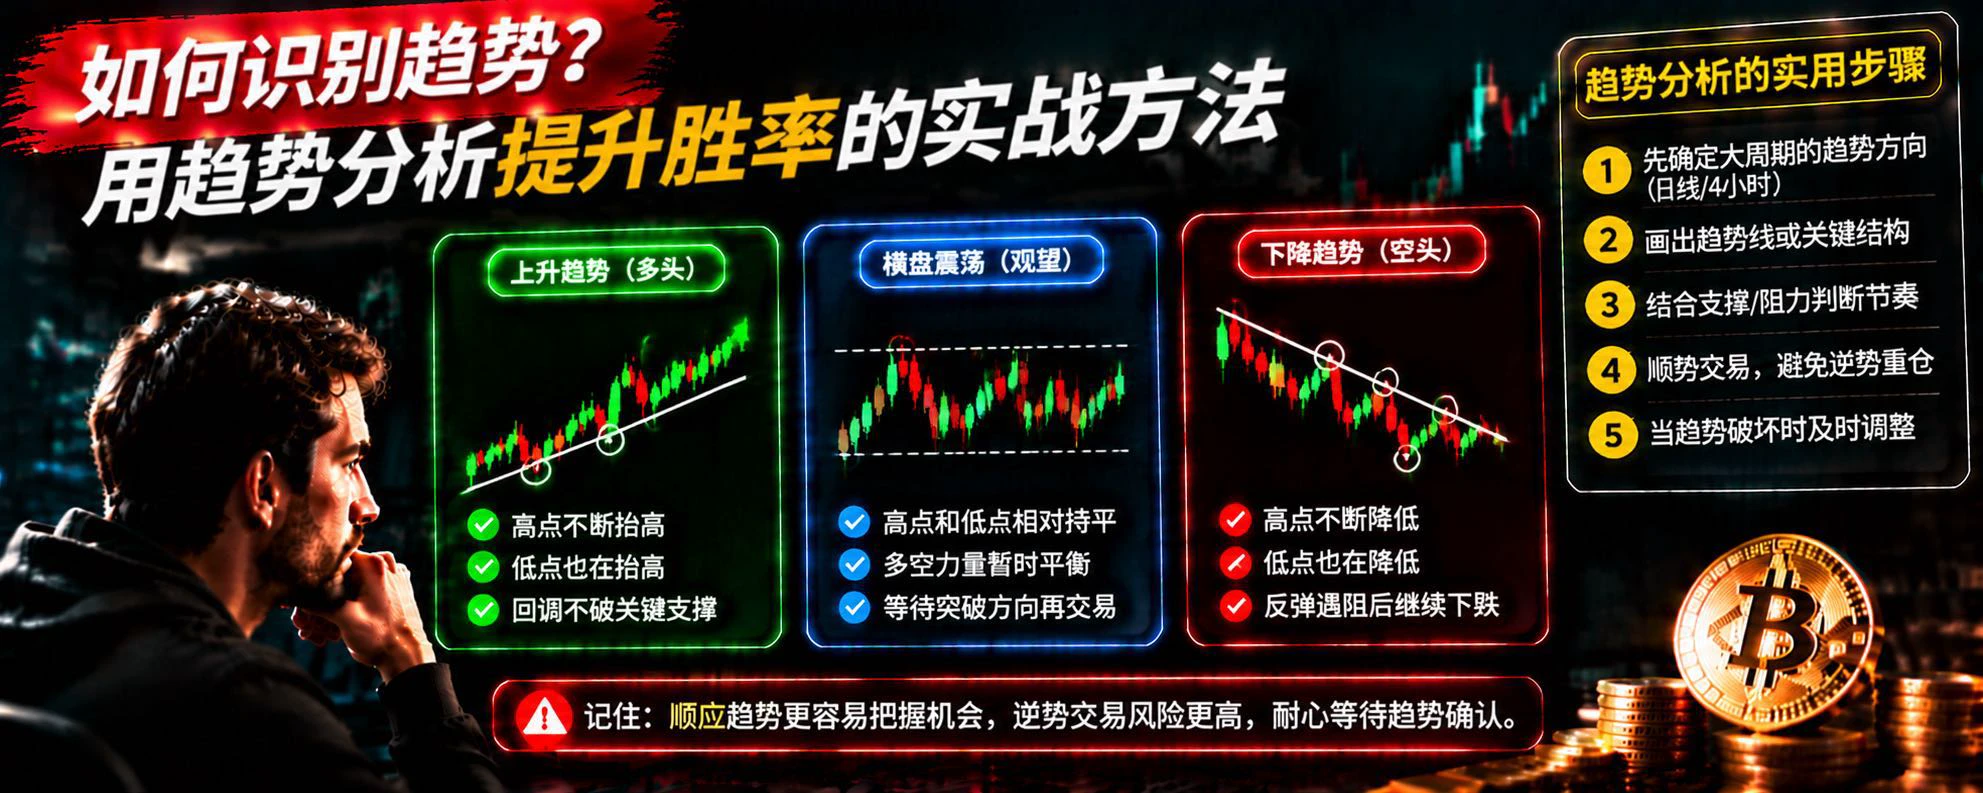
How to Identify Market Trends? Improve Your BTC Trading Win Rate with Trend Analysis

In cryptocurrency trading, many people look for the best entry and exit points every day, but overlook a more fundamental question: What trend is the market currently in?

If you haven't clearly identified the market's direction, even using more technical indicators may still lead to repeated bad decisions.

First, learn to identify the three basic market conditions.

First, an uptrend. Prices continue to form higher highs and higher lows, indicating that buyers have the upper hand. In this situation, focus o
post-image
BTC-0.67%
Load More

Join 40 M users in our growing community

⚡️ Join 40 M users in the crypto craze discussion

💬 Engage with your favorite top creators

👍 See what interests you

Trending Topics

JensenHuangResigns

516.7K Views8.1K Discussing

Jensen Huang has resigned as NVIDIA CEO and stepped down from the board. CFO Colette Kress will serve as interim CEO while NVIDIA considers internal and external successors. $NVDA fell more than 10% in premarket trading following the announcement. With one of AI’s most influential leaders stepping aside, markets are now reassessing NVIDIA’s leadership stability, AI strategy, and long-term valuation.

GateIPOAccessAnthropic

280.8K Views2.6K Discussing

Dr.HanOxfordUnionSpeech

144.6K Views456 Discussing

View More