Share your thoughts
placeholder
Article
#GateRWAPerpetualsOIRanked 1Globally
Gate is not just riding the RWA wave — it is building the trading infrastructure.
The market is correcting, sentiment is getting tested, and weak hands are getting shaken out.
But look closely at where the real trading activity is showing up.
Gate recorded a massive $20.65B weekly trading volume on August 17, roughly 7.3× its June weekly average. What makes this even more interesting is that this record arrived during a major market correction — exactly when traders become more selective and liquidity matters most. �
CoinMarketCap
And then comes the RWA de
  • 1
The profit is thin, but it grew on its own—I didn’t touch it.
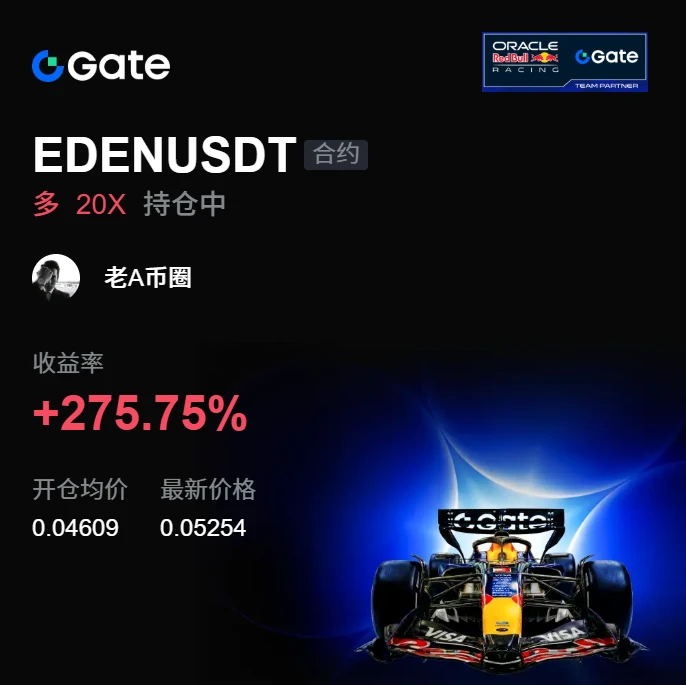
One last look before bed: $EDEN is still bottoming, but it just won’t break down. I’ve seen this kind of price action too many times—it looks weak, but is actually accumulating. I called a long entry at 0.04609; it’s now at 0.05255, with +275.75% already secured.
This move was basically picked up along the way. Take profit on 80% first, and put the protection level for the remaining 20% above the entry price. Hold if it keeps pushing, but if it dares to come back, don’t let the profits turn into pain.
Being out of a position isn’t a
post-image
EDEN-5.00%
SNDK-2.63%
LAB-2.16%
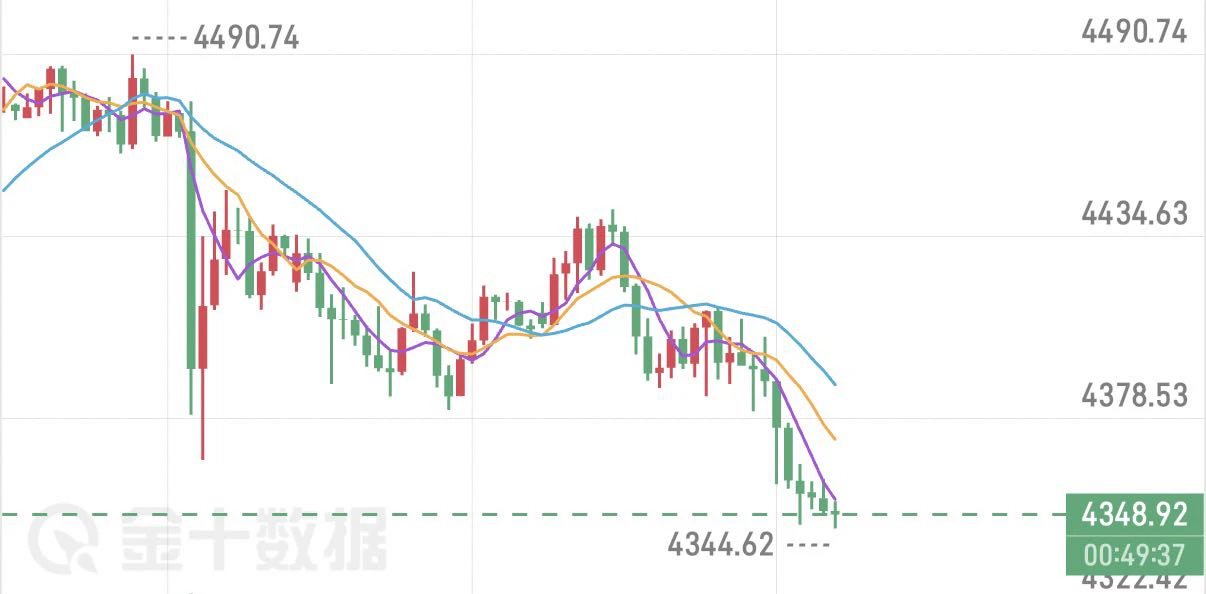
Gold is currently fluctuating around the 4350 level.
In the short term, watch the 4410–4420 resistance zone; as long as it fails to stabilize above this resistance, consider selling on rebounds.
Below, monitor the 4320–4280 support zone; if this support holds, consider buying on pullbacks.$XAU
post-image
XAU-1.49%
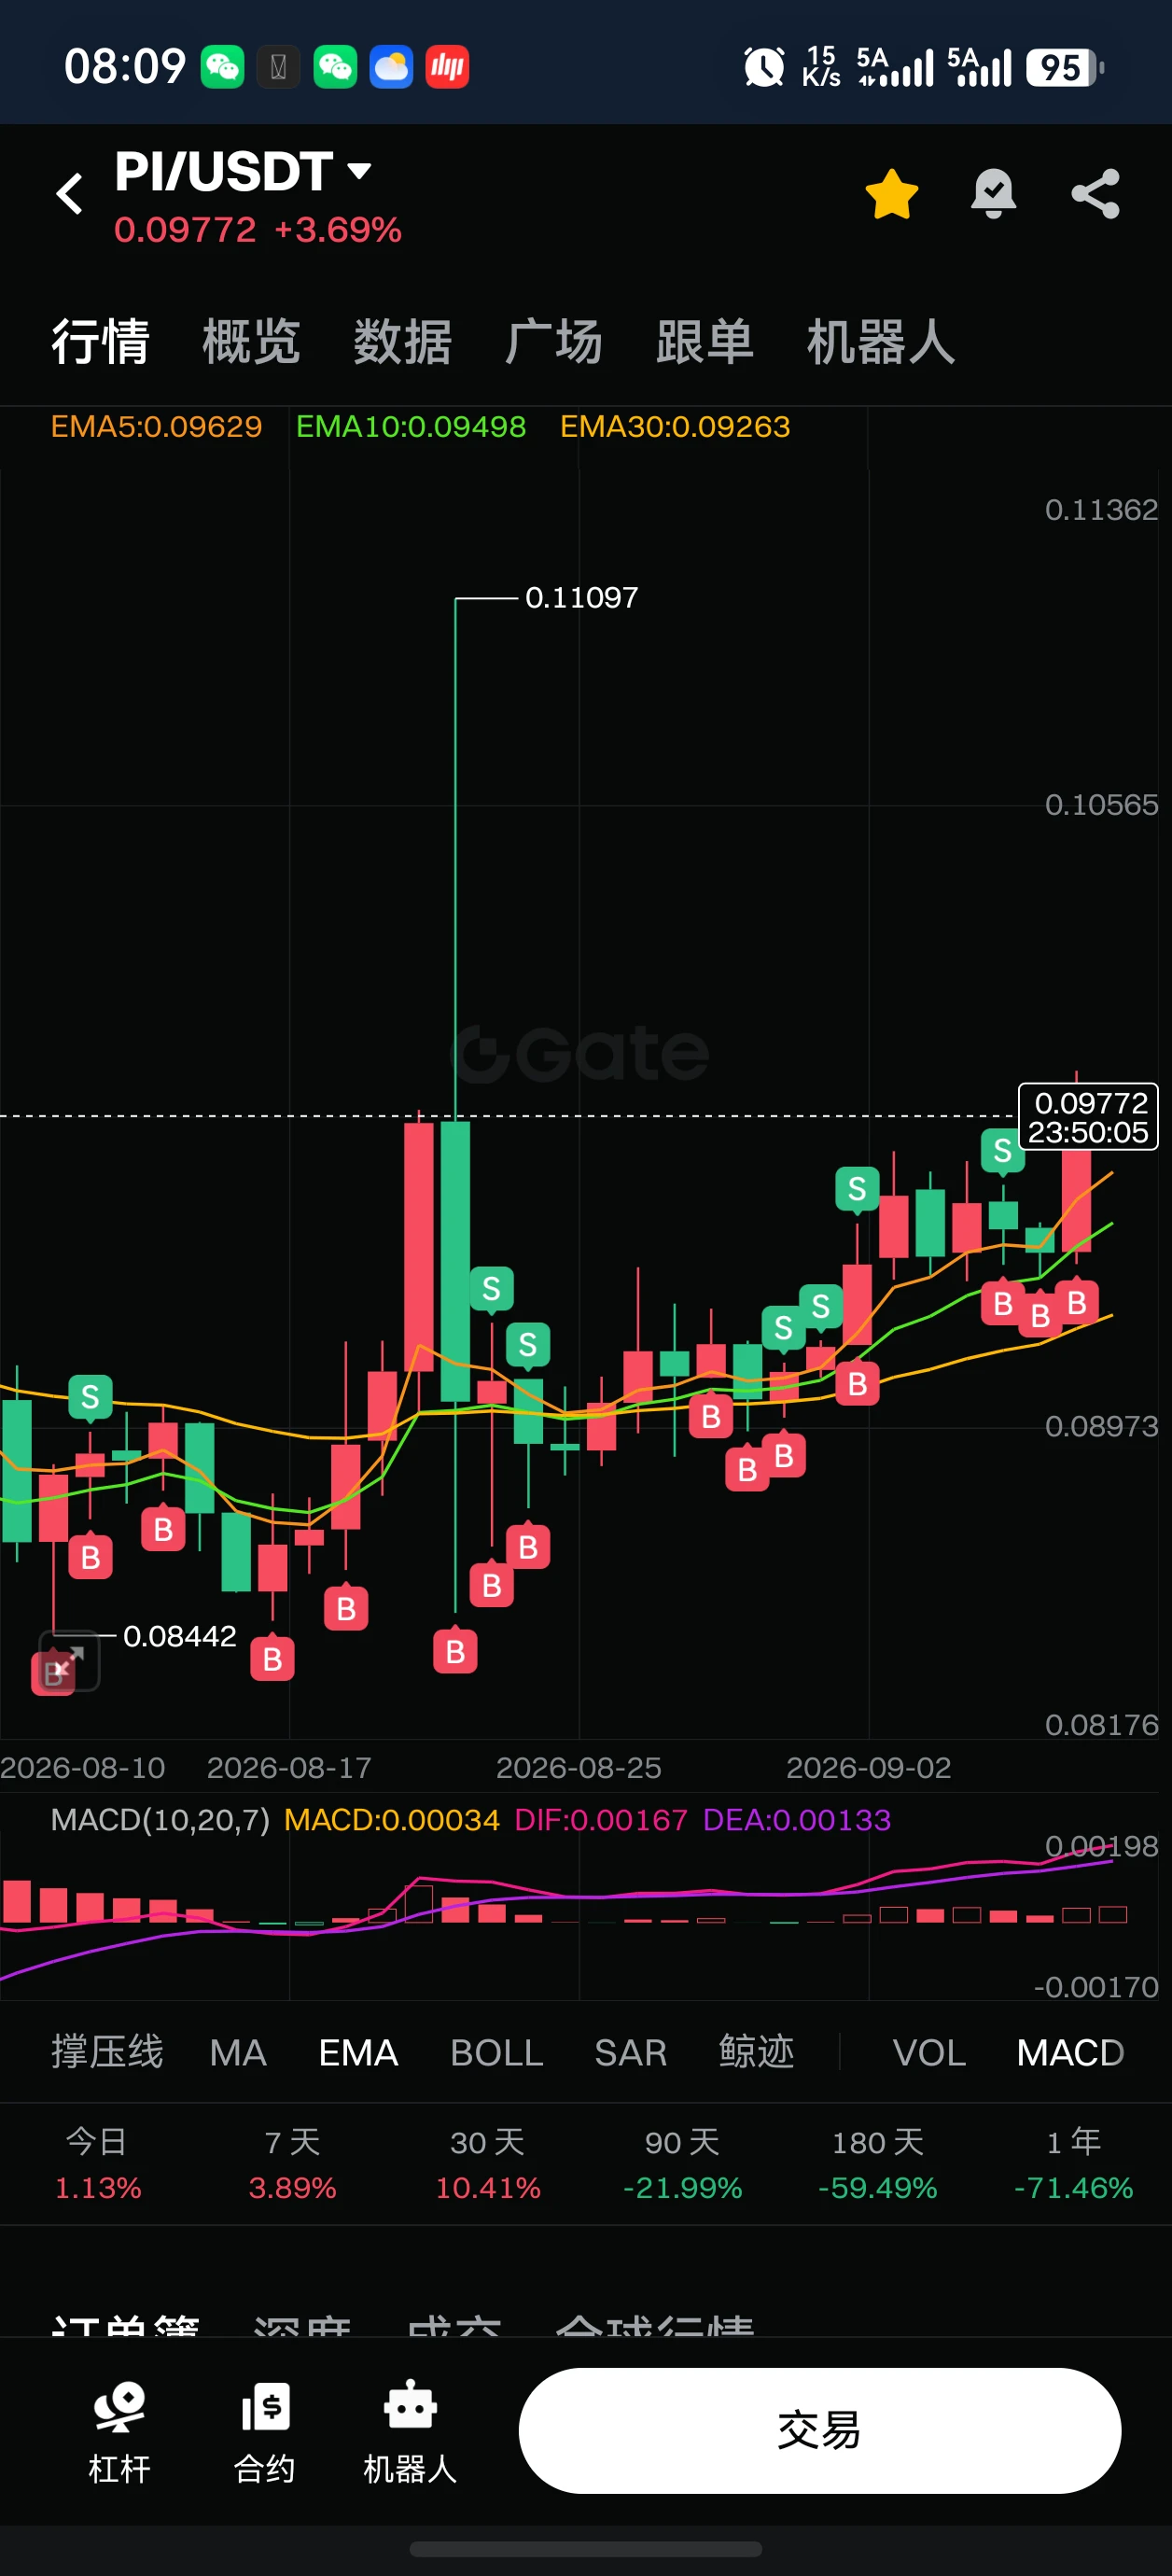
#PI Thinking of buying after the 15th, estimated to be above 1U
post-image
PI+5.45%
  • 3
JUST IN: Crypto-linked stock BNC surged 50.43% to $5.25 on one-day, on-chain stock market trends driving rally. $BNC
post-image
BNC+1.59%
I’ve been on Zhima for over a month, so I’m checking out what’s going on 😁 Interested bros can follow along.
Why is everyone suddenly selling XRP at 1.42 when the daily trend says range?

$XRP /USDT - SHORT

Trade Plan:
Entry: 1.4162 – 1.4226
SL: 1.4506
TP1: 1.3960
TP2: 1.3804
TP3: 1.3570

Why this setup?
Why now? The 1h price sits at 1.4194 inside a tight entry zone between 1.4162 and 1.4226, which means the market is coiled and ready to snap. The 1h ATR of 0.01299 shows average hourly volatility is small, so a breakout from this range will likely be explosive. The 15m RSI at 56.64 is neutral but leaning overbought, hinting that momentum is fading on the short term. The daily trend being a range
XRP+0.45%
I had just switched the app to the background when it suddenly shot up—was it playing hide-and-seek with me?
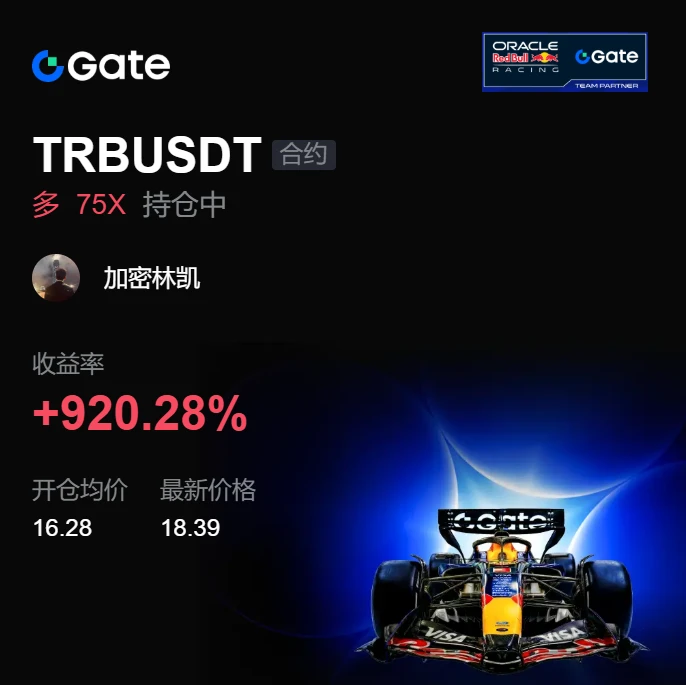
During the repeated intraday swings, $TRB /TRB hovered around 16.28 for nearly two hours without breaking the level. The bottom had consolidated so steadily that the funds had already entered quietly; the volume clearly showed accumulation, not distribution. I decisively opened a long and got on board—the rest is up to the price action.
Don’t lose patience grinding through the range, only to try to regain your dignity in a one-way move.
Now 18.34 has given the answer directly: +907.2%
post-image
TRB-3.09%
LAB-2.16%
ZEC+3.23%
$XRD
【Radix After a Sharp Rally Retracement: Watch Trading Volume and Key Price Levels First】
As of 09-09 08:05 (Beijing Time), XRD was trading at 0.0009086 USDT, up 30.37% over 24 hours, with an intraday high/low of 0.002168 / 0.0006849 and 24-hour trading volume of approximately 11,640 USDT. The hourly candlestick chart shows that the price previously moved sideways around 0.00069, followed by a consecutive surge on rising volume that reached a high of 0.002168; after the surge, it quickly fell back to around 0.00091. In the short term, this represents a structure with significantly increas
post-image
XRD+28.69%
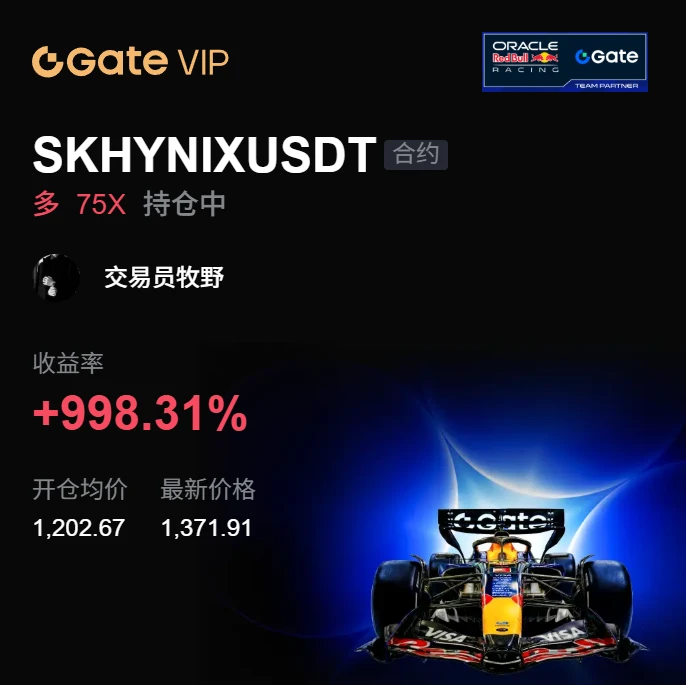
I didn’t do anything—I just went to the bathroom, and when I came back, the K-line had already done the work for me😅. $SKHYNIX It climbed from 1202.67 all the way to 1371.58, and my account suddenly showed +999.96%. Honestly, I feel a little embarrassed making this money.

Looking back at the intraday plunge, everyone else was running while I watched the bids. The more it was dumped, the more buyers stepped in, and the pullback held the key level firmly. I didn’t hesitate at the time and bought the dip directly. Looking back now, it was all a gift.

This profit feels great, but I’m not gree
post-image
SKHYNIX+0.73%
SOL-0.87%
LAB-2.16%
Today is Wednesday, September 9, 2026. ETH is still ranging; open shorts at 2500-2530, then take profit and open longs at 2420-2450.
post-image
ETH-0.53%
  • 1
Most traders are about to get blindsided by a quiet move in $DOGE /USDT.

$DOGE /USDT - SHORT

Trade Plan:
Entry: 0.09 – 0.09
SL: 0.09
TP1: 0.09
TP2: 0.09
TP3: 0.09

Why this setup?
Why now? The 1h price is pinned at 0.09, the 1h ATR is 0.000984, the 15m RSI sits at 53.3, and the daily trend is range. This means the 1h ATR tells us volatility is compact enough for a sharp squeeze, the 15m RSI shows neither overbought nor oversold conditions so momentum can flip either way, the range-bound daily trend proves the market is coiled and waiting, and the 1h price at 0.09 is the exact pivot where
DOGE-1.61%
Why everyone is about to get liquidated shorting SYMBOL right now

$SOL /USDT - SHORT

Trade Plan:
Entry: 103.45 – 103.85
SL: 105.57
TP1: 102.21
TP2: 101.25
TP3: 99.81

Why this setup?
Why now? The daily trend is range, so the market is coiling for a directional break and the 4h bias favors short. The 1h ATR of 0.800835 shows the average hourly move is small, meaning any push above 103.65 is likely overextended. The 15m RSI at 56.67 is neutral but leans overbought on the short side, signaling fading upside momentum inside the 103.45 to 103.85 entry zone. The target TP1 at 102.21 and TP2 at
SOL-0.87%
$PI The bull is coming, what are your thoughts?
Year-end 1️⃣🔪
post-image
PI+5.45%
It turns out middle school textbooks had already pointed blue-collar workers in the right direction.
post-image
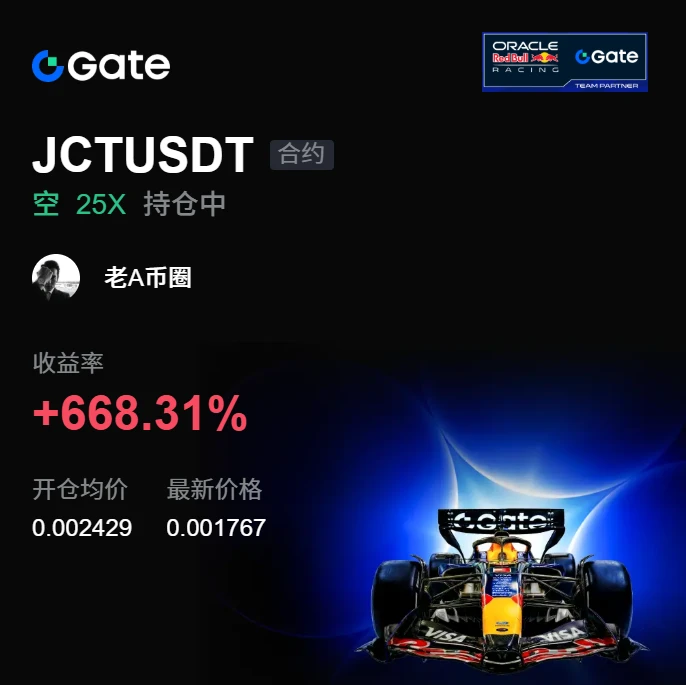
I wasn’t watching the market or using my brain—it was jumping around on its own, like it was working overtime for me. While everyone else was running, $JCT ’s rebounds kept getting weaker, with every push upward falling just short. I didn’t panic along with them; instead, I held the short position, because the logic was simple: if it goes up and nobody buys, it’s just a meaningless rise.

I just took a look, and the price is already at 0.001767. The profit from shorting at 0.002429 has turned into +668.31%. I’ve taken profit on the short, closing 80% first and moving the stop-loss on the rema
post-image
JCT-3.94%
LAB-2.16%
SOL-0.87%
CRYPTO MARKET UPDATES
live-cover
LIVE77
Last night’s livestream dragged on for ages before I finally got off,
I’ll start short-term trades around 9:10 in a bit
Friends who like short-term trading, come join me
post-image
$GT $GT : 3 drivers, 2 risks, 1 price level
Three drivers:
GT is GateChain’s native asset
It is used within the Gate ecosystem
Token burns will reduce the supply over time
Two risks:
Its utility remains closely tied to a single exchange ecosystem
Exchange tokens face platform, regulatory, and concentration risks
One price level: $9.45
GT is currently trading around $9.38, up approximately 2.6%. A sustained break above $9.45 could open room toward $9.80-$10.20, while a drop below $8.85 would weaken this trend.
Tokenomics matter, but the health of the exchange matters more.
#GT #GateToken #GateC
GT-2.75%
Load More

Join 40 M users in our growing community

⚡️ Join 40 M users in the crypto craze discussion

💬 Engage with your favorite top creators

👍 See what interests you