
Square
Following
Hot
News
Notifications
Profile
Share your thoughts
placeholder
Article
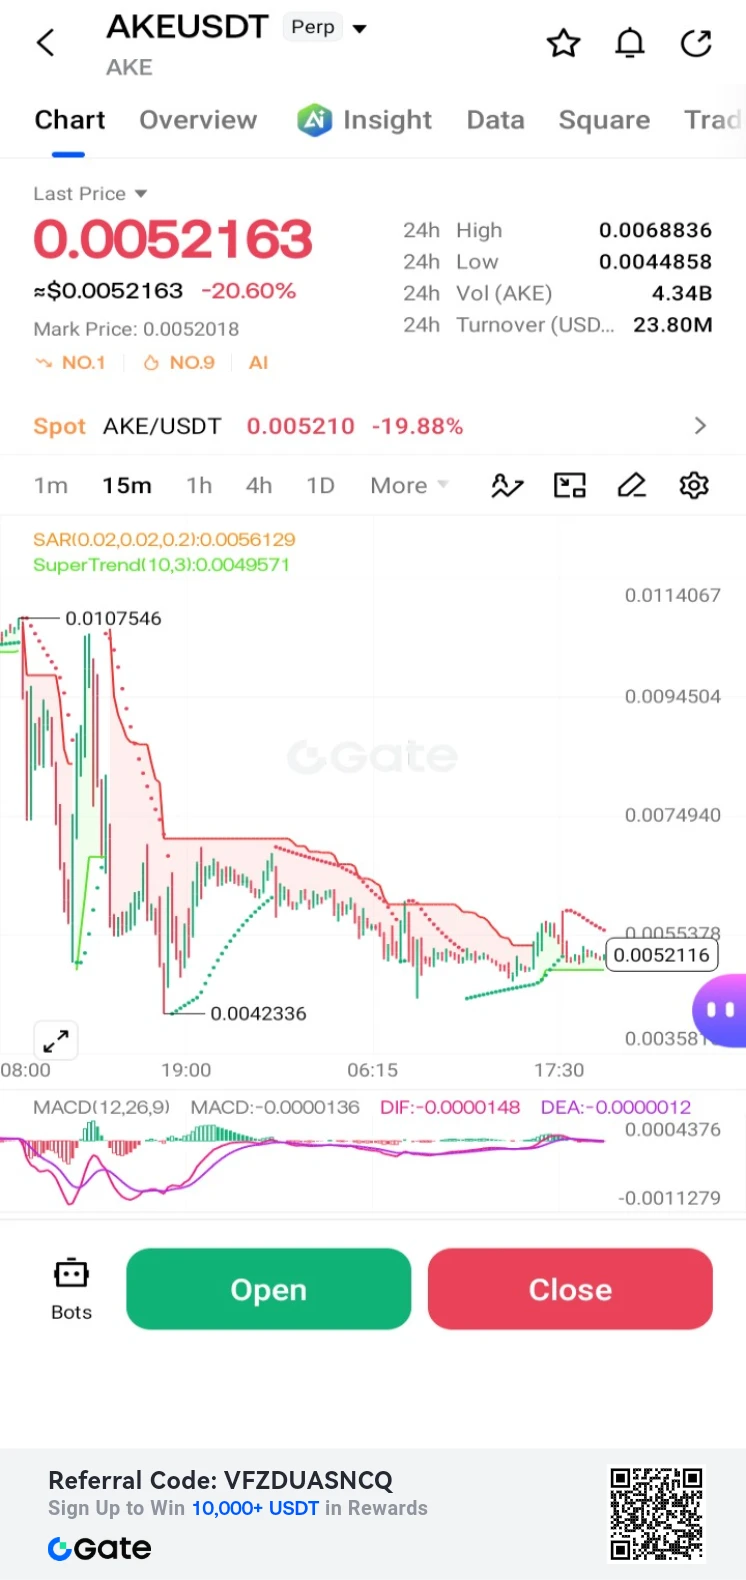
$AKE /USDT Perp – "Heavy Downtrend – Short"**
Trading Plan Short $AKE
Entry: 0.0052163
SL: 0.0056129
TP1: 0.0042336
TP2: 0.0035800
AKE is down -20.60% and failing to find support. MACD is bearish; targeting a break below the 0.0042336 low.
post-image
AKE+6.39%
gm web4
yea the mornings start late in paris.. must be jetlag or raves dunno
post-image
Trenches
PIEVERSE
P
bade
b
PIEVERSE
0x0e...25a9
Market Cap
$.
Change
.
24h Vol
$.
Holders
.
FIONA
F
bade
b
FIONA
B34n...pump
Market Cap
$.
Change
.
24h Vol
$.
Holders
.
IDOL
I
bade
b
IDOL
0x3b...ab07
Market Cap
$.
Change
.
24h Vol
$.
Holders
.
Singularity
S
bade
b
Singularity
7R4M...pump
Market Cap
$.
Change
.
24h Vol
$.
Holders
.
CLAUDIA
C
bade
b
CLAUDIA
2j5S...W2ZM
Market Cap
$.
Change
.
24h Vol
$.
Holders
.
#GateAnnualGala
#ShareWeekly
GateAnnualGala: Celebrating Excellence, Recognizing Community Stars, and Building the Future Together
The Gate 2026 Annual Gala is more than an annual celebration. It represents a powerful recognition of innovation, dedication, trading excellence, creativity, and community participation across the Gate ecosystem. As the year approaches its final chapter, Gate is bringing together traders, livestream hosts, content creators, KOLs, and passionate users to celebrate the individuals and achievements that have helped shape its growing global community.
This year's Annu
BTC-0.67%
ETH-1.26%
GT-2.41%
  • 1
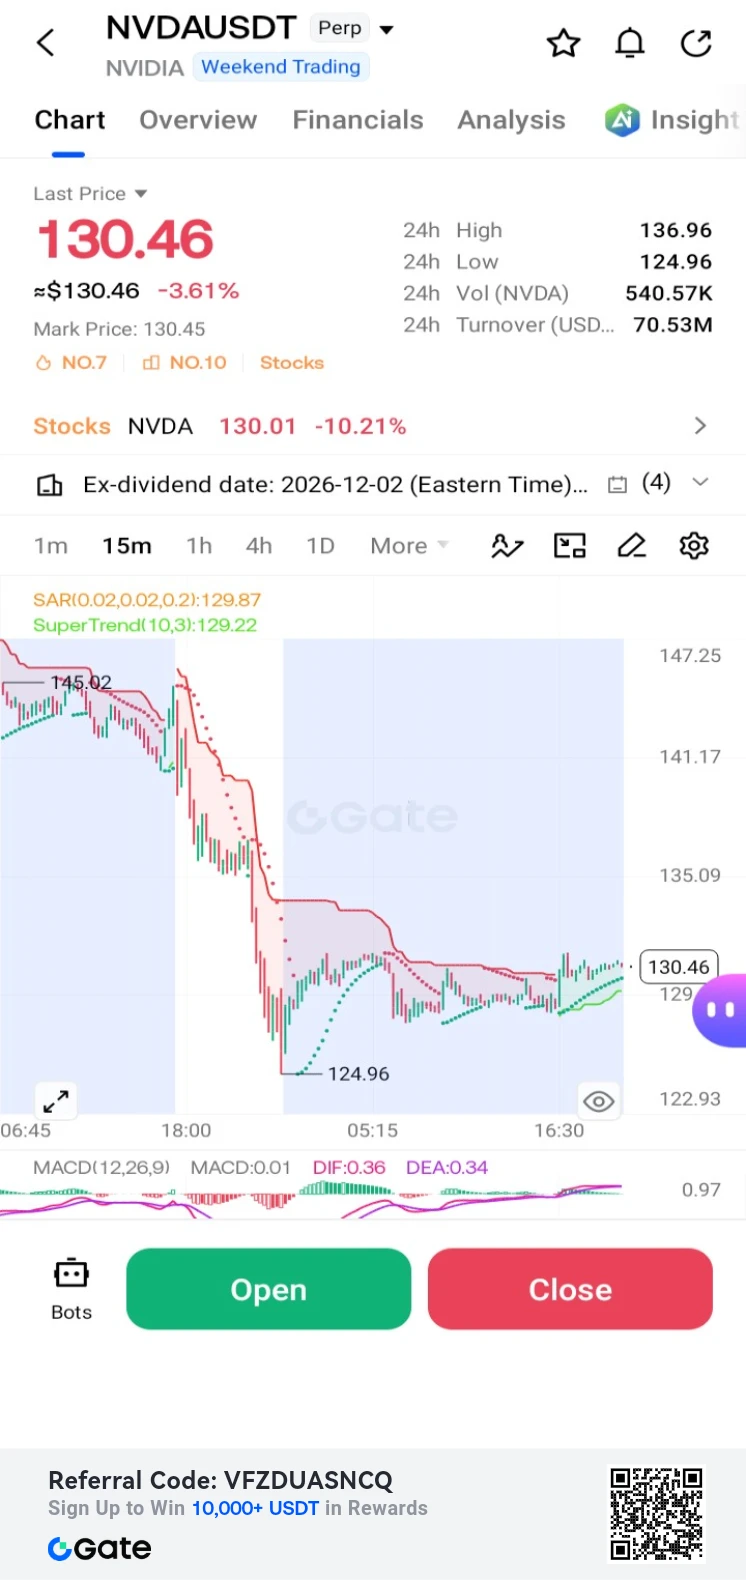
$NVDA /USDT Perp – "Volatile Rebound – Long"**
Trading Plan Long $NVDA
Entry: 130.46
SL: 124.96
TP1: 135.09
TP2: 136.96
NVDA is down -3.61% but recovering from the 124.96 low. MACD is crossing bullish; targeting a retest of the 135.09 EMA cluster.
post-image
NVDA-0.35%
I changed my mind. I used to believe the saying, “After a drop this deep, the bottom can’t be far away.” $MMT Today’s low was 0.2113, down from 0.2783, a 16.65% drop, with turnover still at 162.4M. That’s not a small figure. It shows buyers are stepping in, but getting buried one batch at a time.
A deep drop doesn’t mean it’s the bottom; it only means sellers are still on the move. What really matters isn’t how much it’s fallen, but whether volume contracts after the drop and the price holds steady in a certain range. This move looks more like the car is still going downhill, with no brake lig
MMT-2.35%
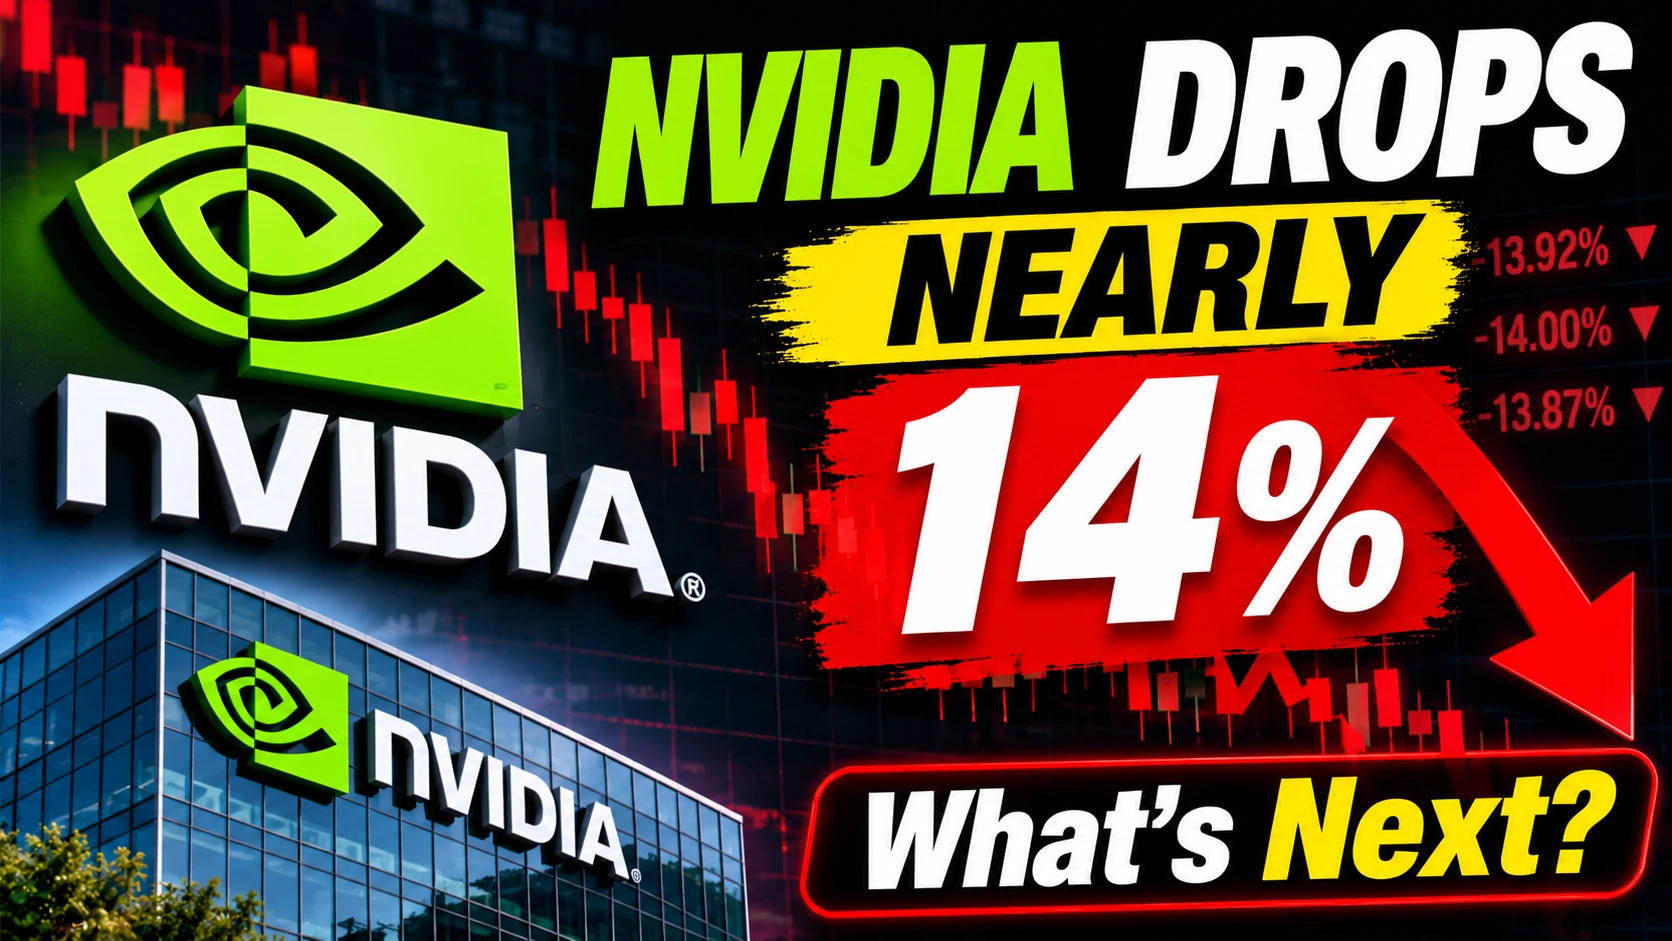
#NvidiaDropsNearly14Percent

Nvidia is facing a major market sell-off, with the stock dropping nearly 14% in a sharp move that has put investors on high alert. A decline of this magnitude can quickly change market sentiment, especially for one of the world’s most closely watched AI and semiconductor companies.

The move highlights how sensitive Nvidia has become to expectations surrounding artificial intelligence, chip demand, earnings growth, valuations, and future investment. After years of extraordinary enthusiasm around AI-related companies, investors are increasingly focused on whether gr
post-image
NVDA-13.84%
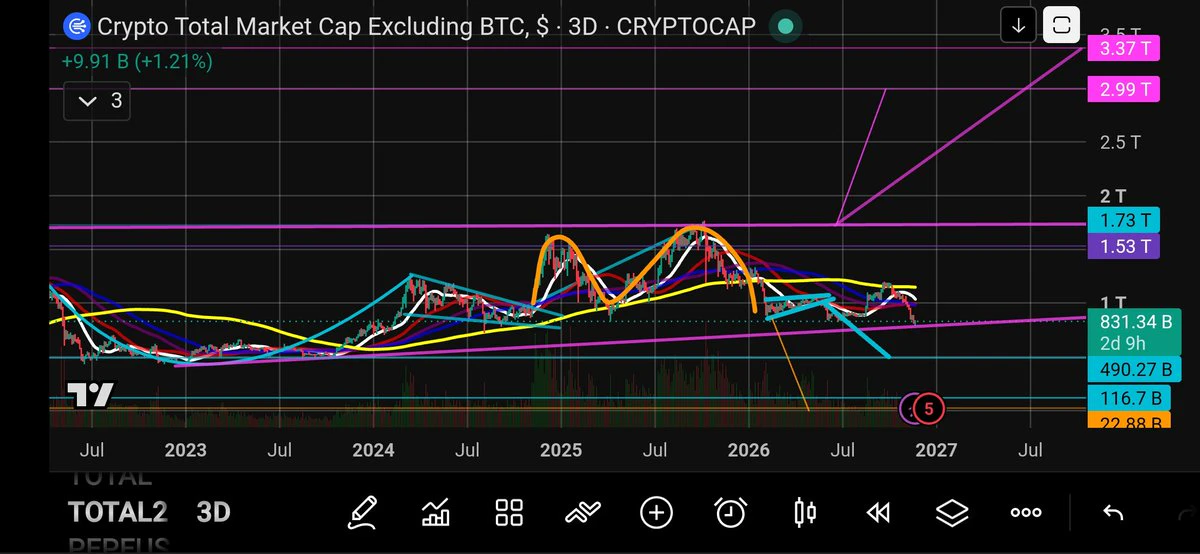
$TOTAL 2 Marketcap EXCLUDING $BTC 🚨
3D Chart Analysis 🔎
The bulls have been able to defend this area 4 times already. Will they be able to do it a 5th time?
The pink converging trendlines appear to be forming a very large ascending triangle. This is a handle to a very large cup and handle pattern.
The bulls will want to defend this zone of $832B-$722B or risk collapse to $490B.
A potential rebound to the upside is looking quite possible.
If the top pink trendline of the ascending triangle is broken to the upside at $1.75T. Then the targets of $2.99T and $3.37T will be activated.
Yes we are
post-image
BTC-0.67%
ETH-1.26%
SOL-0.77%
🏦 U.S. employment data cools—why are U.S. stocks and BTC still falling?

The latest U.S. initial jobless claims came in at 203k, above market expectations of around 197k, signaling slight cooling in the labor market.

But the Fed meeting minutes sent a hawkish signal, and expectations of a December rate hike remain strong. The Nasdaq fell about 2.3% overnight, while BTC remained under pressure. 📉

👀 Employment showed slight weakness, but that failed to ease selling pressure. Who exactly is driving this market move?

📊 Cast your vote for what you think is the biggest source of pressure on t
post-image
BTC-0.67%
NDAQ-0.95%
BTC TODAY UPDATE
live-cover
LIVE1,268
BTC-0.67%
🟣️WE’RE EXPANDING TO YOUTUBE!🟣️
As our team continues to grow, we’re taking another step forward and launching our YouTube channel.
Every week, we’ll bring you updates on the key events shaping the crypto market — the major moves, important developments, and what’s worth keeping an eye on.
This is just the beginning. If you enjoy the format and find it valuable, we’ll expand the content and introduce new categories.
post-image
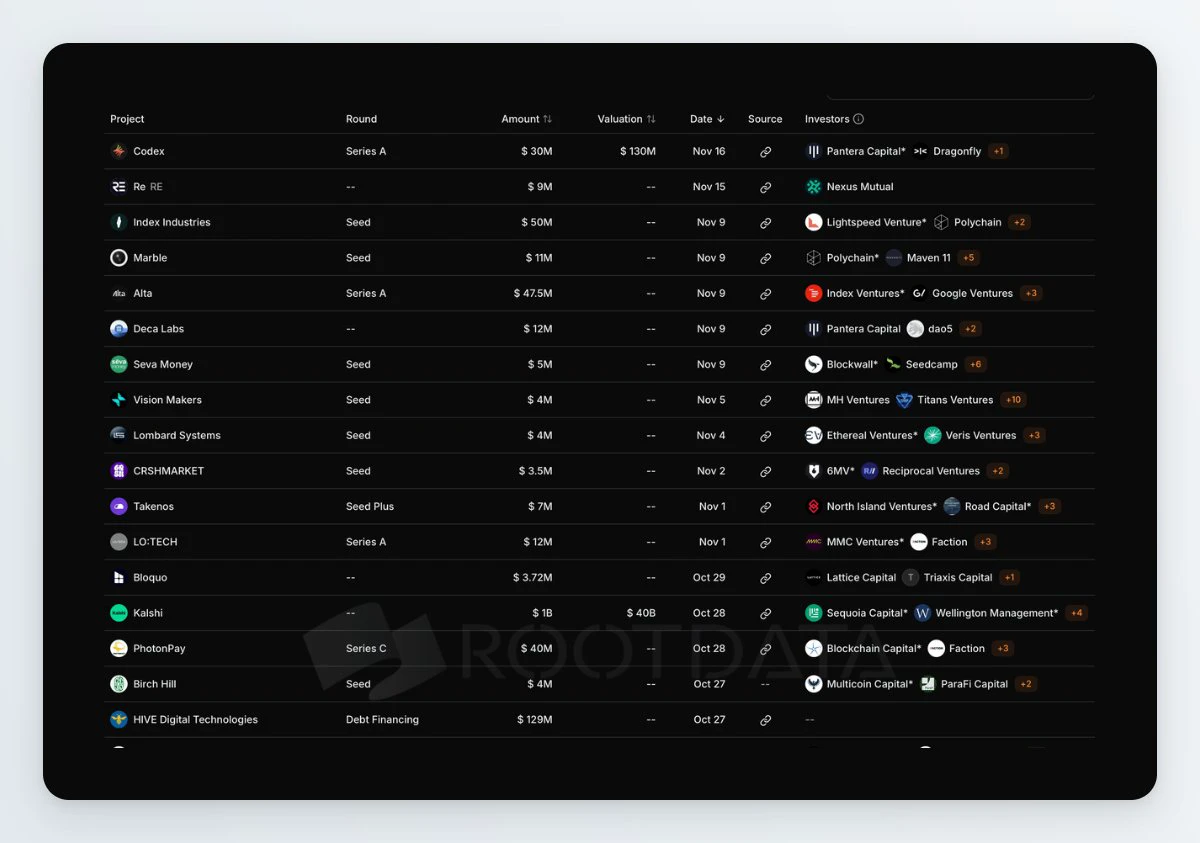
Crypto fundraising is starting to look a lot like TradFi's.
Majority of the recent raises are in:
• Housing markets
• Uranium trading
• Cross-border payments
• Traditional lending
In Q3 2026, crypto VC deals fell 29% YoY, while funding dropped just 3%. And later-stage companies took 76% of the capital (up from just 15% in Q3 2024).
After years of funding projects that struggled to retain users beyond token incentives, it's no wonder tbh
post-image
Hypercollecting >> Hypertrading
post-image
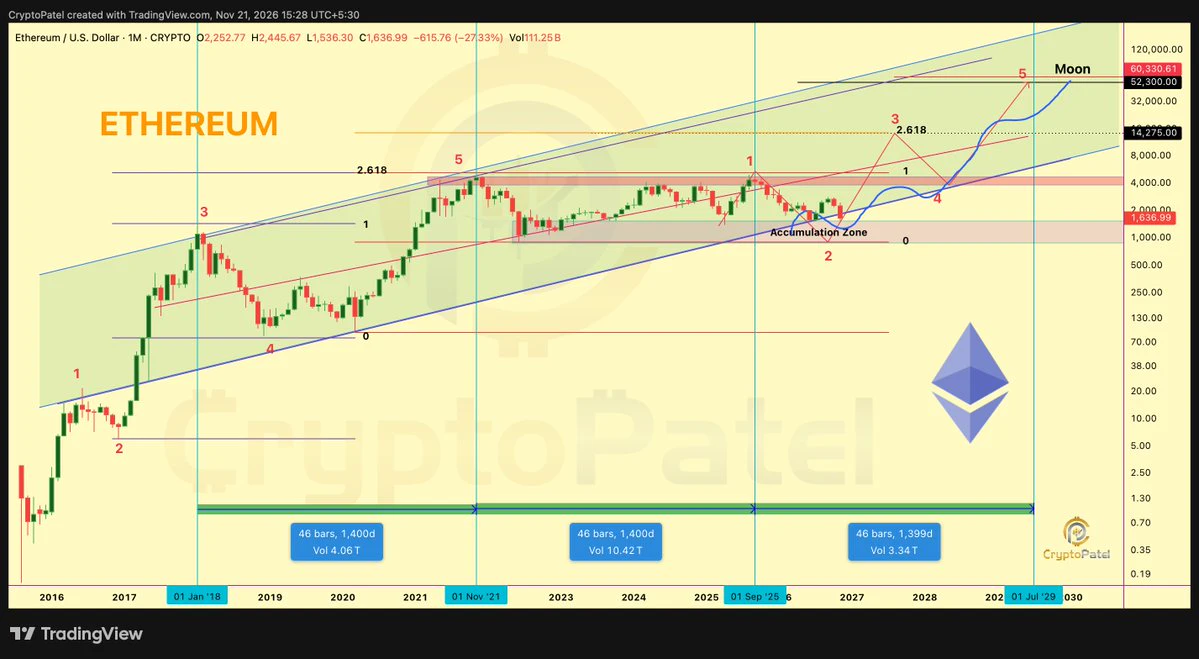
ETHEREUM ($ETH ): NEXT BOTTOM & ATH PROJECTION
I analysed Ethereum's historical ATH-to-bottom corrections and cycle durations. Here's what the mathematics suggests.
Historical Corrections:
🔸 2016: -72.45%
🔸 2018: -94.33%
🔸 2021: -81.92%
🔸 2025–26: -69.51% (June low)
Previous cycles recorded an average correction of 82.90% and a median of 81.92%.
Next Potential Bottom:
Based on the August 2025 ATH of $4,954:
🔸 Average model: $846
🔸 Median model: $1,300
Next ATH Scenarios:
🔸 Conservative: $5,500–$6,000
🔸 Base case: $6,000–$8,900
🔸 Aggressive: $9,000–$11,000
Potential Timeline:
🔸 Further
post-image
ETH-1.26%
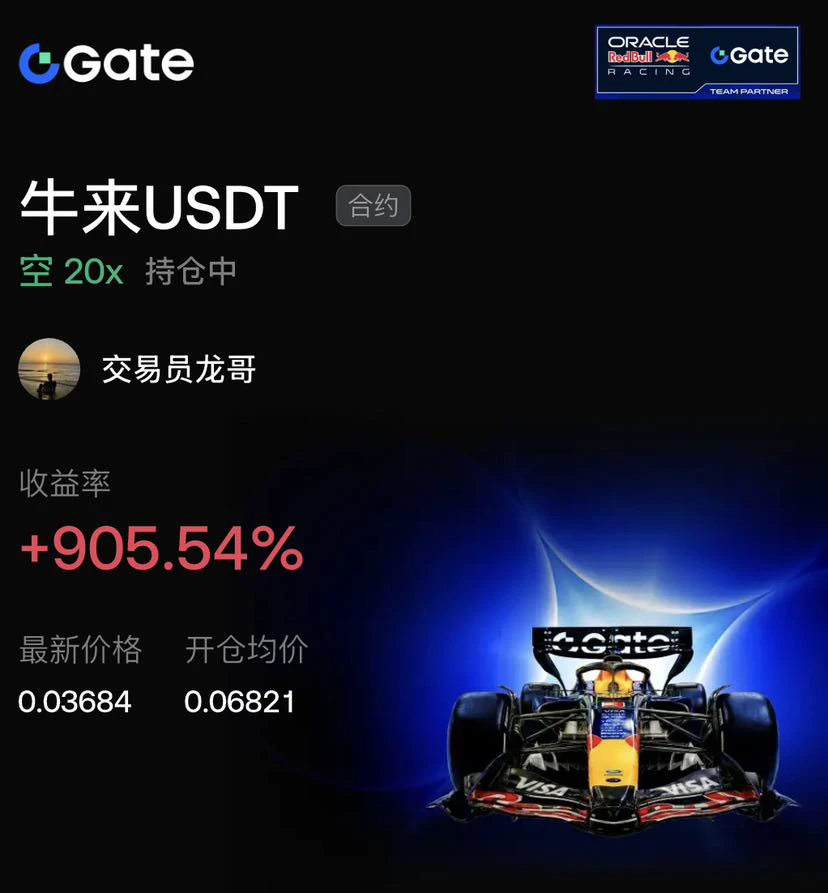
+905.54% floating profit came from precisely positioning against resistance at the top. This asset turned sharply after meeting resistance at 0.06821, with a bearish moving average crossover and rising volume. I entered a 20x short, and then bears drove the price down to 0.03684, completing the main downward wave in one sweep. Bears are completely in control of the market.

The current profit cushion is substantial, but prices at low levels are prone to a technical rebound. Bearish sentiment is highly unanimous. At 20x leverage, a sudden wick can happen at any time, leaving no safety cushion w
post-image
BTC-0.65%
ETH-1.23%
Stocks, bonds, gold, and crypto plunge in sync—is a storm really coming? Finance knowledge ... $ETH $SOL $BNB
Bitcoin falls below $60k; can it stabilize and rebound in the short term? Global stocks post their longest losing streak in three years as investors’ risk aversion intensifies
post-image
SOL-0.77%
BNB-0.76%
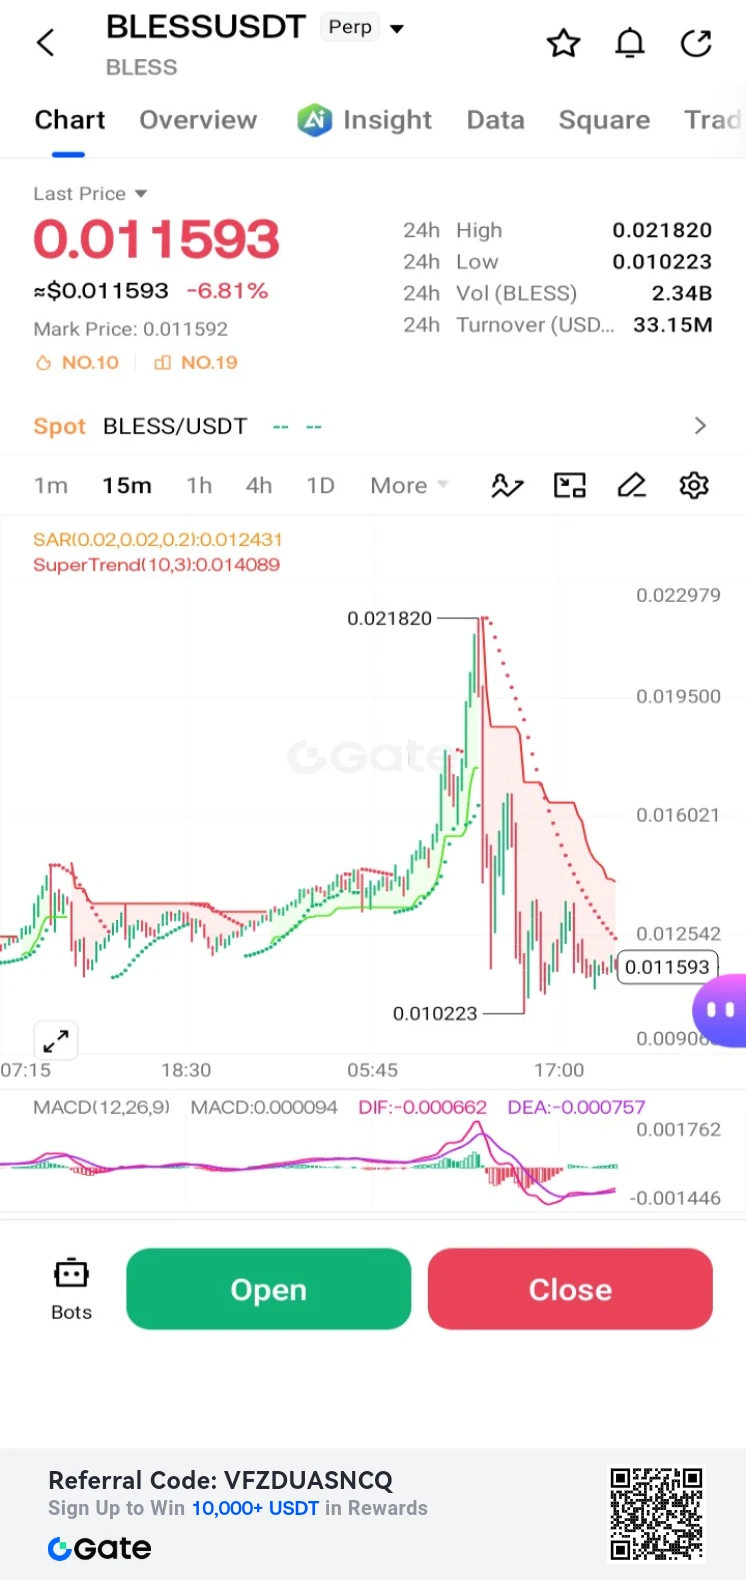
$BLESS /USDT Perp – "Post-Spike Retracement – Short"**
Trading Plan Short $BLESS
Entry: 0.011593
SL: 0.014089
TP1: 0.010223
TP2: 0.009000
BLESS is down -6.81% after rejecting the 0.021820 high. MACD is bearish; targeting a continuation down to the 0.010223 support.
post-image
BLESS-2.03%
#ZIL Hang in there, sis—you should be recovering soon. I’m getting in first, okay
post-image
ZIL-4.26%
$XRP uses timeframe confluence to find opportunities, with levels and exit lines here
$XRP There’s a classic debate right now: one side points to the 24-hour gain of +1.44% as proof of direction, while the other counters with key levels. I’m not taking sides based on the percentage move for now, because $XRP has already moved on the 1-hour chart, while the 4-hour chart hasn’t confirmed it or given a complete answer. I’ll treat the shorter timeframe as a signal to pay attention, not as a conclusion. Without confirmation from the larger timeframe, direction can still swing either way.
My view is
post-image
XRP-1.15%
🎯 BITCOIN MELTDOWN EXPLAINED: AI Stock Crash, Macro Storm & Gate.io Strategy!
live-cover
LIVE2,172
BTC-0.67%
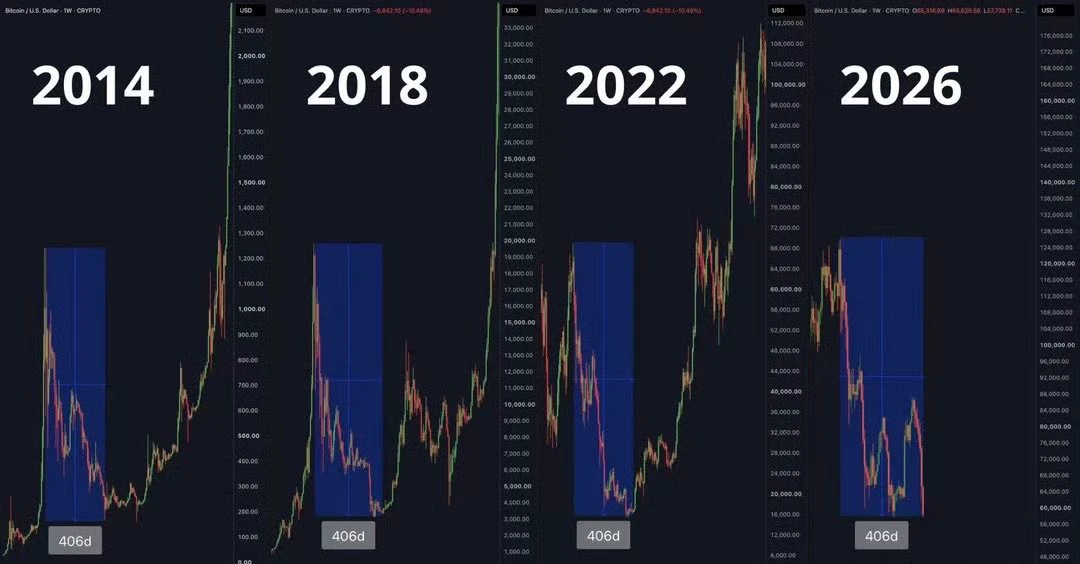
Saw a take that this might be the last week of Bitcoin’s bear market:
2014 bear market: 58 weeks, 406 days
2018 bear market: 58 weeks, 406 days
2022 bear market: 58 weeks, 406 days
2026 bear market: 58 weeks, 406 days
Those trying to apply past cycles to this one have carved a hole right through the boat.
With price action this fucking bad, people are still saying it’s the last week of the bear market? Even the Rainbow Chart has stopped working.
post-image
BTC-0.67%
Load More

Join 40 M users in our growing community

⚡️ Join 40 M users in the crypto craze discussion

💬 Engage with your favorite top creators

👍 See what interests you

Trending Topics

BTCBreaksBelow60K

2.1M Views29.9K Discussing

BTC fell below $60,000 on November 20 for the first time since July, alongside a tech stock selloff and broader pressure on risk assets. Will $60K become resistance, or can BTC quickly reclaim it? What price or volume signals would convince you that selling pressure is easing?

GateDirectIPOPhase3ANTAllocates92100Shares

779.2K Views4.9K Discussing

NvidiaDropsNearly14Percent

326.7K Views7.6K Discussing

View More