#Ahr999EntersBottomBuyingZone
𝗔𝗵𝗿𝟵𝟵𝟵 𝗙𝗮𝗹𝗹𝘀 𝗕𝗲𝗹𝗼𝘄 𝟬.𝟰𝟱 𝗮𝘁 $𝟳𝟱,𝟳𝟴𝟯: 𝗪𝗵𝗮𝘁 𝘁𝗵𝗲 𝗕𝗼𝘁𝘁𝗼𝗺-𝗕𝘂𝘆𝗶𝗻𝗴 𝗦𝗶𝗴𝗻𝗮𝗹 𝗠𝗲𝗮𝘀𝘂𝗿𝗲𝘀, 𝗪𝗵𝗲𝗿𝗲 𝗶𝘁 𝗦𝗶𝘁𝘀 𝗮𝗻𝗱 𝗪𝗵𝗮𝘁 𝗶𝘁 𝗖𝗮𝗻𝗻𝗼𝘁 𝗣𝗿𝗼𝗺𝗶𝘀𝗲
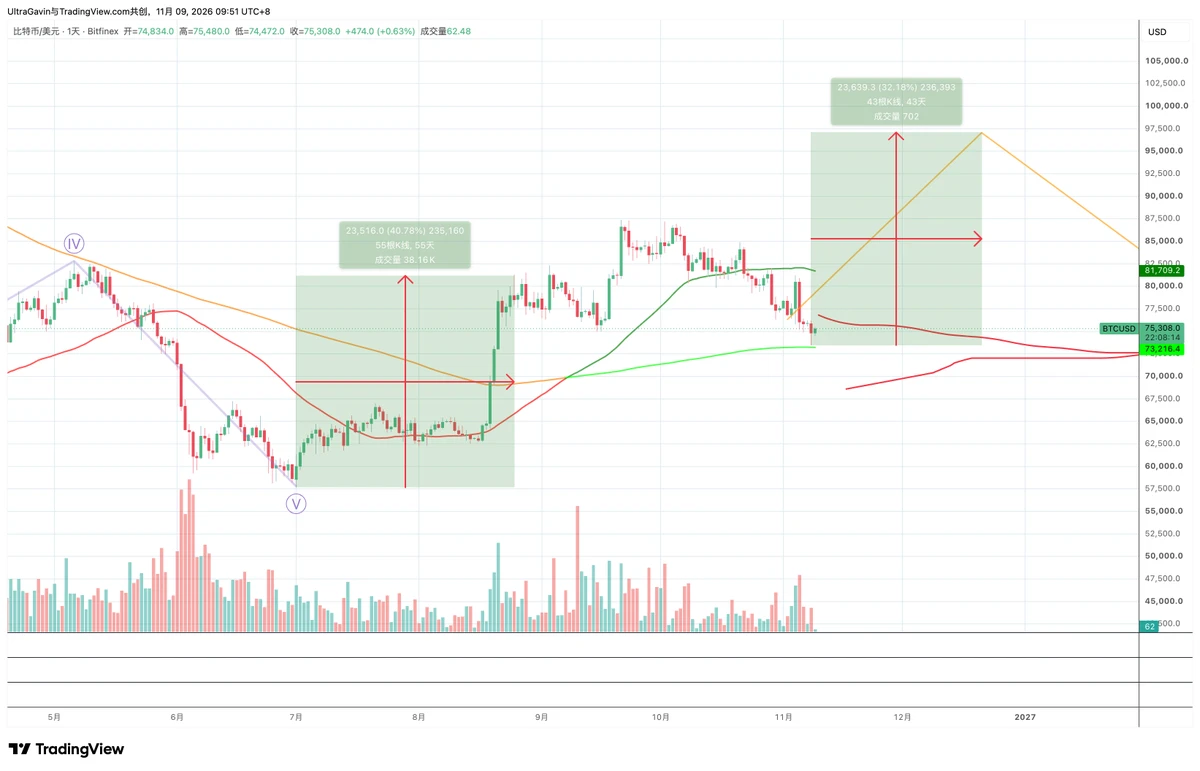
With Bitcoin at $75,783, the Ahr999 index is back in its bottom-buying zone. The index sat at 0.50 on October 25, touched 0.45 on October 31 and November 1, read 0.44 on November 3 and 0.45 on November 4, per CoinAnk. A price of $75,783 puts it at roughly 0.43 by my math. The signal is back after about 80 days outside the zone, since the previous stretch below 0.45 ran from May 29 to August 19. Bitcoin sits about 31% above its 2026 low of $57,945 and about 4% above its 200-day cost of roughly $72,700.
𝗪𝗵𝗮𝘁 𝘁𝗵𝗲 𝗜𝗻𝗱𝗲𝘅 𝗠𝗲𝗮𝘀𝘂𝗿𝗲𝘀
Ahr999, created by a Weibo user of that name, multiplies two ratios: the price divided by the 200-day fixed-investment cost, and the price divided by an exponential-growth estimate of Bitcoin's long-term value. The first shows whether you would be buying above or below the average of the last 200 days. The second shows how far price sits from its long-run trend. A low reading means both are cheap at once. The zones are below 0.45 for bottom-buying, 0.45 to 1.2 for regular dollar-cost averaging, and above 1.2 for caution.
𝗧𝗵𝗲 𝗣𝗿𝗶𝗰𝗲 𝗟𝗮𝗱𝗱𝗲𝗿
Using CoinAnk's inputs, a 200-day cost near $72,700 and a growth estimate near $184,000, the index maps to prices as follows, assuming those inputs stay constant. They drift daily, so treat these as approximations.
0.45 sits near $77,565 (+2.4%), so Bitcoin needs to close above about that level to leave the zone.
0.40 sits near $73,130 (-3.5%).
0.35 sits near $68,400 (-9.7%).
0.30 sits near $63,330 (-16.4%).
0.27, February's low reading, sits near $60,080 (-20.7%).
𝗧𝗵𝗲 𝗥𝗲𝗰𝗼𝗿𝗱
Bitcoin has spent 731 days below the 0.45 line in its history, and one distribution study found it in the zone only about 8.5% of the time. Readings below 0.3 came in the 2018 bear market, the March 2020 crash and the 2022 FTX collapse. In 2026 the index hit 0.27 to 0.29 in February, 0.308 on June 5 with Bitcoin at $62,108, and 0.32 on July 6. From that June reading to the October 2 peak of $87,197, Bitcoin rose about 40%. The zone has often been a good place to accumulate, but it has also lasted weeks or months.
𝗧𝗵𝗲 𝗖𝗮𝘁𝗰𝗵
A bottom-buying zone is not a bottom. In 2026 the index stayed below 0.45 for about 82 days and fell as low as 0.27, meaning price could drop 20% from here and still be consistent with a historical low. The index also ignores the news, so it says nothing about the Nasdaq's correction, rate expectations or leverage. It describes value relative to history, not timing.
𝗧𝗵𝗲 𝗠𝗮𝗿𝗸𝗲𝘁 𝗦𝗲𝘁𝘁𝗶𝗻𝗴
Bitcoin fell about 6% on November 5 as the Nasdaq entered correction, after bouncing to $80,076 the day before. On-chain, short-term holders have a cost basis near $75,900, so Bitcoin is trading about level with their break-even, with 1.145 million BTC of recent buyers underwater between $78,000 and $86,000. Strategy's average cost is $75,446, only about 0.4% below the price. Near-term events include US CPI on November 10 and Nvidia's report on November 17.
𝗛𝗼𝘄 𝘁𝗼 𝗨𝘀𝗲 𝘁𝗵𝗲 𝗦𝗶𝗴𝗻𝗮𝗹 𝗪𝗶𝘁𝗵𝗼𝘂𝘁 𝗟𝗲𝗮𝗻𝗶𝗻𝗴 𝗼𝗻 𝗜𝘁
The sensible use is as a pacing tool. One approach is to split a planned allocation into tranches tied to the ladder, for example one at the first reading below 0.45, another near 0.40 and another near 0.35, with each tranche sized so that a move to 0.27 would not threaten the account. Avoid leverage, since the zone can persist while price keeps falling. Keep a reserve for the deeper levels and write down the invalidation before buying.
Ahr999 says Bitcoin is cheap relative to history at $75,783, and the record says that signal has been useful for long-horizon accumulation. It does not say when the low arrives or how deep it will be. The next tests are a daily close back above about $77,565, which would end the signal, or a drop toward $73,130 and $68,400, which would deepen it.
#ShareWeekly #WCTCS9
𝗔𝗵𝗿𝟵𝟵𝟵 𝗙𝗮𝗹𝗹𝘀 𝗕𝗲𝗹𝗼𝘄 𝟬.𝟰𝟱 𝗮𝘁 $𝟳𝟱,𝟳𝟴𝟯: 𝗪𝗵𝗮𝘁 𝘁𝗵𝗲 𝗕𝗼𝘁𝘁𝗼𝗺-𝗕𝘂𝘆𝗶𝗻𝗴 𝗦𝗶𝗴𝗻𝗮𝗹 𝗠𝗲𝗮𝘀𝘂𝗿𝗲𝘀, 𝗪𝗵𝗲𝗿𝗲 𝗶𝘁 𝗦𝗶𝘁𝘀 𝗮𝗻𝗱 𝗪𝗵𝗮𝘁 𝗶𝘁 𝗖𝗮𝗻𝗻𝗼𝘁 𝗣𝗿𝗼𝗺𝗶𝘀𝗲
With Bitcoin at $75,783, the Ahr999 index is back in its bottom-buying zone. The index sat at 0.50 on October 25, touched 0.45 on October 31 and November 1, read 0.44 on November 3 and 0.45 on November 4, per CoinAnk. A price of $75,783 puts it at roughly 0.43 by my math. The signal is back after about 80 days outside the zone, since the previous stretch below 0.45 ran from May 29 to August 19. Bitcoin sits about 31% above its 2026 low of $57,945 and about 4% above its 200-day cost of roughly $72,700.
𝗪𝗵𝗮𝘁 𝘁𝗵𝗲 𝗜𝗻𝗱𝗲𝘅 𝗠𝗲𝗮𝘀𝘂𝗿𝗲𝘀
Ahr999, created by a Weibo user of that name, multiplies two ratios: the price divided by the 200-day fixed-investment cost, and the price divided by an exponential-growth estimate of Bitcoin's long-term value. The first shows whether you would be buying above or below the average of the last 200 days. The second shows how far price sits from its long-run trend. A low reading means both are cheap at once. The zones are below 0.45 for bottom-buying, 0.45 to 1.2 for regular dollar-cost averaging, and above 1.2 for caution.
𝗧𝗵𝗲 𝗣𝗿𝗶𝗰𝗲 𝗟𝗮𝗱𝗱𝗲𝗿
Using CoinAnk's inputs, a 200-day cost near $72,700 and a growth estimate near $184,000, the index maps to prices as follows, assuming those inputs stay constant. They drift daily, so treat these as approximations.
0.45 sits near $77,565 (+2.4%), so Bitcoin needs to close above about that level to leave the zone.
0.40 sits near $73,130 (-3.5%).
0.35 sits near $68,400 (-9.7%).
0.30 sits near $63,330 (-16.4%).
0.27, February's low reading, sits near $60,080 (-20.7%).
𝗧𝗵𝗲 𝗥𝗲𝗰𝗼𝗿𝗱
Bitcoin has spent 731 days below the 0.45 line in its history, and one distribution study found it in the zone only about 8.5% of the time. Readings below 0.3 came in the 2018 bear market, the March 2020 crash and the 2022 FTX collapse. In 2026 the index hit 0.27 to 0.29 in February, 0.308 on June 5 with Bitcoin at $62,108, and 0.32 on July 6. From that June reading to the October 2 peak of $87,197, Bitcoin rose about 40%. The zone has often been a good place to accumulate, but it has also lasted weeks or months.
𝗧𝗵𝗲 𝗖𝗮𝘁𝗰𝗵
A bottom-buying zone is not a bottom. In 2026 the index stayed below 0.45 for about 82 days and fell as low as 0.27, meaning price could drop 20% from here and still be consistent with a historical low. The index also ignores the news, so it says nothing about the Nasdaq's correction, rate expectations or leverage. It describes value relative to history, not timing.
𝗧𝗵𝗲 𝗠𝗮𝗿𝗸𝗲𝘁 𝗦𝗲𝘁𝘁𝗶𝗻𝗴
Bitcoin fell about 6% on November 5 as the Nasdaq entered correction, after bouncing to $80,076 the day before. On-chain, short-term holders have a cost basis near $75,900, so Bitcoin is trading about level with their break-even, with 1.145 million BTC of recent buyers underwater between $78,000 and $86,000. Strategy's average cost is $75,446, only about 0.4% below the price. Near-term events include US CPI on November 10 and Nvidia's report on November 17.
𝗛𝗼𝘄 𝘁𝗼 𝗨𝘀𝗲 𝘁𝗵𝗲 𝗦𝗶𝗴𝗻𝗮𝗹 𝗪𝗶𝘁𝗵𝗼𝘂𝘁 𝗟𝗲𝗮𝗻𝗶𝗻𝗴 𝗼𝗻 𝗜𝘁
The sensible use is as a pacing tool. One approach is to split a planned allocation into tranches tied to the ladder, for example one at the first reading below 0.45, another near 0.40 and another near 0.35, with each tranche sized so that a move to 0.27 would not threaten the account. Avoid leverage, since the zone can persist while price keeps falling. Keep a reserve for the deeper levels and write down the invalidation before buying.
Ahr999 says Bitcoin is cheap relative to history at $75,783, and the record says that signal has been useful for long-horizon accumulation. It does not say when the low arrives or how deep it will be. The next tests are a daily close back above about $77,565, which would end the signal, or a drop toward $73,130 and $68,400, which would deepen it.
#ShareWeekly #WCTCS9