Share your thoughts
placeholder
Article
A bullish continuation setup is brewing on $EIGEN as buyers continue stepping in with confidence. The trend feels clean and orderly, momentum is steadily building, and the structure looks increasingly ready for expansion. Strength across $TIA and $DYM adds even more confidence to the broader move.
post-image
EIGEN+7.75%
TIA-1.70%
DYM+1.29%
$USELESS looks like it's about to make a move.
Took a look at the fund flows—can it do it and break the previous high?
post-image
USELESS+2.72%
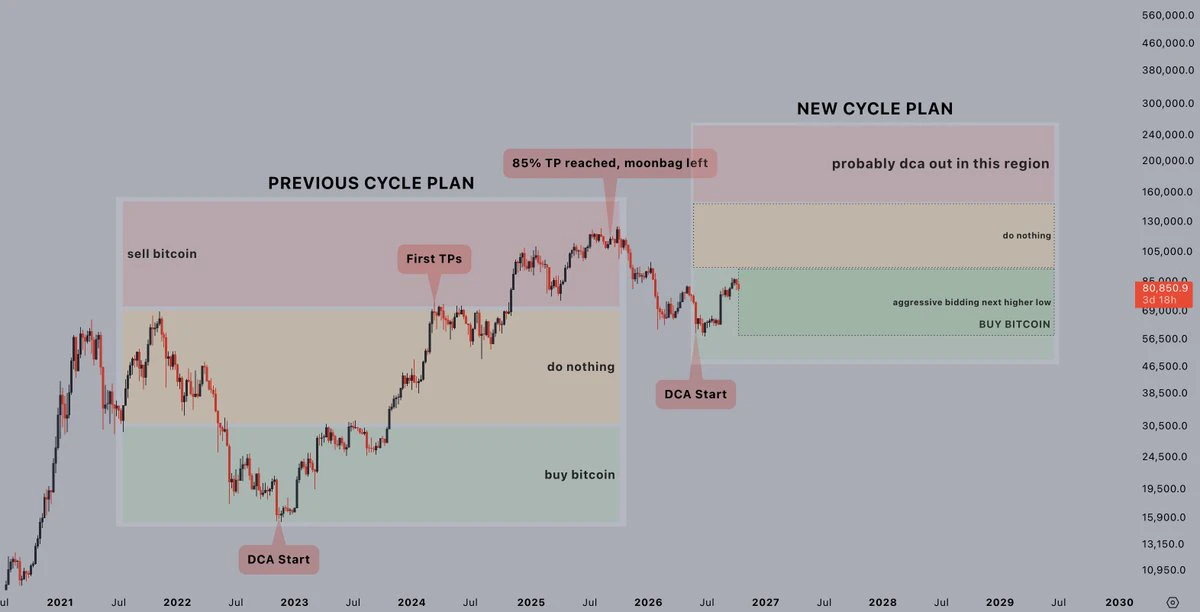
$BTC LIQUIDATED EVERY DEGEN AROUND 76K
OPEN INTEREST NUKED
81,740 traders were liquidated, the total liquidations comes in at $386.21 million.
post-image
BTC+1.10%
Why hasn't the market reacted when the probability of a rate hike is so high?
ZEC/USDT
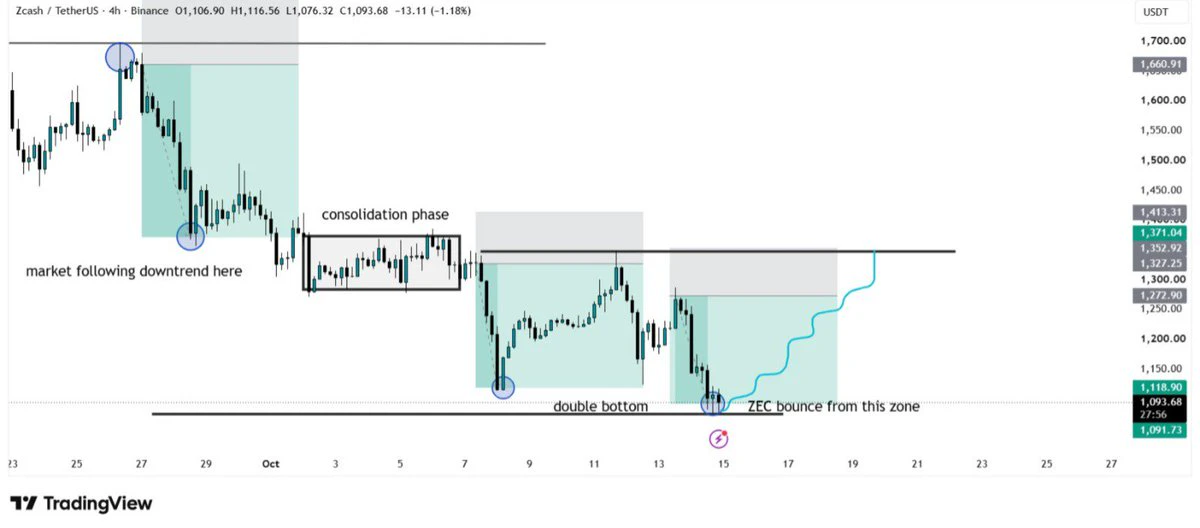
ZEC is showing a strong recovery on the 15-minute chart after bouncing from the $1,054.57 low. Price is currently around $1,153, with a sharp bullish candle pushing above the short-term moving averages.
The key point here is the volume-backed breakout. MA5 is around $1,113.59, while MA10 and MA30 are near $1,105.63–$1,105.73, giving the current move a stronger bullish structure as long as ZEC holds above this zone.
Key levels I’m watching:
• Current price: $1,153
• Immediate resistance: $1,177–$1,183
• Major resistance / 24H high: $1,216.52
• Support: $1,113–$1,105
• Stronger support
post-image
ZEC-0.65%
Nobody is talking about this hidden SHORT setup on $PONS /USDT.

$PONS /USDT - SHORT

Trade Plan:
Entry: N/A – N/A
SL: N/A
TP1: N/A
TP2: N/A
TP3: N/A

Why this setup?
Why now? The 1h price sits at 0.6192, a level that has capped rallies inside the daily range. The 15m RSI reading of 52.23 shows the market is not overbought, which means sellers can still push it lower from this neutral zone. The 1h ATR is absent, so volatility is compressed and a sudden breakdown can catch the crowd off guard. The daily trend is range, which means price is likely to revisit the range floor after this entry p
PONS+7.74%
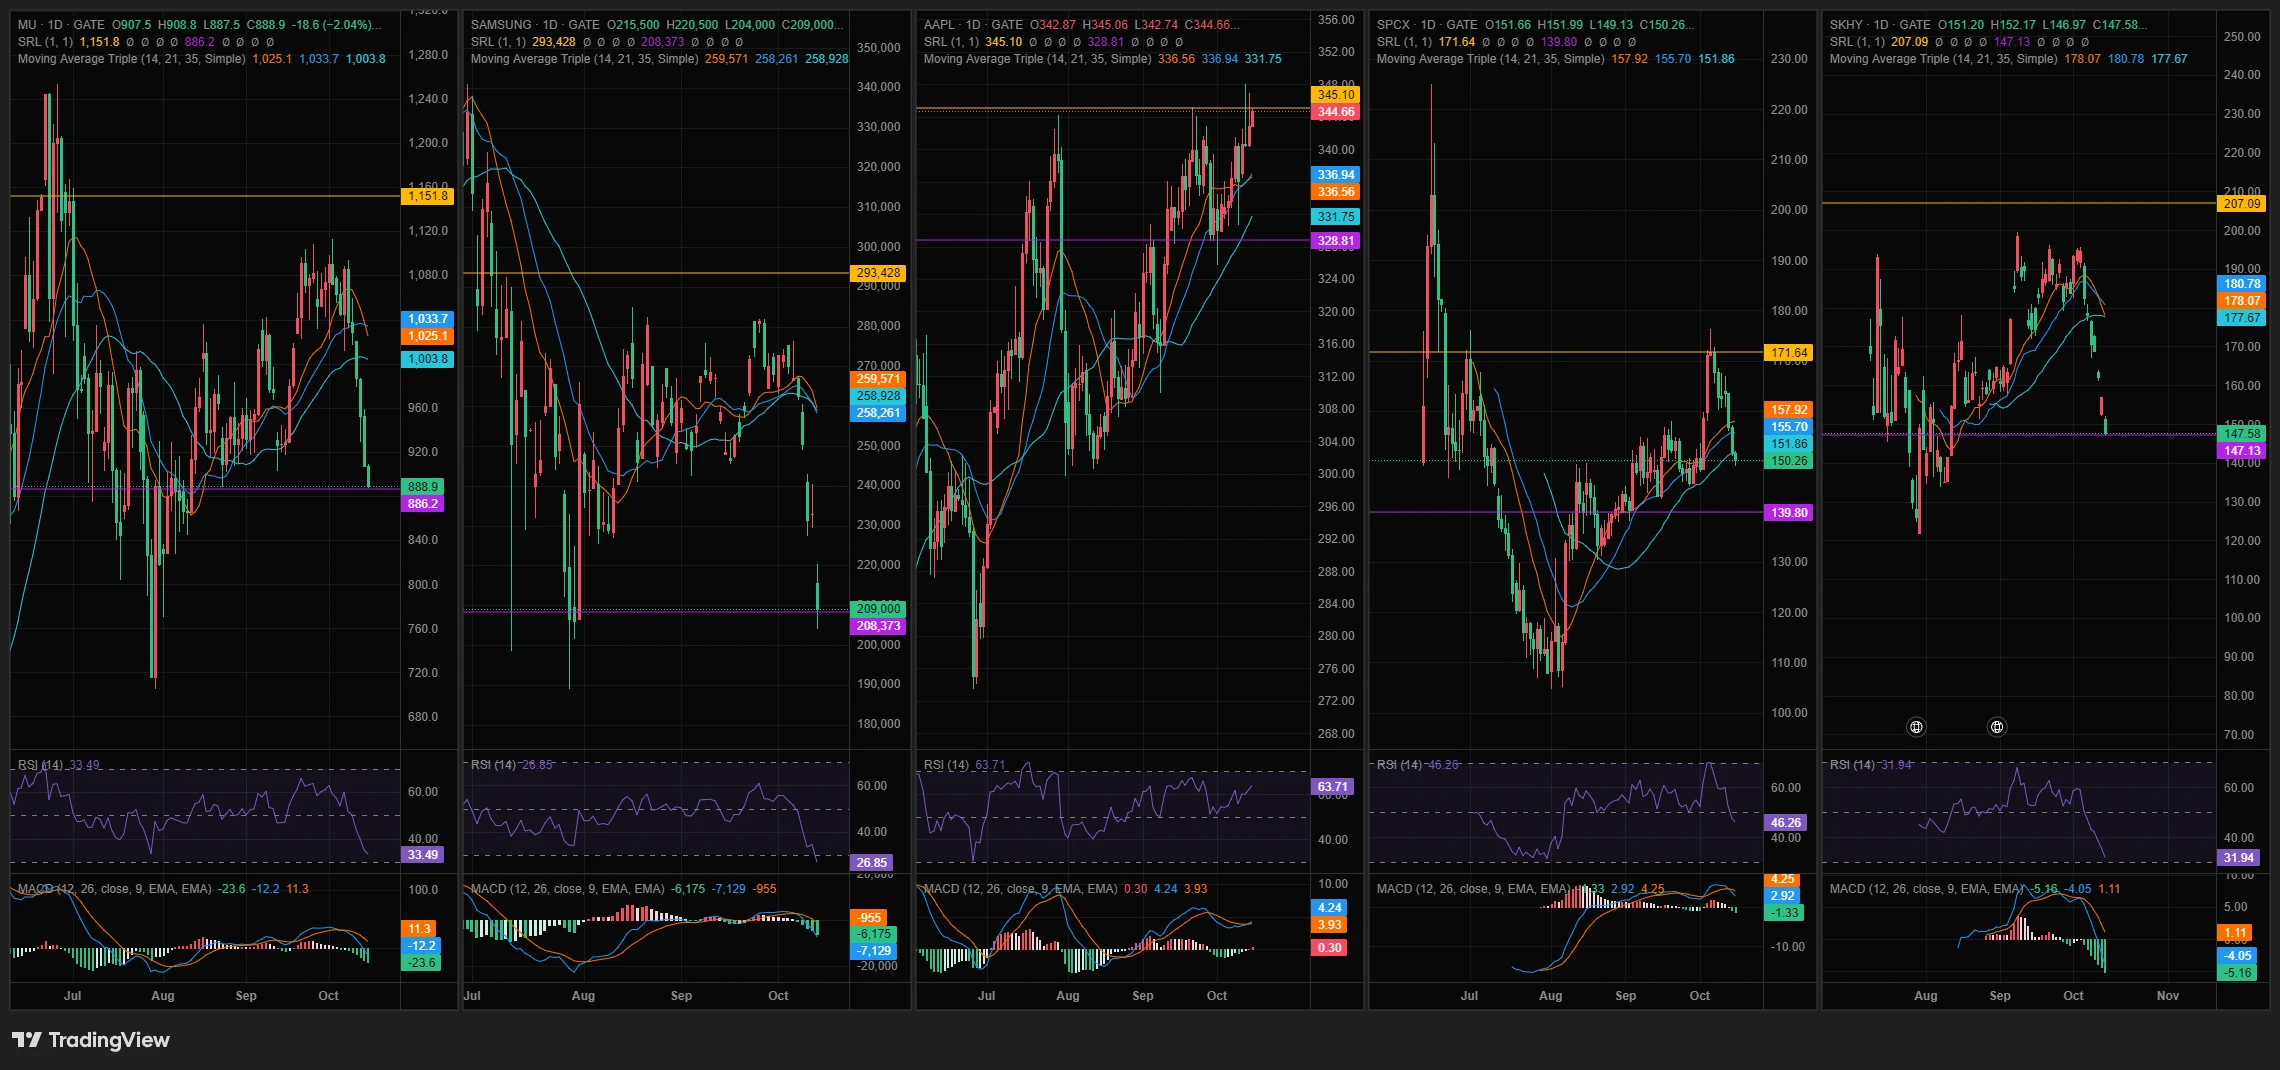
After Apple’s first foldable-screen iPhone, iPhone Duo, was officially unveiled, Apple’s stock surged 3.56% in a single day, touching an intraday high of $326.74 and ultimately closing at $326.57, sending its total market capitalization past the $4.76 trillion mark
Many people are curious: how can a mere 3% gain create nearly $160 billion in additional market value? From the core logic of capital markets, this is by no means simply a matter of enthusiasm for a new phone, but rather Wall Street repricing Apple’s business growth curve
Valuation Premium Reshaping
Before this, the market was gener
post-image
AAPL+1.53%
  • 3
$ETH USDT Long Setup
🔴 Entry: 2,470 - 2,500
🎯 TP1: 2,550
🎯 TP2: 2,600
🎯 TP3: 2,660
🟢 SL: 2,420
ETH reversed sharply off the 2,403 low, breaking above MA(7), MA(25) and MA(99) with a massive green candle on huge volume confirming strong buyer interest. Price has snapped out of its downtrend, signaling a fresh shift in momentum. As long as it holds above 2,460, continuation toward the 2,600 zone looks likely.
⚠️ This is not financial advice. Always do your own research (DYOR).
#LearnWithGM
post-image
ETH+4.09%
$BTC $ETH 9.11 Evening (Bitcoin, Ether) Market Outlook
The evening CPI data is about to be released, and the short-selling strategy provided this afternoon based on the market action has already played out. The Bitcoin short entered at 77400 saw the price drop to 76700, capturing 700 points; Ether entered at 2480 fell to a low of 2450, securing 30 points. Friends who followed the setup have already gained considerable short-term profits. The overall weak trend has yet to reverse, so the strategy of shorting rebounds at higher levels remains unchanged. A large amount of capital is currently sta
post-image
BTC+1.09%
ETH+4.04%
$BREW Let's pull out—this kind of market manipulation...
post-image
BREW+87.99%
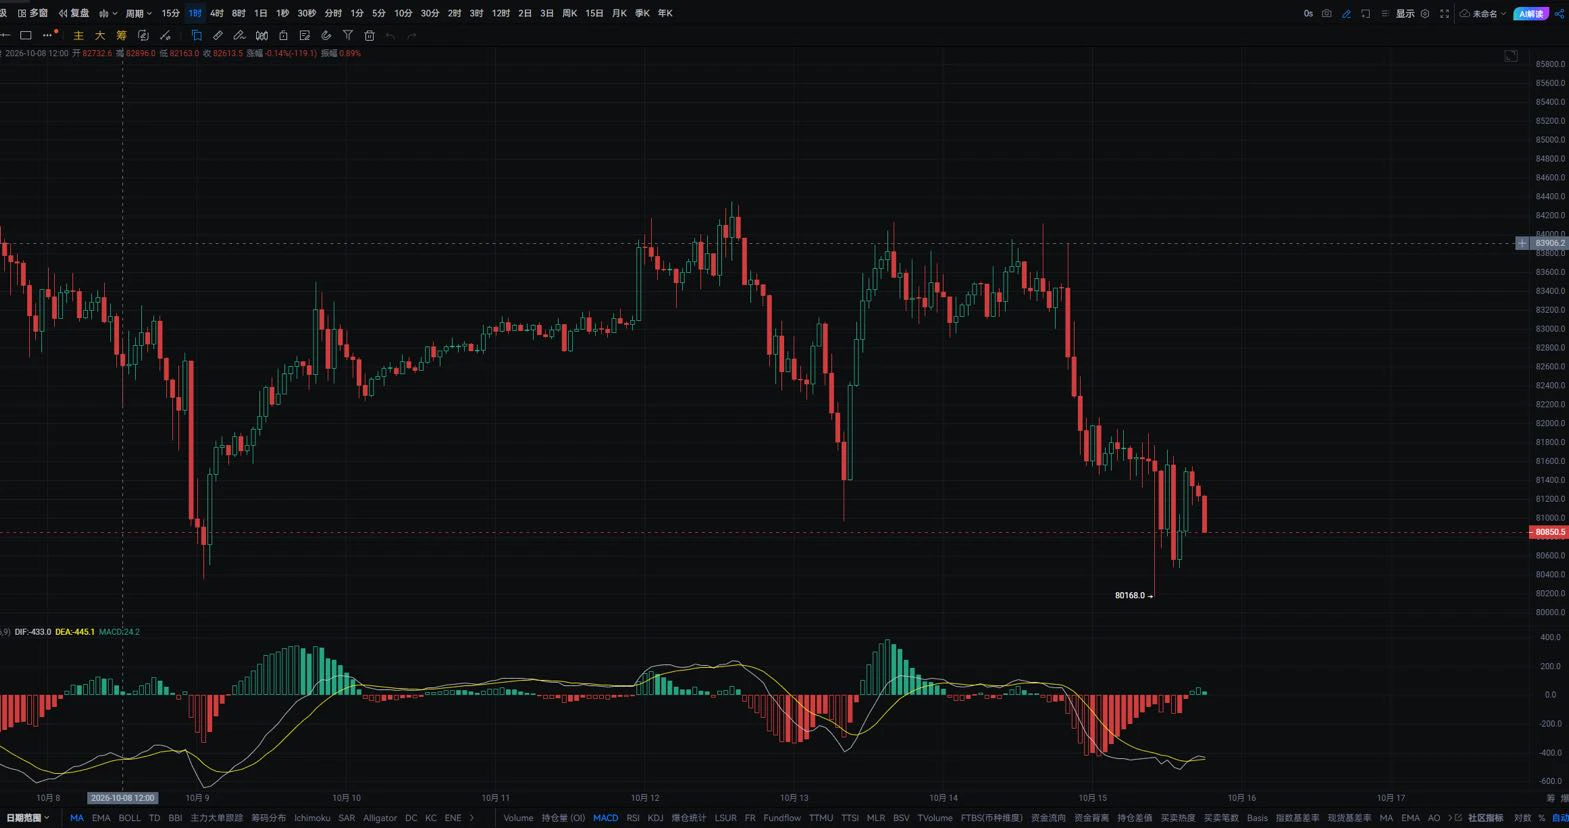
🚨 Bitcoin faces key levels ahead of CPI. A liquidity sweep above $81K trapped buyers, followed by a descending wedge pullback. Holding $76K–$77K could trigger a rebound toward $81K, while losing support risks $72.5K. Buying this dip or waiting? #Bitcoin #BTC
post-image
BTC+1.09%
$ETH is trending towards a candle close below the trending dots similar to Bitcoin yesterday.
ETHUSDT
Perp
2,499.16
+3.07%
Large liquidation level at $2,200, several reasons for the yellow target box.
How many targets get hit?
post-image
ETH+4.09%
BTC+1.09%
September 11, 2026 (Friday) ETH Futures Directional Trading Strategy Reference
ETH is currently fluctuating roughly within the $2,430–$2,460 range (intraday high around 2,480–2,485 and low around 2,430–2,440), retreating from yesterday, following BTC's pullback, and remaining in a generally weak short-term consolidation state.
Brief Market Background
• Macro: Today's U.S. CPI data is the core driver. Yesterday's stronger-than-expected PPI, elevated oil prices, and rising bond yields put overall pressure on risk assets, with ETH weakening in tandem.
• Technical: The medium-term structure rema
post-image
ETH+4.09%
$ADA Signal】1H price hugging the lower band, 4H bearish momentum continuing to expand
$ADA The 1H price is running at 0.2024 along the lower Bollinger Band, while the 4H MACD histogram continues to expand, with bearish momentum yet to converge. The 1H RSI is 30.67 and the 4H RSI is 35.02, with both timeframes entering oversold territory, while a bullish divergence structure has yet to form. The buy/sell ratio over the last six 1H candles was 0.38-0.47, with aggressive selling continuously suppressing rebounds. Order book depth imbalance is 3.83%, with sparse buying support. The funding rate i
ADA-1.14%
BTC+1.09%
ETH+4.04%
SOL+2.21%
This CPI seems to have echoed what the cited article said: headline CPI is bleeding into core CPI, and it was all propped up by the energy component.
As for risk assets, they spiked and rebounded upon the data release, then returned to the range—this is getting really interesting.
Is this the legendary “bad news is good news once it hits the market”?😆#cpi
post-image
XiuHu_charts
It’s Friday—time to welcome a wonderful weekend!
Bessent set a $6 billion cap for this long-term debt buyback, but it seems the full amount wasn’t purchased. The Treasury actually accepted about $5.19 billion in face value.
The market feels the stance was not decisive enough; operationally, it looks more like some bids were not suitable enough, so the full amount was not accepted. U.S. Treasury yields are still holding at elevated levels.
This operation targeted maturities of 10–20 years, with more operations to come. As for whether the cap will be raised and how much will actually be repurchased, we’ll have to wait for the announcement, because this is not fixed.
CPI will be released tonight, and the market is eagerly awaiting it. It is also the final data release of the week.
Many people are curious: Why does core CPI exclude energy, while the market keeps saying energy is pushing inflation higher? Headline CPI includes energy; the media generally means headline CPI when it says this.
Crude oil is not directly included in core CPI, but it can be transmitted indirectly through costs and push prices higher.
Core CPI excludes crude oil simply to filter out short-term volatility; this does not mean we can ignore the fact that it remains a basic energy cost for society.
So it is fine to focus mainly on core CPI, but we also need to see whether headline CPI is feeding into core CPI.
If I had to assess tonight’s data, I think the odds favor a somewhat bearish outcome.
After all, yesterday’s PPI was relatively high. Although it was not explosive, oil prices breaking above $100 is also right there and cannot be ignored.
Looking more closely:
A core month-on-month reading of 0.3% would be genuinely hawkish,
core at 0.2% with headline CPI pushed higher by energy would be neutral, though sentiment could still remain tense,
and core at 0.1% would provide relatively more room to breathe.
Therefore, even if the released figures are not particularly bearish, the market will most likely still worry for a while—that is a matter of sentiment.
What is more worth watching now is not just the data itself, but how relevant officials respond to reassure the market if CPI really comes in above expectations.
Because Bessent has recently said that oil prices will fall significantly after the Iran-Israel war ends, and even mentioned $40–50!
The fact is that prices first broke through the $100 threshold.
They are verbally trying to suppress oil prices, but prices moved in the opposite direction first. The market will not pretend not to notice this contrast.
To sum up my view: After yesterday’s PPI release, the market raised expectations for a September rate hike. The current situation is that oil prices have broken above $100 and U.S. Treasury yields remain elevated. If core CPI comes in above expectations tonight, September rate-hike expectations will be raised another notch.#8月CPI今晚公布
repost-content-media
  • 1
Which is the one to reach 100M next?
post-image
bros that created pvp, bundled new shitcoins, complaining about pvp inside and outside their chain
post-image
PVP+15.85%
$XAU USDT Long Setup
🔴 Entry: 4,355 - 4,380
🎯 TP1: 4,405
🎯 TP2: 4,425
🎯 TP3: 4,450
🟢 SL: 4,330
Gold reversed sharply off the 4,295 low, breaking above MA(7) and MA(25) with a strong green candle confirming buyer interest returning. Price is snapping back toward the MA(99) resistance after a multi-day pullback from the 4,451 high. As long as it holds above 4,340, momentum favors a push back toward the recent highs.
⚠️ This is not financial advice. Always do your own research (DYOR).
#LearnWithGM
post-image
XAU+0.64%
Load More

Join 40 M users in our growing community

⚡️ Join 40 M users in the crypto craze discussion

💬 Engage with your favorite top creators

👍 See what interests you

View More