Square
Following
Hot
News
Notifications
Profile
Share your thoughts
placeholder
Article
$BTC This is not first time for me. I experienced similar setup in past.
BTC-0.67%
  • 1
Bitcoin Price Action Explained on Lower Timeframes
live-cover
LIVE1,015
Trenches
FOOD
F
bade
b
FOOD
FTu5...pump
Market Cap
$.
Change
.
24h Vol
$.
Holders
.
mihao
m
bade
b
mihao
4Cxj...pump
Market Cap
$.
Change
.
24h Vol
$.
Holders
.
AGT
A
bade
b
AGT
0x5d...e274
Market Cap
$.
Change
.
24h Vol
$.
Holders
.
IDOL
I
bade
b
IDOL
0x3b...ab07
Market Cap
$.
Change
.
24h Vol
$.
Holders
.
Sakura
S
bade
b
Sakura
9sFG...pump
Market Cap
$.
Change
.
24h Vol
$.
Holders
.
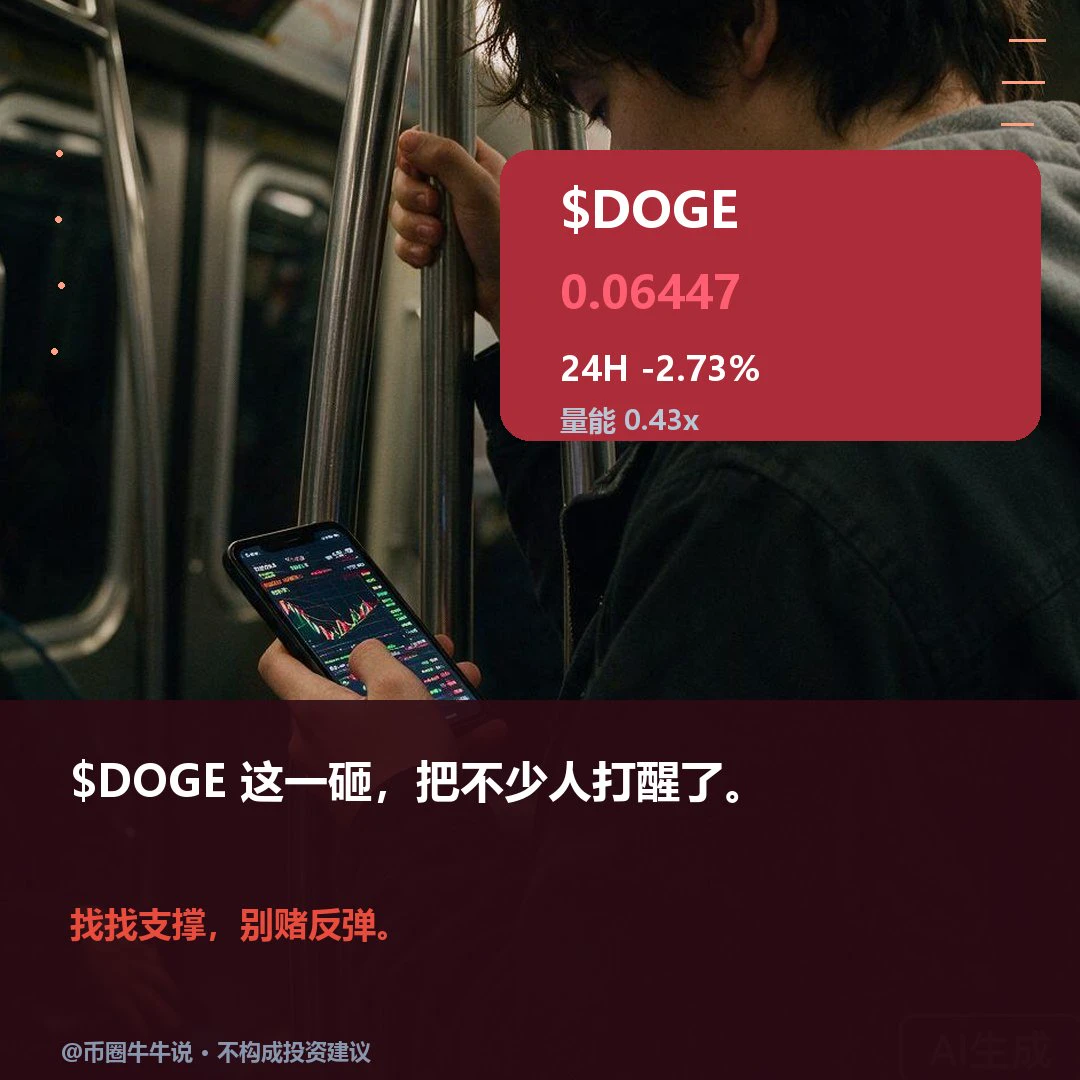
$DOGE Currently trading at 0.06447, down 2.73% over 24H (range: 0.06301–0.0667). The 1H trend is weak, with an RSI of 49; the 4H trend is weak, with an RSI of 29. If it breaks above 0.0667 decisively, watch for further upside. If it falls below the 0.06301 support, the short-term structure may weaken. The market is volatile; for observation only.
post-image
DOGE-0.22%
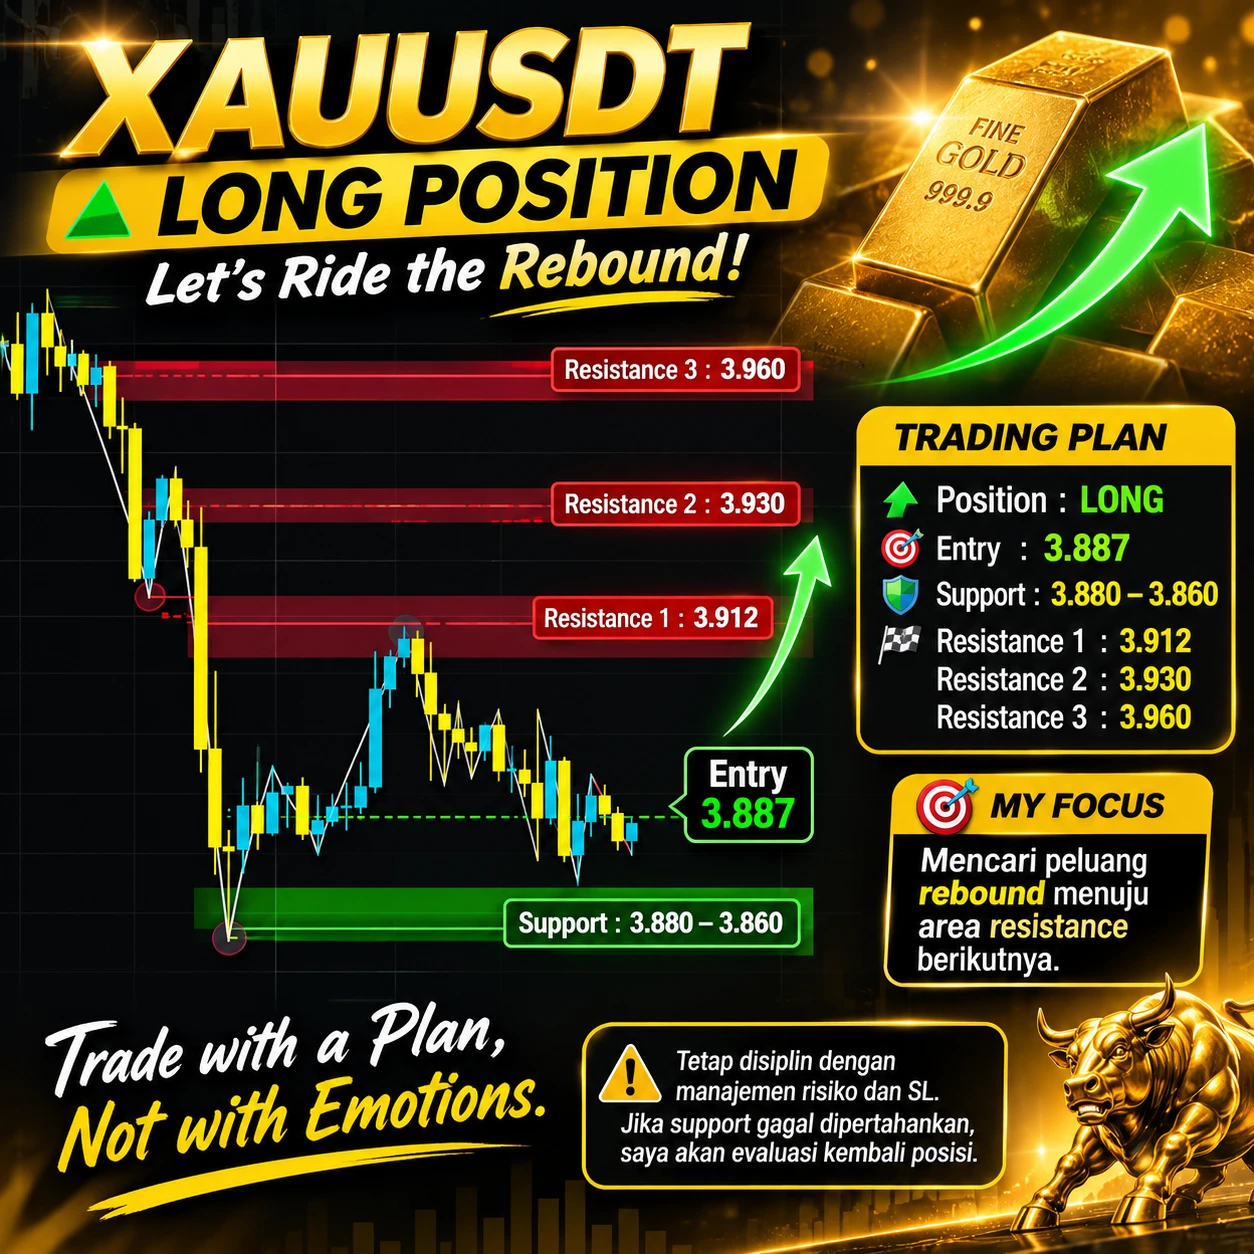
🚀 $XAU ‌ | LONG POSITION**

Gold is beginning to show potential for consolidation after experiencing fairly strong bearish pressure.

I’m taking a **LONG** position, watching the price reaction in the support area around 3.880–3.860.

📊 **Trading Plan:**
- Position: LONG 🟢
- Entry: Area 3.887
- Support: 3.880–3.860
- Resistance 1: 3.912
- Resistance 2: 3.930
- Resistance 3: 3.960

🎯 My focus is to look for a rebound opportunity toward the next resistance area.

Stay disciplined with risk management and SL. If support fails to hold, I’ll reevaluate the position.

**Trade with a plan, not w
post-image
XAU+0.38%
  • 3
robotics when GTA5 dropped (2013) VS robotics when GTA6 drops (2026)
post-image
$BNB Short thesis update:

On the 4-hour timeframe, the key zone to watch is 635.6–636.8. I’d like to see price push into this zone and get rejected clearly. If it rebounds and moves back above 643, I’ll exit this short. The current structure still favors sellers.
Price is around 636, below the 4-hour EMA50 (676), with bears in control of the momentum. The daily chart is also capped below the EMA200 (688), further reinforcing the bearish view.
🔴 Short · Entry 635.6–636.8 · Take profit 632.1 / 629.4 / 625.3 · Stop loss 643.0
Do you think this level will hold, or will price break straight throu
post-image
BNB-0.72%
#晒出我的持仓收益 ETH trades have been going pretty smoothly. Copy the trades I open, and learn to watch your take-profit yourself. Keep an eye on it, and take profit when it can’t go any lower. I’m going to sleep. I’ll end the livestream for now and stream again when I wake up. We’ll make money again after I wake up
post-image
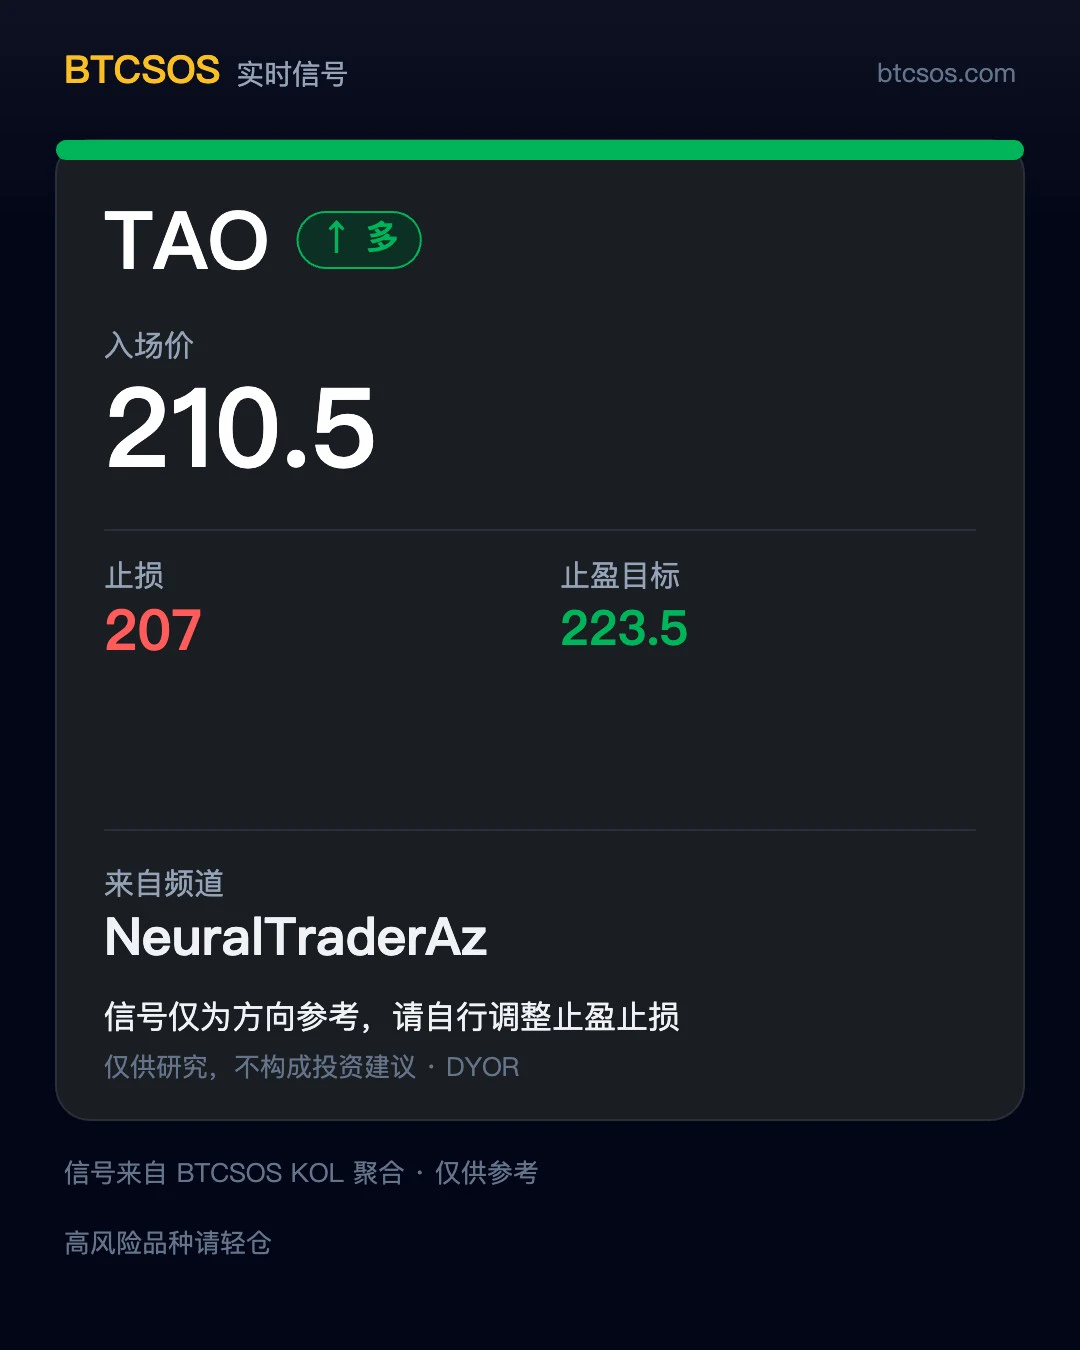
📡 Signal Card | Source: NeuralTraderAz
Asset: $TAO Long entry: 210.5 Target: 223.5 Stop loss: 207 Time: just captured (no specific time indicated)
By the way, I just reposted this person's $BZ trade earlier today, and here they are again—very diligent 😂
As always, I only repost signals; I don't vouch for their authenticity or P&L. Whether to follow and how much to invest is up to you all. Don't let risk management go out the window 💅
Personal record shared for reference only; not investment advice. #MARA sells nearly 14,000 BTC—are miners changing their long-term BTC hoarding strategy?
post-image
TAO+0.41%
MARA-2.78%
BTC-0.67%
larping as a nepo today (i’ve never golfed a day in my life)
cc: @mung0x @RajPatel @NotSoEasyMoney
$ARX 's 1-hour RSI has surged into extreme overbought territory. As the price neared its intraday high, momentum noticeably stalled—a setup that often gives bears a good opportunity to lie in wait. Once the pullback signal was confirmed, this trade netted a 74% gain. 📉⚡

Profit: $23

Keep a close eye on how $SOPH and BTC perform next.
Bearish setup: Catch this spike-and-reversal move on $ARX . Entry range: 0.2311 - 0.2362 Targets: 0.2200 / 0.21 Stop-loss invalidation level: 0.2456
A parabolic rally eventually needs a breather. The RSI hit 93 and stalled near the highs—that's clearly a trap f
post-image
SOPH-3.83%
It's cute watching perma bulls trying to find every little reason to remain bullish whilst the chart tells the actual truth
Field week for bears
$BTC
post-image
BTC-0.67%
#黄仁勋辞职 Bitcoin (BTC) Price Analysis: Market Crash, Critical Support Levels and Recovery Outlook – November 14, 2026

Bitcoin is facing renewed selling pressure after dropping below the important $70,000 psychological level. The latest correction has increased uncertainty across the cryptocurrency market, with traders watching institutional ETF flows, inflation concerns, and leveraged liquidations.

BTC recently traded around $68,900, putting the $67,000–$68,000 region in focus. The coming sessions could be important in determining whether Bitcoin starts a recovery or continues its downward mov
post-image
BTC-0.67%
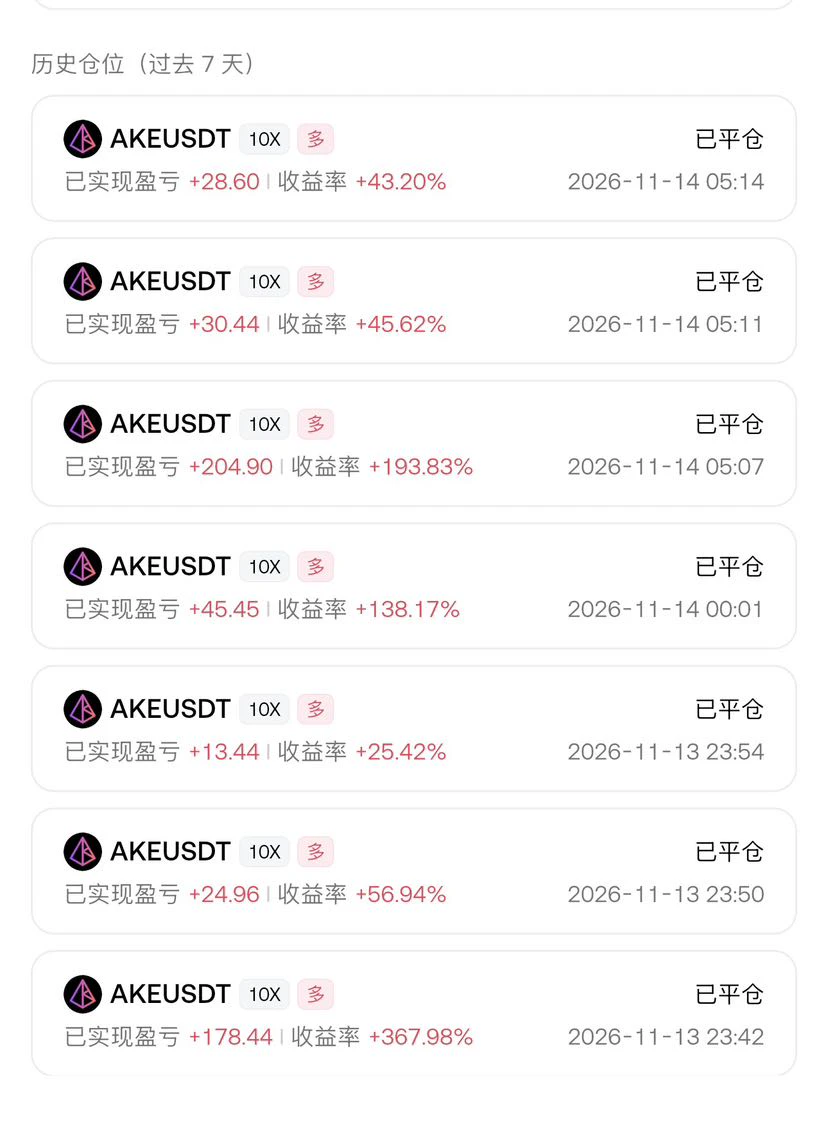
$AKE Earned a little bit more again
post-image
AKE+6.07%
  • 2
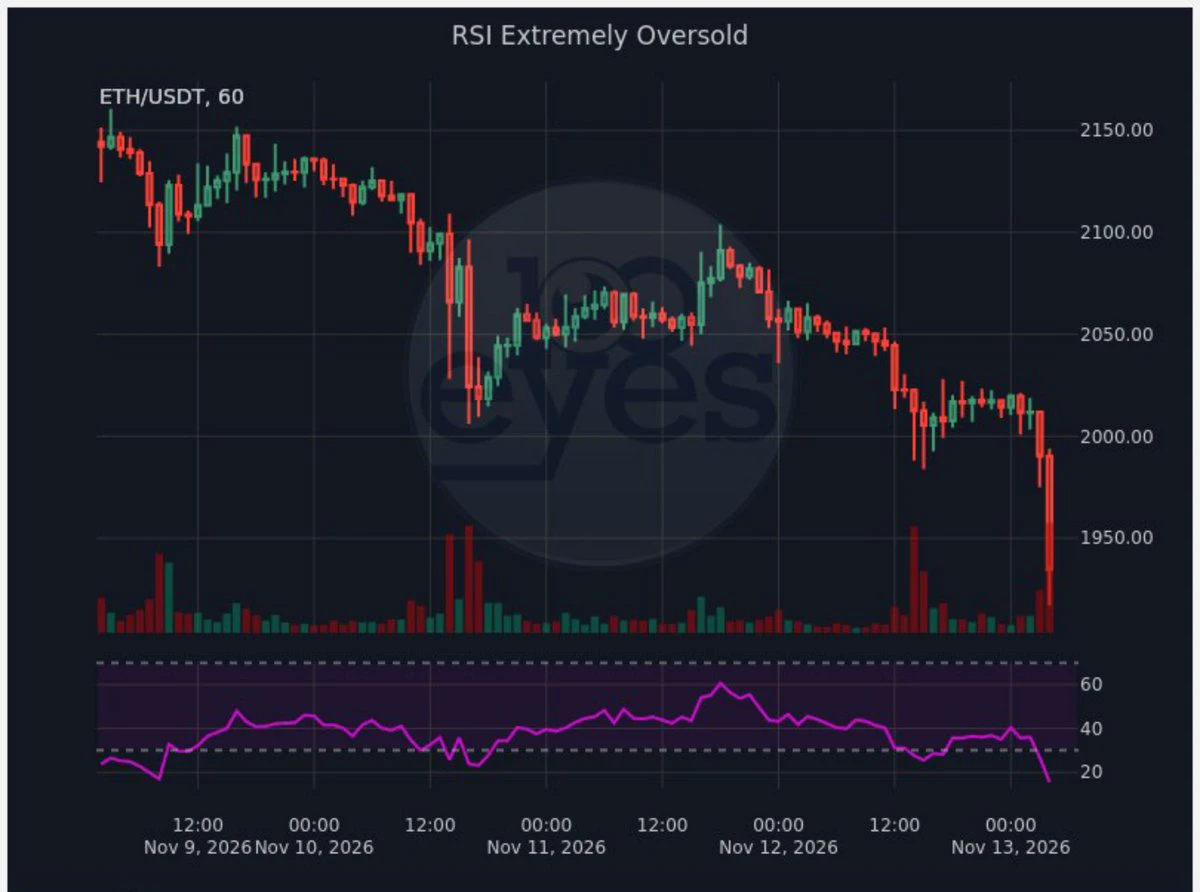
Ethereum has become deeply oversold on the hourly timeframe 📉
Is a rebound near, or is there another drop before recovery? 👀
#ETH #Ethereum
post-image
ETH-1.26%
I was planning to go to bed early last night

But this Fed semiannual report kept me scrolling and wide awake

The Financial Stability Report includes a survey

Of 23 market contacts in the fall

87% named AI as a top risk

It was still 50% this spring

Now it ranks first

They’re concerned about three things

High valuations: disappointing results could trigger a pullback

AI could also be used for cyberattacks

And increasingly complex AI financing structures

The debt figures are more striking

By October, debt issuance related to advanced computing had exceeded $680 billion

The total for
post-image
BTC Price Action Breakdown (Educational)
live-cover
LIVE1,024
The bull market is canceled guys
Thanks for playing
$BTC
post-image
BTC-0.67%
👀 WHICH #CRYPTO GEM HAS THE POTENTIAL TO GO 1000X? 🚀💎
The next big opportunity might be hiding in plain sight!
👇 Drop your strongest $TICKER. Let's see which community has the most conviction! 🔥
#1000x #Crypto #Altcoins #Memecoins
post-image
📉 Macroeconomic pressure compounded by a technical breakdown

On the 4H chart, BTC broke below its previous low on heavy volume, hitting a low of 67,444.3 and currently trading at 68,571.2. The market is showing the following signs of extreme weakness:

1. Bearish moving averages overwhelm price: EMA5 through EMA30 are fanning downward in a waterfall pattern, with price firmly pinned below all moving averages and no strength to rebound.
2. Break below the lower Bollinger Band: The candlestick body plunged straight through the lower Bollinger Band (67,601.7), leaving price in an extreme breakd
post-image
BTC-0.67%
Load More

Join 40 M users in our growing community

⚡️ Join 40 M users in the crypto craze discussion

💬 Engage with your favorite top creators

👍 See what interests you

Trending Topics

JensenHuangResigns

537.1K Views8.7K Discussing

Jensen Huang has resigned as NVIDIA CEO and stepped down from the board. CFO Colette Kress will serve as interim CEO while NVIDIA considers internal and external successors. $NVDA fell more than 10% in premarket trading following the announcement. With one of AI’s most influential leaders stepping aside, markets are now reassessing NVIDIA’s leadership stability, AI strategy, and long-term valuation.

GateIPOAccessAnthropic

293.3K Views2.7K Discussing

Dr.HanOxfordUnionSpeech

146K Views526 Discussing

View More