Square
Following
Hot
News
Profile
Share your thoughts
placeholder
Article
I’m fucking here to watch Resident Evil
Alone by myself
And also alone by myself
post-image
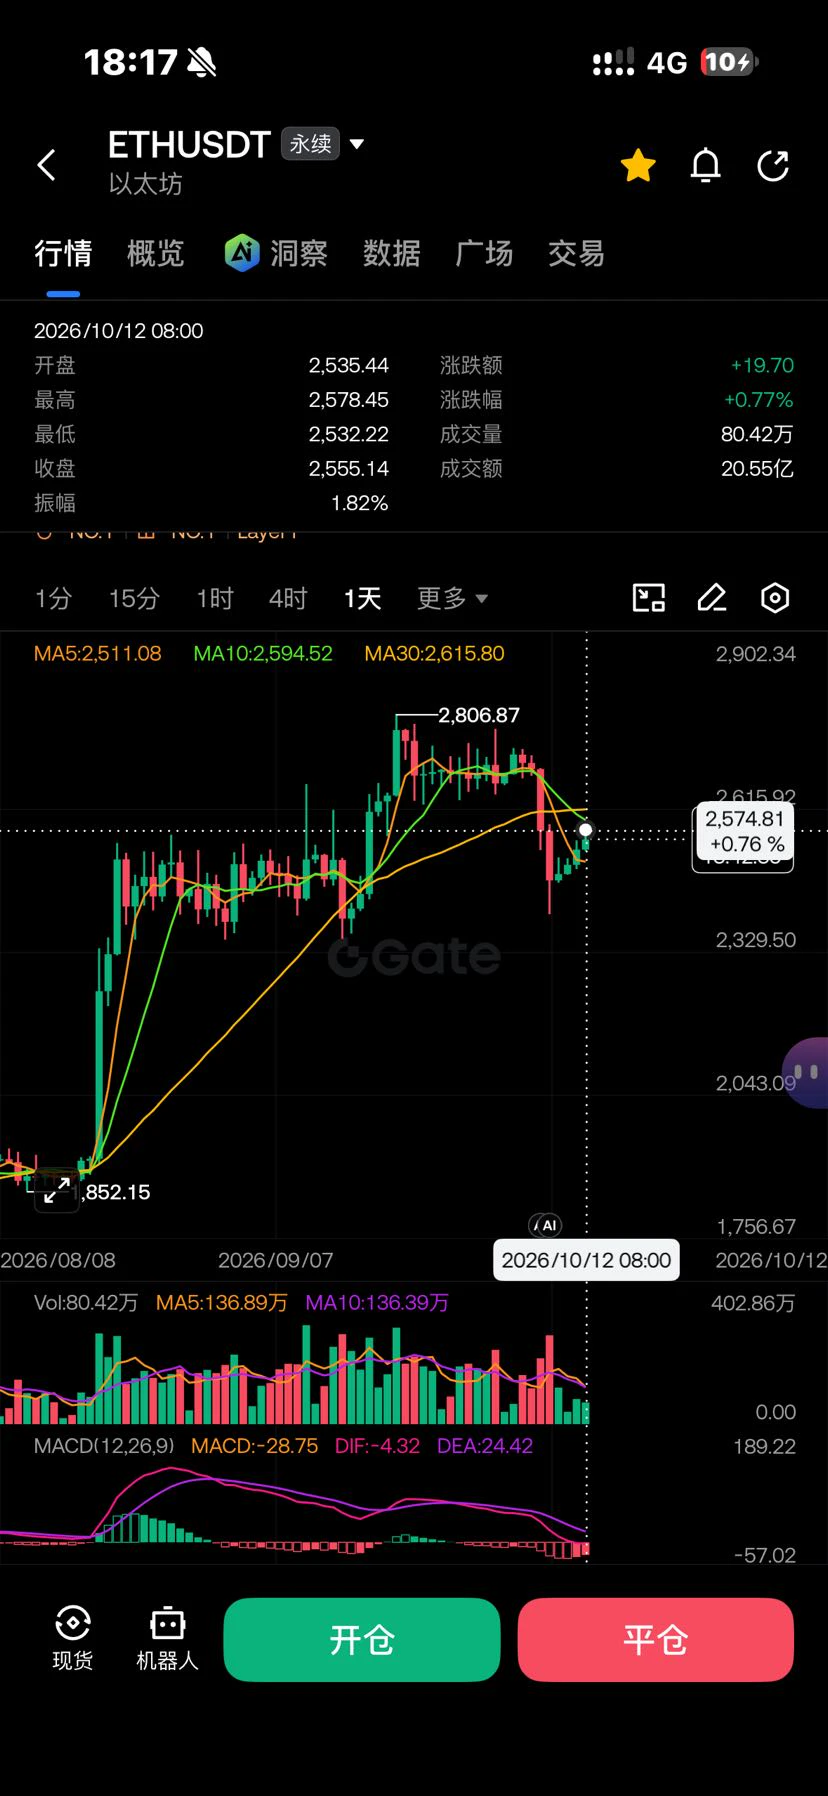
Around 2570, there is daily-chart-level resistance; above, around 2590, is resistance at the 10-day moving average. Overall resistance is considerable; a breakout would require a synchronized rise across global markets. Beware of a false breakout caused by divergence
post-image
  • 1
Can you really never go long on a coin with a bearish moving-average alignment?
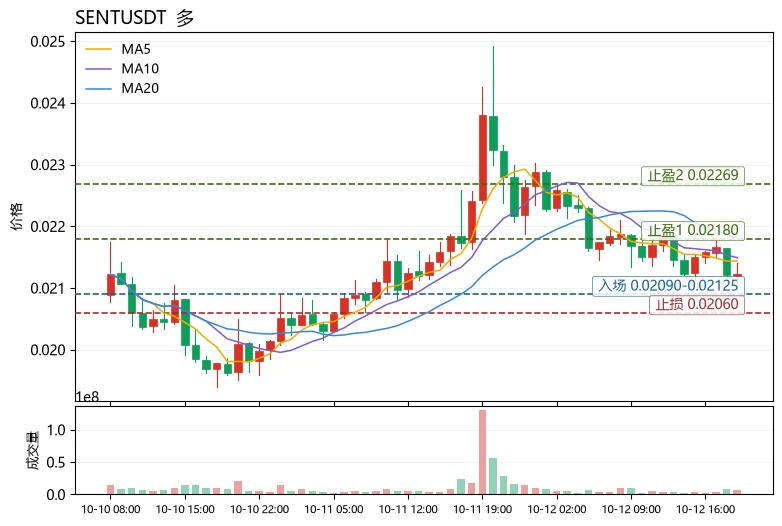
Not necessarily. The key is to look at the price’s position within the Bollinger Bands and the direction of the funding rate—that is exactly the lesson $SENT is worth discussing right now.
First, look at the trend structure: $SENT is currently priced at 0.02123, with MA5=0.021436 below MA20=0.0218025, a standard bearish alignment. The MACD histogram is negative, so the trend is indeed weak, which is an “unhealthy” signal. But two details change the conclusion: first, RSI=43.3, in a neutral-to-low range rather than
post-image
SENT-11.02%
KAIA-10.81%
LUMIA-24.91%
Trump’s words boil down to one sentence: The winner of the AI race takes all, and the US isn’t slowing down. The problem is that with superintelligence, it’s not whoever moves first who wins—it’s whoever can control it. We’re still struggling with our compute bottleneck, while they’re already talking about how not to hit the brakes. The gap isn’t in the models, but in the underlying chips and electricity. Maybe I’m wrong. We’ll see if I get proven wrong.
post-image
$RED Short strategy… sell in the 0.1750–0.1800 supply zone
RED has rebounded strongly from its low, but I would not chase the price after this rapid rally. My preferred short-selling zone: Entry: 0.1750–0.1800 Take-profit 1: 0.1680 Take-profit 2: 0.1570 Final target: 0.1500 Stop-loss: 0.1985 This strategy is based on the possibility that after a sustained upward move, the price may sweep liquidity to the upside and enter the upper supply zone. If the price reaches the entry zone and begins to show signs of rejection, I expect it to revert to the mean and move lower. If the price breaks above
post-image
Samsung Electronics and SK hynix both tumble—does the AI chip thesis still hold? Don’t rush to bottom-fish Korean stocks and pay tuition
Korean stocks suddenly plunged, with Samsung Electronics and SK hynix becoming the market’s focal points. For investors who have remained bullish on the AI industry chain, this decline is undeniably tempting: they were previously afraid to buy because prices were too high, but now that prices have finally fallen, has the opportunity finally arrived?
I believe the key is not how much prices have fallen, but whether the core logic behind the rally has changed.
MU-0.69%
  • 2
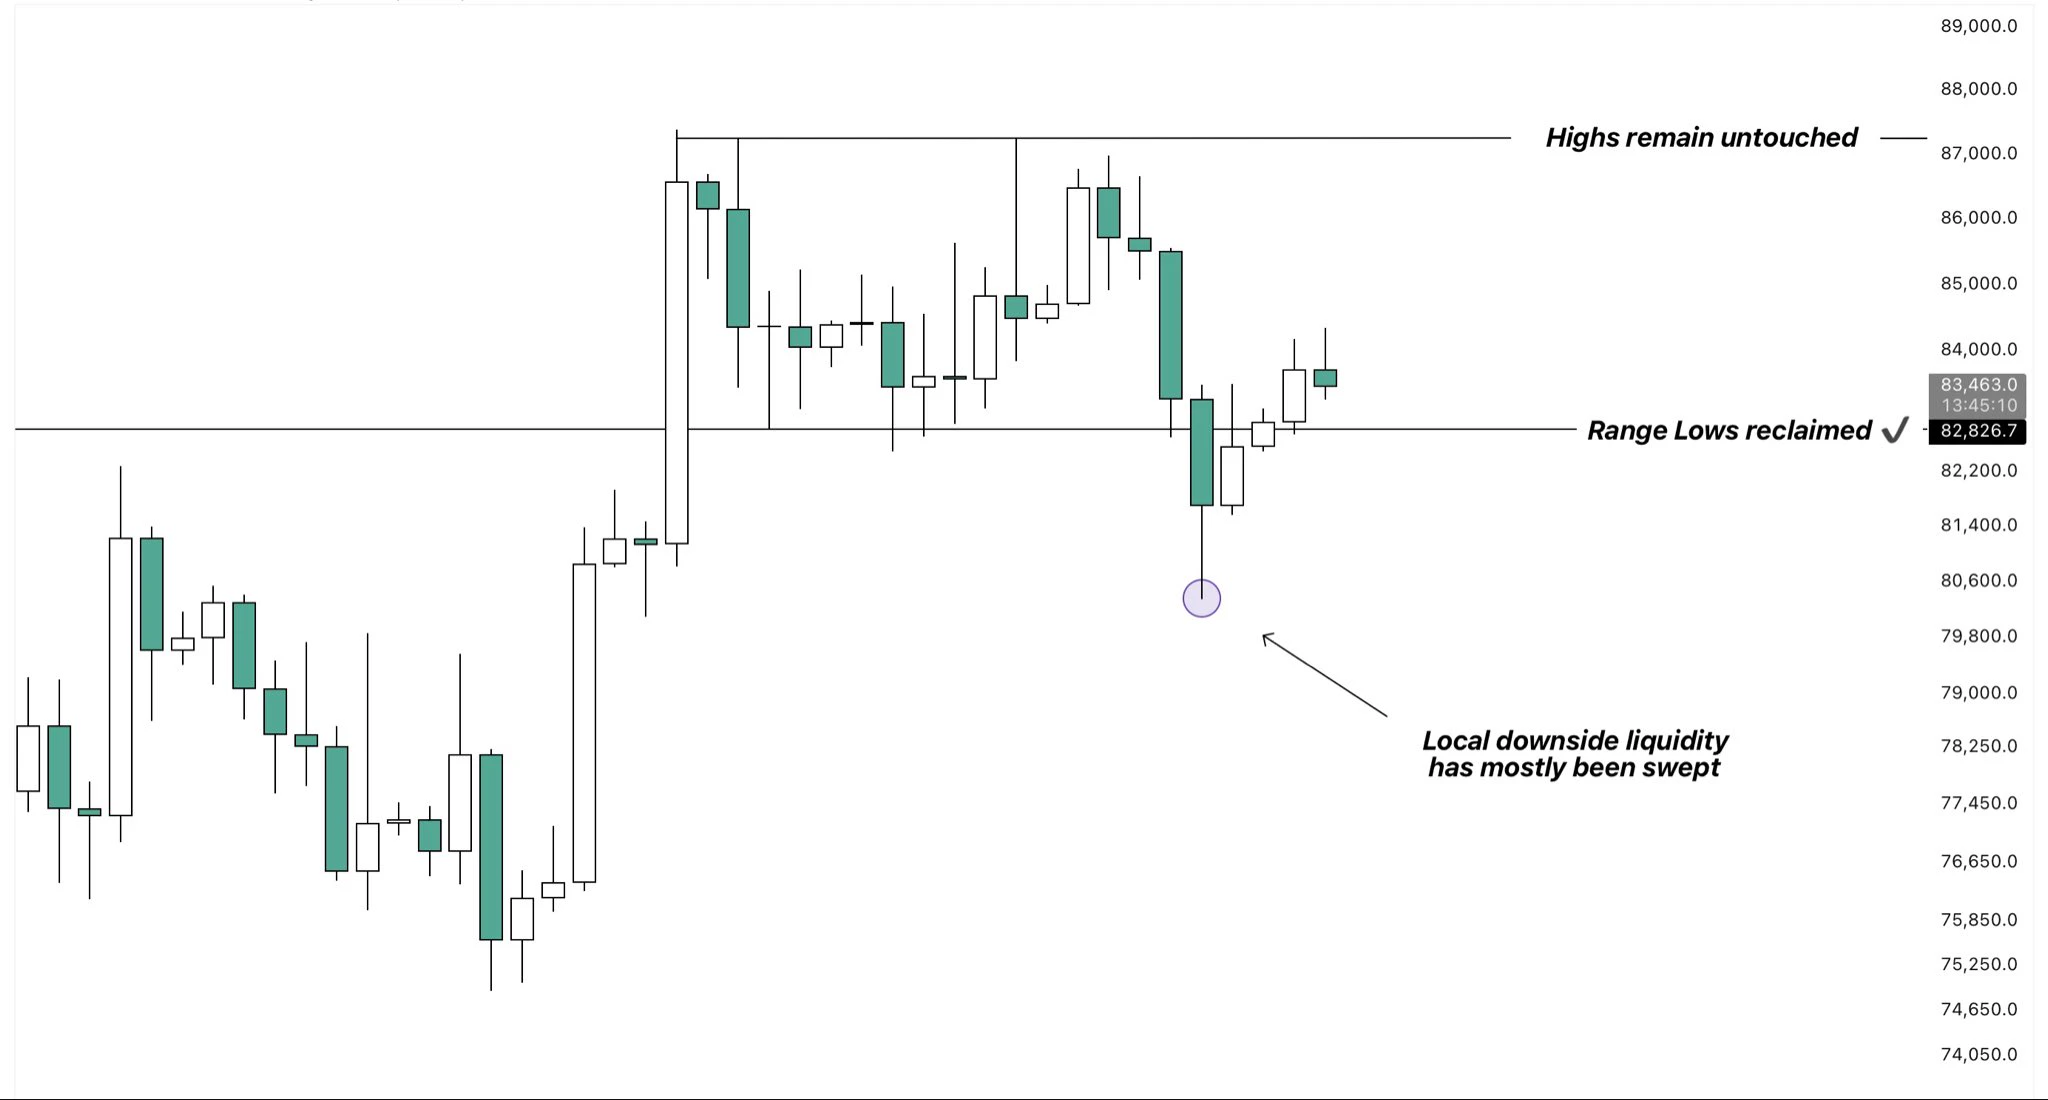
$BTC Deviation complete
Over the past week, we saw an aggressive selloff, with which most of the local downside liquidity got hunted
out.
However, buyers then quickly stepped in around the $80k to $81k area, pushing price back above the range lows.
With yesterday’s weekly close being well above the previous swing high, this is exactly the bullish weekly close I’ve been talking about.
The range lows have now successfully been reclaimed, which opens the door for another push towards the unswept highs, which should become our main target over the coming weeks.
They have constantly been front ru
post-image
BTC+0.42%
  • 1
  • 1
After a short holiday,
my state has become like this,
I don't want to socialize or go out🤣
post-image
#Gate每日交易分享 This is tough—after the choppy market action, is it headed down or up, does anyone in the know have any idea
post-image
Market update BTC
live-cover
LIVE1,992
Y'all might have missed this but $BTC is up 45% from it's previous low this year.
Above $84k and it is looks like those heavy ETF outflows never happened.
Oil is slipping too, so that is taking a bit of pressure off the macro picture.
Alts are climbing too but there is still an air of uncertainty. No one knows if we are bull or bear... yet.
The next big catalyst could be the inflation data coming on the 14th.
post-image
BTC+0.40%
Financial News, Crypto Updates, Real Trading Strategies
live-cover
LIVE1,787
$BTC
cut its position by 5.4%, but is still stubbornly holding on in the 57.8% long pile. Who can that mere 0.47% red candle on the 4-hour chart fool? Everything above 84000 is just bagholder liquidity; any spike is where the shorts haul in their nets. Another push would just be giving away profits.
post-image
BTC+0.40%
$POWER The afternoon trade has hit TP1. Guys, quickly check whether the money has arrived.🤩🤩
Long, long, long🔥🔥Tp2: 0.088Tp3: 0.091Tp4: 0.096Sl: 0.0805power congabeo$UA $AZTEC
post-image
AZTEC+9.22%
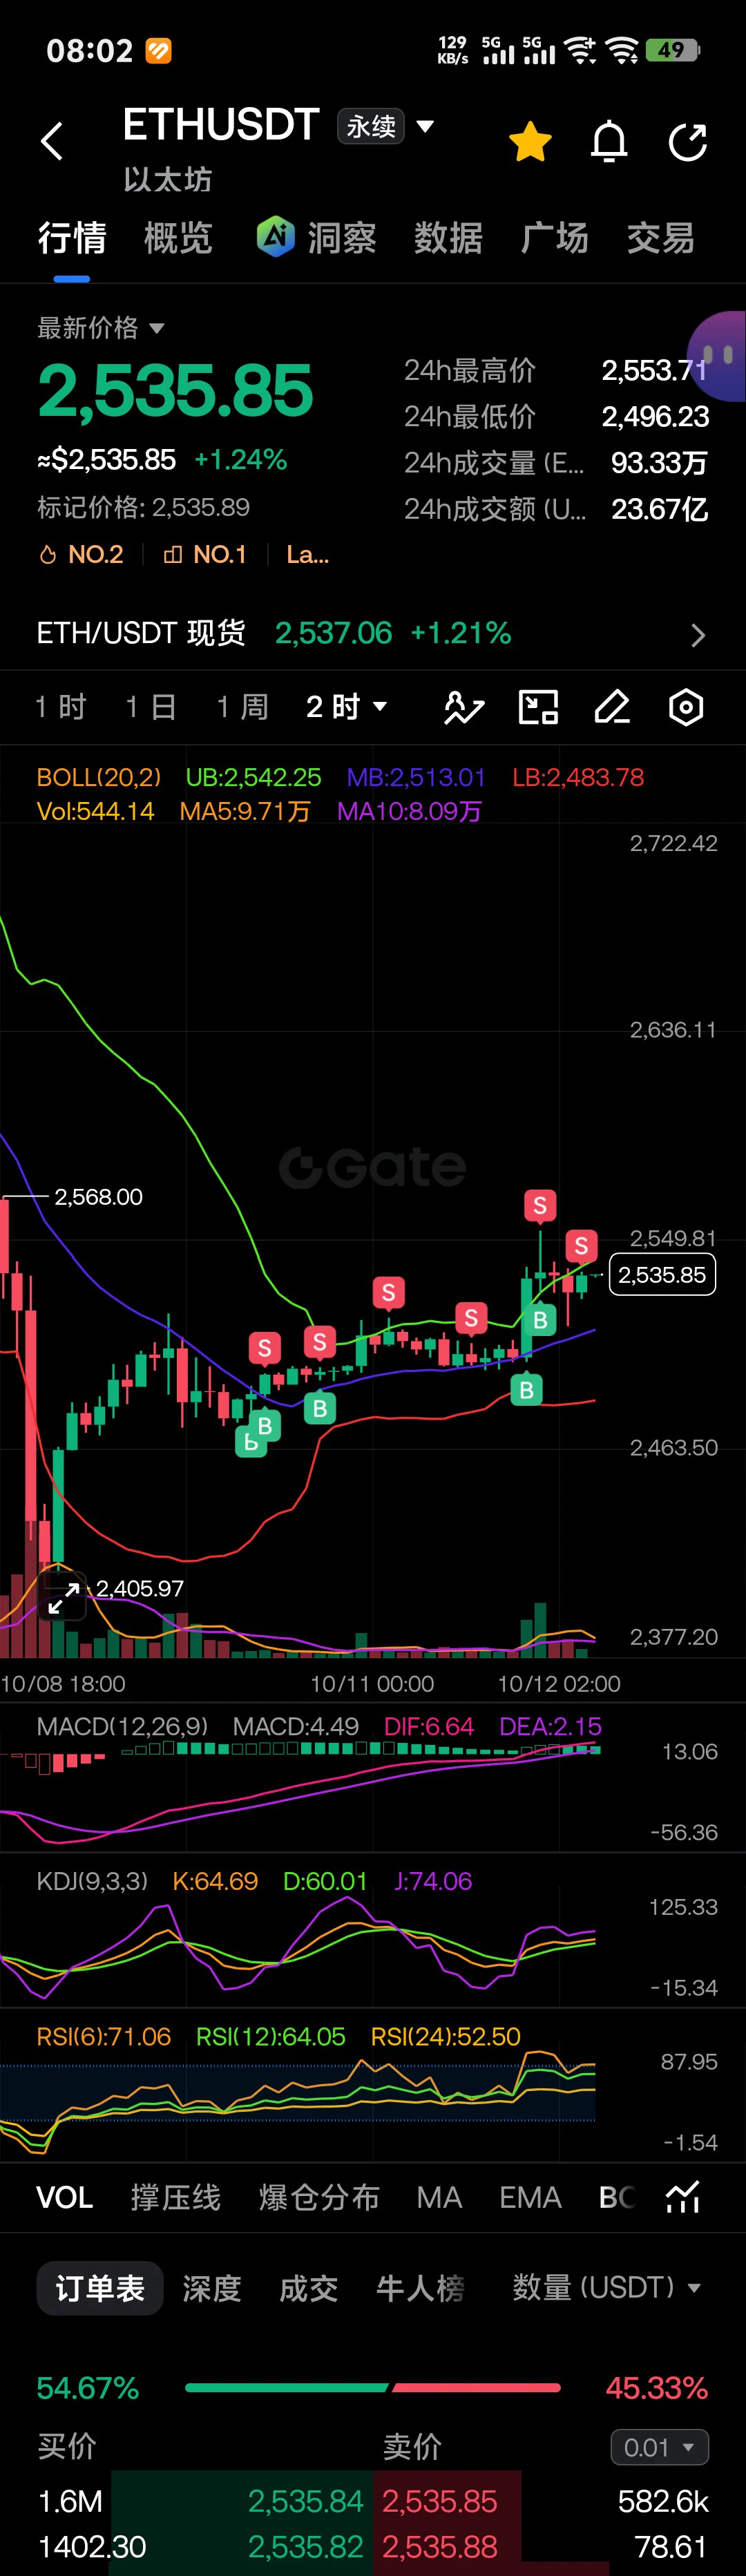
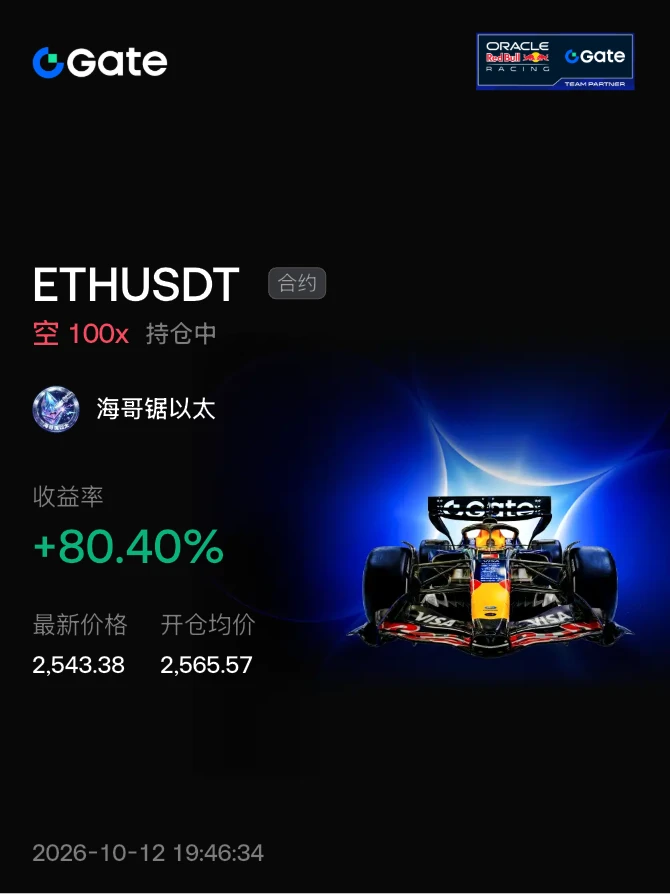
#晒出我的持仓收益 Just wait for take-profit, then wait for a 2517 long position
post-image
Fleeing $2 billion! $ZEC ZEC surges then retreats—is 1307 a golden opportunity or a bottomless pit?
Brothers, candlesticks can lie, but the outflow of real money cannot.
ZEC is currently at 1307. After surging to 1348, MACD formed a death cross at high levels, with the red bars turning green, indicating that short-term bullish momentum has completely run out. The capital flows are even more painful: although the 1D period saw an inflow of $145 million, more than $80 million fled across the 4H and 6H periods combined, while net outflows over 7D/15D reached as high as $2 billion! Although some s
ZEC+5.24%
MU-0.69%
NVDA-0.52%
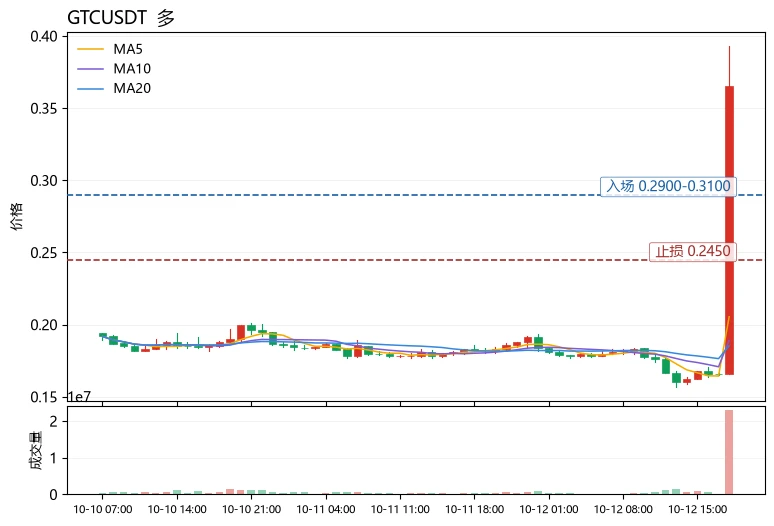
$GTC Short-term bullish, but this is a high-risk contrarian trade chasing the rally, so the position must be kept to a minimum.
Conclusion first: GTC surged 99.92% over 24h to 0.36565. The price has broken above the upper Bollinger Band at 0.269612, while RSI is as high as 90.1, indicating extreme overbought conditions. The MACD histogram at +0.01165 is still expanding, and MA5 at 0.205464 is far above MA20 at 0.185298. The trend strength is beyond doubt, but the funding rate of -1.5515% shows that shorts are paying to hold positions. This is a typical feature of a short squeeze, and it also
post-image
BTC+0.40%
SUI+1.16%
FIL+12.22%
$BTC
The funding rate is so low that nobody wants to chase, while 83400 is hovering right in the middle of the 7-day range. 4-hour positions were cut by 5.4%; the longer longs hold on, the more dangerous it gets. If it cannot break above 84000, it is a bull trap. That spike is precisely the opening for shorts to close the net.
post-image
BTC+0.42%
Wasn't it said this thing had been crushed, so how did it surge 15% today and recover all its losses? Anyone knowledgeable care to analyze? $SERES ‌
SERES+15.21%
Load More

Join 40 M users in our growing community

⚡️ Join 40 M users in the crypto craze discussion

💬 Engage with your favorite top creators

👍 See what interests you

Trending Topics

GateWCTCS9GlobalTradingCompetition

35.07k Views5.35k Discussing

Gate WCTC S9 Global Trading Competition is officially live, crossing asset boundaries across crypto, stocks, and CFDs with an 8M USDT total prize pool. The Lucky Launchpad guarantees a win every time, new users get a 20 USDT futures voucher upon registration, and the Event Contract PK tournament features a prize pool of up to 400,000 USDT.[👉 Read announcement](https://www.gate.com/announcements/article/102133)

GateXRedBullWinsSingaporeGP

173.06k Views6.44k Discussing

WillYouBuyDipInKoreanStocks

61.5k Views1.78k Discussing

View More