Square
Following
Hot
News
Notifications
Profile
Share your thoughts
placeholder
Article
BTC Trading Psychology: How to Control Greed and Fear?

In BTC trading, many people don’t lose to the market—they lose to their own emotions. Even with a trading plan in place, they often chase prices after a sudden rise and panic-sell after a brief dip. Repeating this pattern again and again makes it difficult to achieve ideal trading results, even with strong technical analysis skills.

First, beware of greed. When BTC rises continuously, many people fear missing out and start chasing prices higher, even adding to their positions beyond their original plan. But a rising market doesn’t mean p
post-image
BTC-0.65%
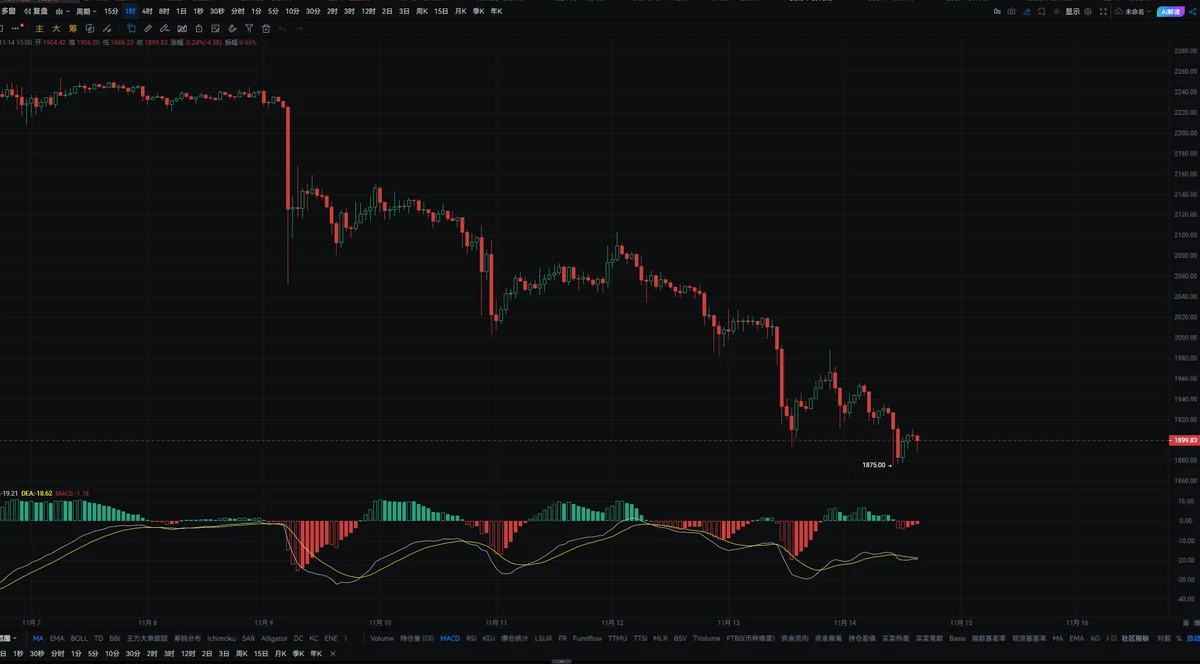
#ETH The current price is 1900. Price action continues to closely track BTC, but with greater volatility, and its weakness is even more pronounced than Bitcoin’s. The first near-term resistance above is around 1960, with a strong resistance zone at 2030. Only a high-volume move above and sustained hold above 2030 would ease the current persistent downward pressure; otherwise, bears are more likely to cap every rebound. Near-term support below is first at 1870, a recent low where buyers have stepped in. If this level fails, the price could fall further to around 1820 in search of support. In te
post-image
ETH-1.26%
BTC-0.67%
  • 1
Trenches
mihao
m
bade
b
mihao
4Cxj...pump
Market Cap
$.
Change
.
24h Vol
$.
Holders
.
IDOL
I
bade
b
IDOL
0x3b...ab07
Market Cap
$.
Change
.
24h Vol
$.
Holders
.
FOOD
F
bade
b
FOOD
FTu5...pump
Market Cap
$.
Change
.
24h Vol
$.
Holders
.
Sakura
S
bade
b
Sakura
9sFG...pump
Market Cap
$.
Change
.
24h Vol
$.
Holders
.
AGT
A
bade
b
AGT
0x5d...e274
Market Cap
$.
Change
.
24h Vol
$.
Holders
.
The downside is low returns…
The upside is extremely high risk resilience. After all, it’s been running live for more than two years, and you can see how many times we’ve had these “shitshow” market conditions over that period…
For example, today the broader market is still a “shitshow,” but that doesn’t affect it—its price movements aren’t positively or negatively correlated with BTC.
Lately, I’ve shifted my focus to MT5. It can’t be as complex as standard quantitative strategies, but it makes up for that by being simple and fast enough…
It’s not like there can be no opportunities in all the
BTC-0.67%
  • 3
Pearl is now on Coinbase, but don't rush to call it the “Bitcoin of the AI era.”
As of November 14 at 14:07, $PEARL was around $1.54, up about 18.5% in 24 hours, with trading volume of about $16.7 million. Coinbase spot trading is officially open. Next, we'll see whether anyone steps in after the hype cools.
These are the things I care about most:
First, the token supply.
About 378.5 million tokens have been issued so far, just 18.02% of the 2.1 billion cap. The team and shareholders have self-reported holdings of about 98 million tokens, less than 5% of the total cap, but about 26% of the cu
post-image
PEARL-2.04%
BTC Position Management: How to Allocate Funds Scientifically and Reduce Trading Risk?

In BTC trading, many people study market direction every day, looking for the best entry and exit points, yet overlook an issue that may be even more important than predicting direction: position management.

Why do some people correctly predict market movements many times, yet their accounts ultimately fail to achieve the returns they hoped for? One reason is poor position sizing. A single oversized trade can wipe out profits from multiple winning trades.

First, determine the risk per trade based on your
post-image
BTC-0.65%
$AKE Up 239% in 24 hours, with $1.3 billion in trading volume, but the Fear & Greed Index reads 88 on my end—extreme greed. The funding rate is +0.18%, and long positioning has surged to an extreme level, in the top 3% of readings over the past three months. Historical comparison: the last time the funding rate topped 0.15% was during January’s meme coin wave, followed by a pullback of over 40% within 48 hours. Technically, 0.0143 is both the 24-hour high and a dense overhead resistance zone where holders are underwater. On-chain data shows large holders have placed plenty of sell orders in th
AKE+6.39%
  • 2
  • 2
Good morning Market update
live-cover
LIVE2,302
How to Build Your Own BTC Trading System: From Random Trading to Consistent Execution

In the BTC market, many people study new technical indicators every day: MACD today, RSI tomorrow, then a new trading strategy the day after. But despite learning a lot, they still have no clear rules when it comes time to place a trade, and end up stuck in a cycle of repeated losses and constantly changing their approach.

To change this, the first step is to build a trading system of your own.

First, choose your trading style. Based on your available time and risk tolerance, choose short-term, swing, or l
post-image
BTC-0.67%
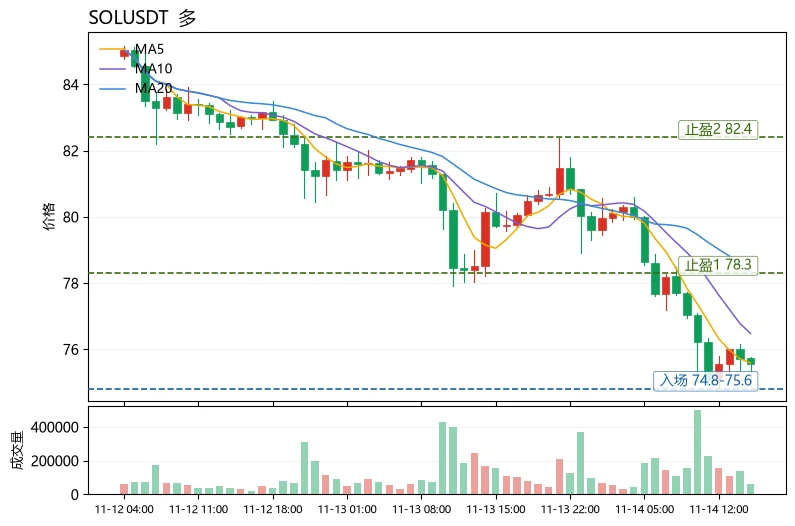
With the Extreme Fear Index at 13 and SOL nearing the lower Bollinger Band, conditions are in place for a short-term oversold bounce. However, the medium-term moving averages remain bearishly aligned, so this is a countertrend rebound, not a trend reversal. The bias is bullish, but keep positions light and trade short-term. $SOL The current price is 75.54, MA5=75.586 remains below MA20=78.3245, RSI=29.7 has entered oversold territory, and the MACD histogram at -0.2501 shows bearish momentum has not faded; however, the lower Bollinger Band at 74.2193 provides support. The funding rate of -0.00
post-image
SOL-0.77%
HYPE+0.24%
Thanks @Turkcell
post-image
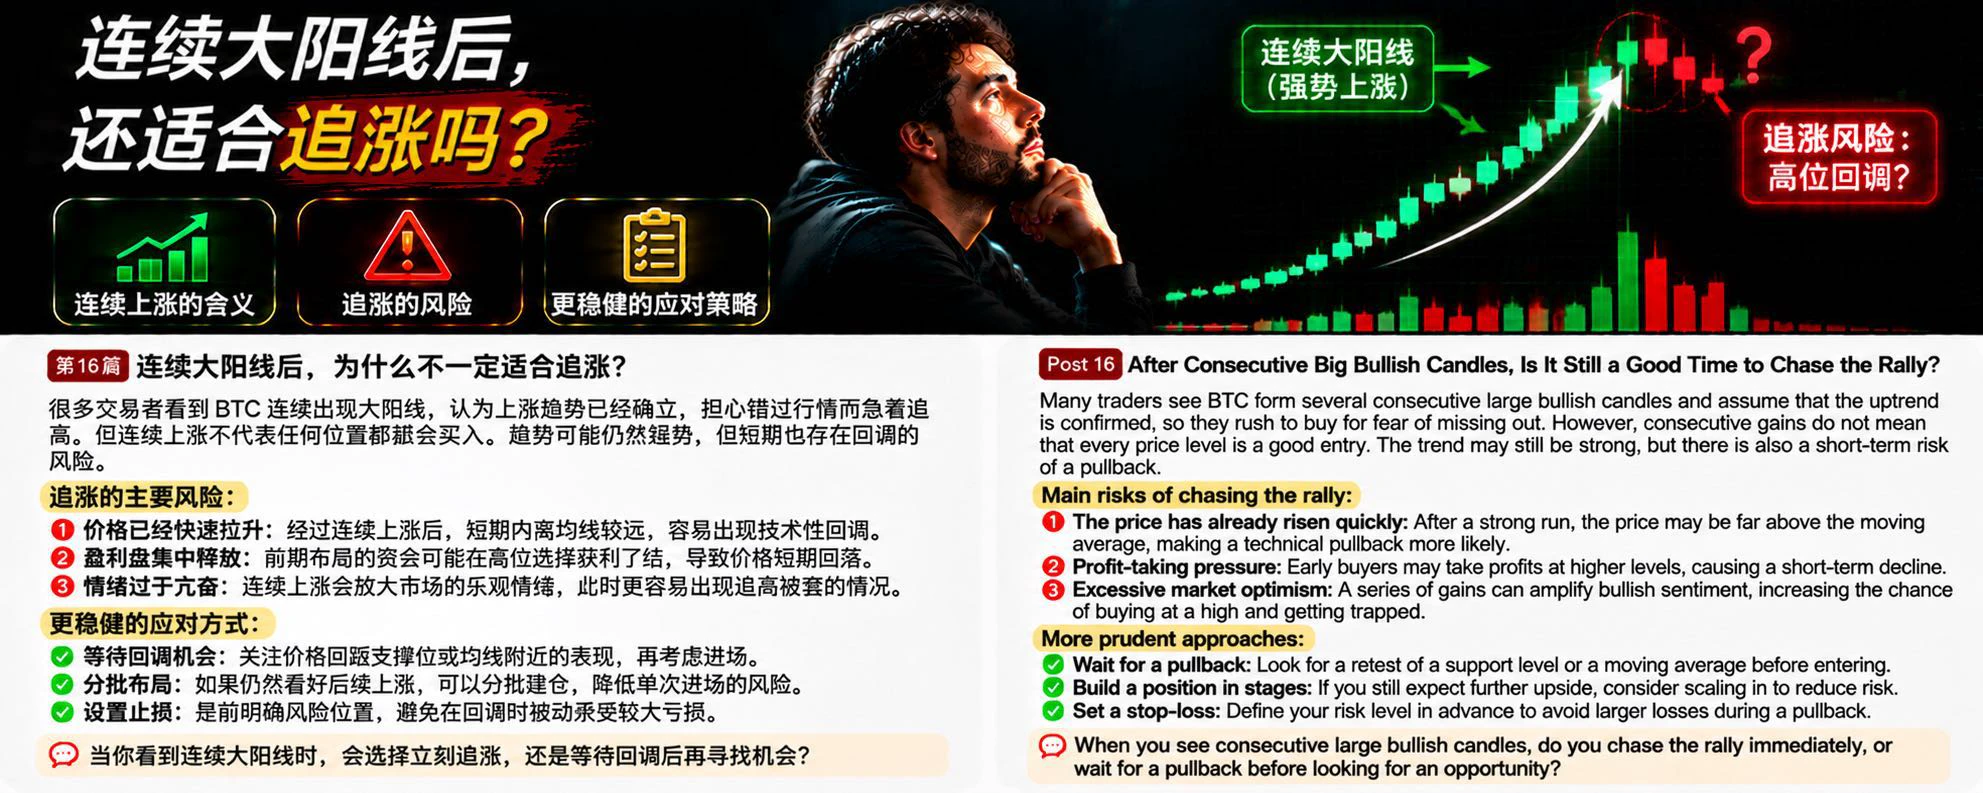
In BTC trading, many people see several large bullish candles in a row and assume the uptrend is fully established. Worried about missing out, they rush to chase the rally. But consecutive gains do not mean every price is a good entry point. Sometimes, the faster the rally, the more cautious you need to be about the risk of a short-term pullback.

Why might it not be a good idea to chase a rally after several large bullish candles?

First, the price may have moved too far from a reasonable level. After consecutive gains, the short-term price may be far from the moving averages. The market need
post-image
BTC-0.67%
Artwork in the birthday calendar for me and @nobita_3D,
what does everyone think?
Thanks, everyone~
BTC Multi-Timeframe Analysis: How Can Different Timeframes Improve Trading Accuracy?

In BTC trading, many people are used to watching 15-minute or even 5-minute candlestick charts for trading opportunities, but overlook an important point: short-term price movements do not necessarily reflect the market’s true trend direction.

Why do some people correctly predict short-term movements but still end up losing money? One important reason is that they fail to make an overall assessment using multiple timeframes.

First, use higher timeframes to determine the trend. You can use weekly and daily c
post-image
BTC-0.67%
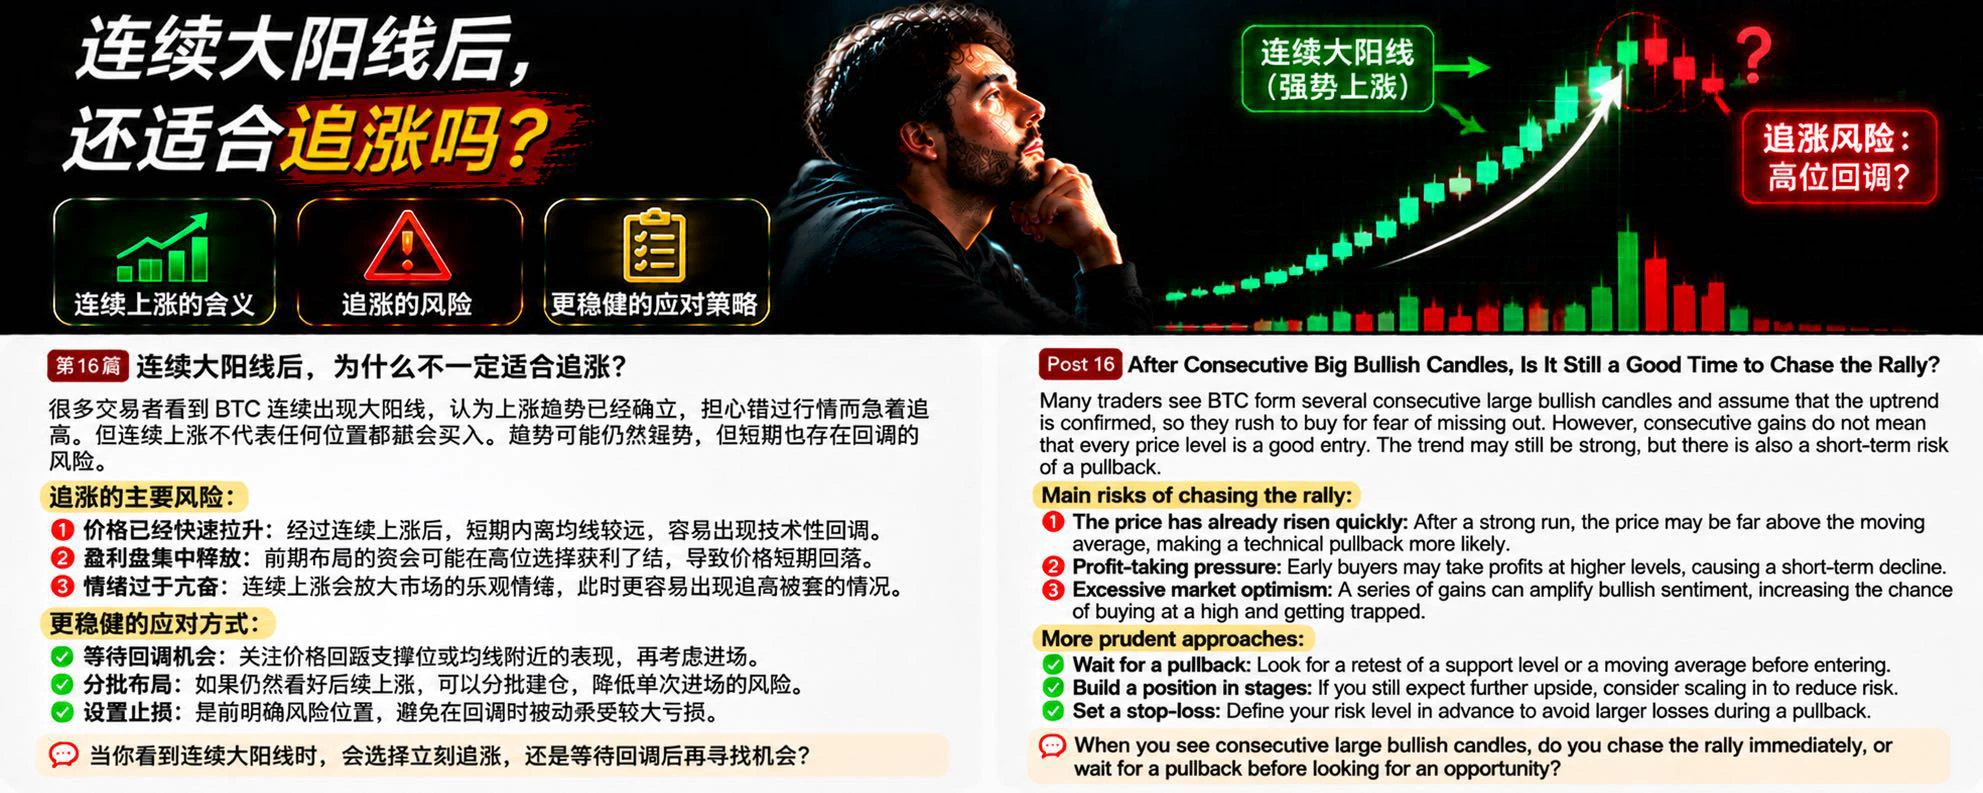
In BTC trading, many people see several large bullish candles in a row and assume the uptrend is fully established. Worried about missing out, they rush to buy. But consecutive gains do not mean every price is a good entry point. Sometimes, the faster the rally, the more wary you need to be of a short-term pullback.

Why isn't it always a good idea to chase prices after several large bullish candles in a row?

First, the price may have moved beyond a reasonable level. After consecutive gains, the short-term price may have moved far from the moving average. The market needs time to digest its p
post-image
BTC-0.67%
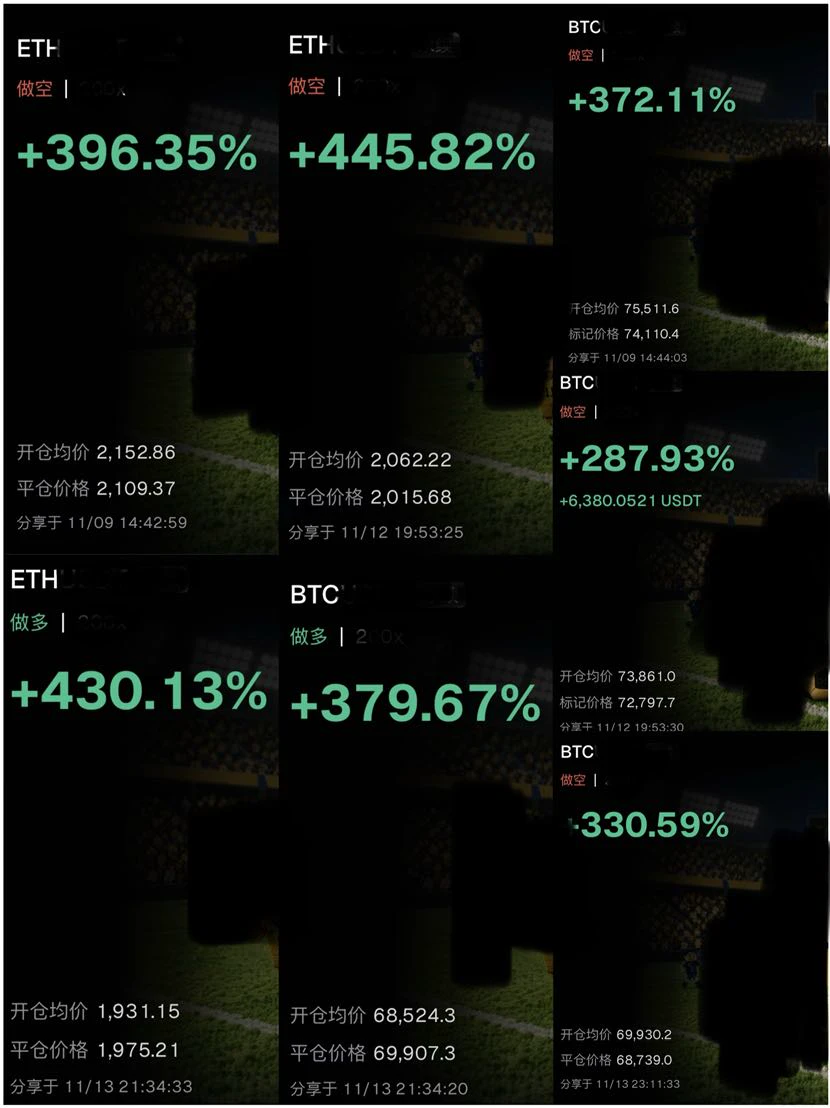
Sister Yue’s weekly roundup:
Tens of thousands of USDT in profits in one week; BTC, ETH, longs and shorts all crushed!

From 11.9 to 11.13, no matter how the market moved, our profit rate remained rock solid.
BTC, ETH, long and short positions—we made up to 445%, with nearly 6,400 USDT banked on a single trade.

No vague talk, just real trades in black and white.
Sister Yue doesn’t aim to get every call exactly right, but once we lock onto a trend, we’ll milk it for all it’s worth.
In this market, messing around blindly will only get you rekt; only by following the right person can you make mo
post-image
BTC-0.65%
ETH-1.23%
On a cool afternoon, I’d just taken a sip of lukewarm instant coffee and casually checked the latest fund flows. Good grief—the red and green figures nearly made me set my cup down crooked. Stop imagining a reversal from the candlestick chart; the big money’s true stance is all there in the numbers.
First, look at the short 1-to-2-hour window: spot and futures are both flashing green. $BTC futures saw net inflows of over 60 million, and $ETH spot saw inflows of over 90 million. At first glance, you might think the bull market is back and the dip buyers have stormed in, right? Don’t get excit
post-image
BTC-0.67%
ETH-1.26%
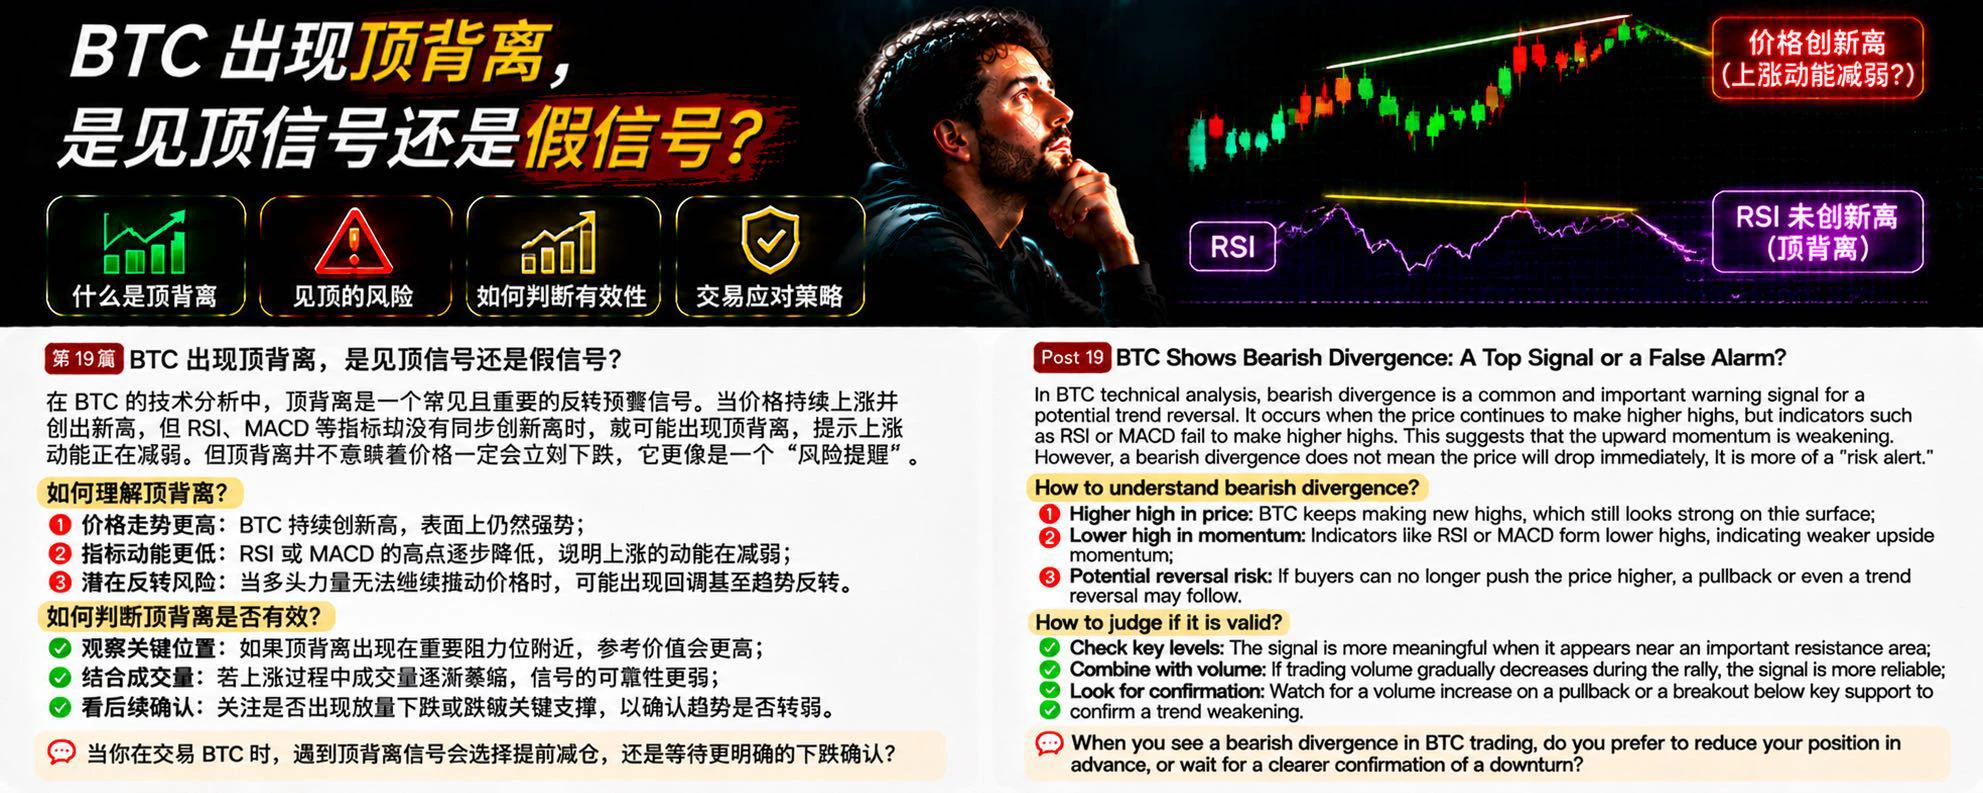
In BTC technical analysis, bearish divergence is a risk warning signal worth watching. Many traders see the price continually making new highs and assume the uptrend remains strong. But if the price keeps rising while indicators such as RSI or MACD fail to make new highs, bearish divergence may be forming.

What is bearish divergence?

Simply put, the price makes a higher high, but the technical indicator forms a lower high. This suggests that although the price is still rising, the momentum driving the rally may be weakening.

Why is bearish divergence worth watching?

First, upward momentum
post-image
BTC-0.67%
BTC News Analysis: How Can You Use Market News to Improve Your Trading Decisions?

In BTC trading, many people study candlesticks, MACD, and RSI every day, yet overlook an important factor that can significantly affect market movements: news and fundamentals.

Sometimes, BTC suddenly rises or falls over a short period, not because technical indicators signaled it in advance, but because new policies, economic data, or changes in capital flows have emerged. Changes in the news can quickly shift investors’ expectations, thereby affecting the balance between buyers and sellers.

So, how should yo
post-image
BTC-0.67%
Solana market predictions
live-cover
LIVE1,943
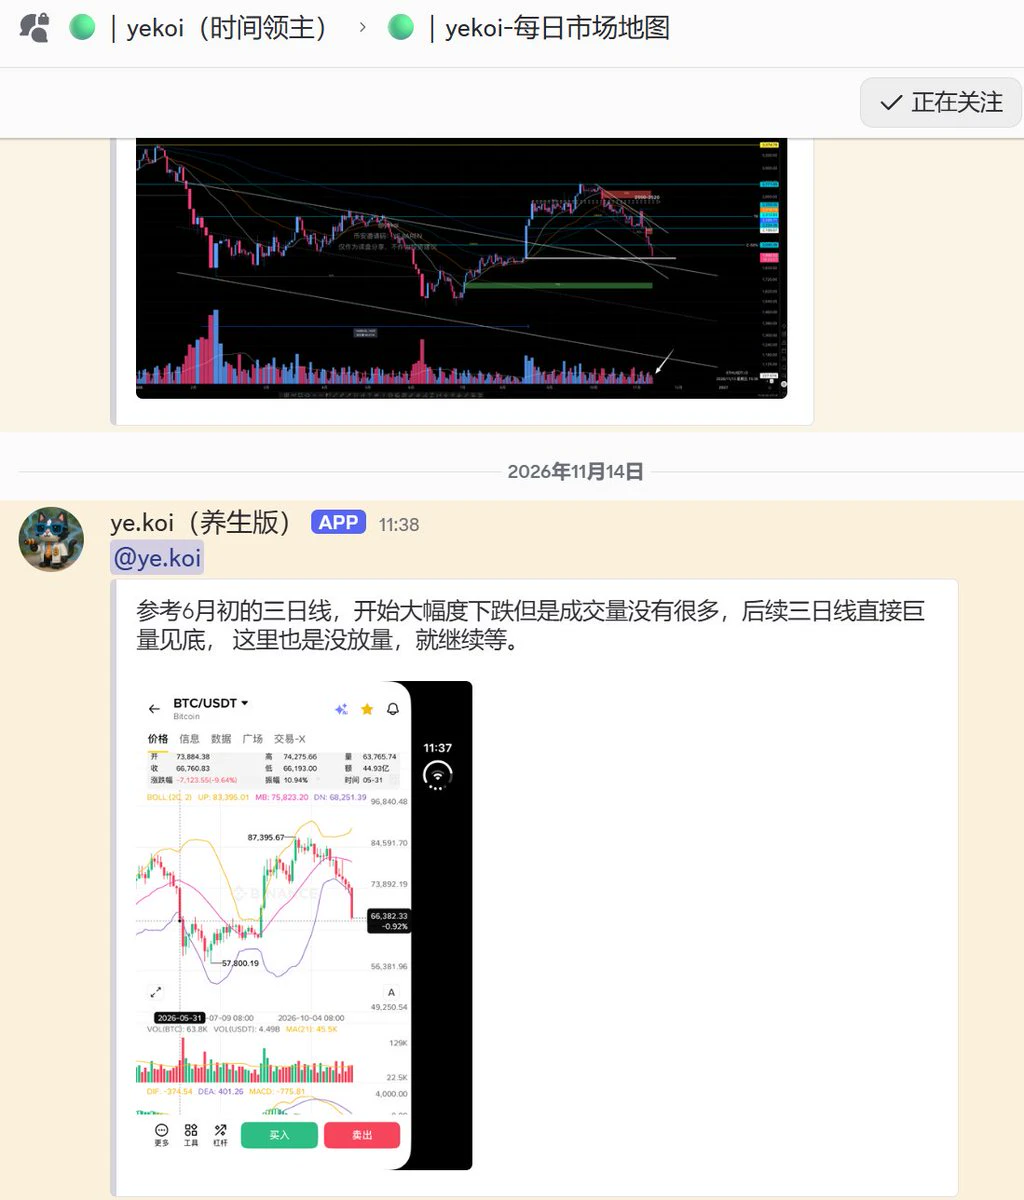
ye.koi: Looking at the 3-day chart from early June, it started dropping sharply, but volume wasn’t high. The following 3-day candle bottomed out on huge volume. There’s no volume spike here either, so keep waiting.
$BTC Current price: 67294; today’s high: 70217, low: 66449; down about 2.2% intraday.
67500 has been lost, weakening the short-term outlook. There’s been a small bounce off the low. First, watch whether it can hold 66400; if that breaks, it could fall toward 65,000. For spot, wait for it to stabilize before buying.
post-image
BTC-0.67%
Load More

Join 40 M users in our growing community

⚡️ Join 40 M users in the crypto craze discussion

💬 Engage with your favorite top creators

👍 See what interests you

Trending Topics

GateIPOAccessAnthropic

305.3K Views2.8K Discussing

Gate IPO Access Phase 3 features Anthropic (ANT), with USDT subscription interest starting from 100 USDT. Successful allocations will be delivered as real shares to Gate Stock Accounts. Indicative price: $70–$78/share Subscription: Nov 12–17 (UTC+8) Allocation is not guaranteed. Please manage risk accordingly.

Dr.HanOxfordUnionSpeech

147.2K Views586 Discussing

USOctoberPPIBelowExpectations

461.1K Views1.4K Discussing

View More