Share your thoughts
placeholder
Article
JUST IN: $100,000,000 worth of shorts liquidated from the crypto market in the past 30 minutes.
post-image
IN-1.24%
Nobody is talking about this quiet setup forming on $CL /USDT right now.

$CL /USDT - SHORT

Trade Plan:
Entry: 96.12 – 96.60
SL: 98.63
TP1: 94.66
TP2: 93.53
TP3: 91.82

Why this setup?
Why now? The daily trend is range-bound, but the 1h price is sitting at 96.35 with a 15m RSI of 32.05, which means the short-term momentum is exhausted and ripe for a move lower. The 1h ATR of 0.944942 tells us a single hour can cover over 94 pips, so the entry zone between 96.12 and 96.60 offers a tight risk window for a short. We are targeting TP1 at 94.66 and TP2 at 93.53, with the line in the sand at the
CL+0.07%
Trade $AAPL, $TSLA, Gold 24/7 on Gate! RWA Perpetuals Explained Live
live-cover
LIVE36
Smart money is fading a bullish daily trend on $UNI /USDT right now.

$UNI /USDT - SHORT

Trade Plan:
Entry: 6.662 – 6.714
SL: 7.006
TP1: 6.449
TP2: 6.290
TP3: 6.051

Why this setup?
Why now? The 4h setup shows a short bias with 84% confidence, and the 1h price is sitting at 6.688 inside the entry zone of 6.662 to 6.714. The 15m RSI is at 81.22, which means the recent bounce is already overbought and vulnerable to a sharp reversal. The 1h ATR of 0.102072 tells us the market is volatile enough to reach the first target of 6.449 and potentially extend down to 6.290. The daily trend is still l
UNI+8.17%
what investing looks like in 2026
post-image
Those chasing MINA had just tasted the sweetness of doubling their money, only to take a heavy-volume beating in a single day.
Well, $MINA 24h -17.154%, and I’m bearish—short into the resistance zone on a rebound; don’t chase a bounce unless support holds. A token up 107.32% in 30 days sold off on heavy volume, with a volume ratio of 2.73.
Before the drop, the daily RSI had already reached 73.0, indicating overbought conditions, while the MACD red bars flattened out. The 1h ADX was 56.8, signaling a strong downtrend.
Money is also flowing out, with OI down 10.17% from the snapshot and the fund
MINA-15.87%
Insiders are quietly fading $SLX /USDT while the range refuses to break.

$SLX /USDT - SHORT

Trade Plan:
Entry: 0.06386 – 0.06426
SL: 0.06597
TP1: 0.06263
TP2: 0.06168
TP3: 0.06024

Why this setup?
Why now? The daily trend is range, but the 1h price is stuck at 0.06406, exactly where the 1h ATR of 0.000795 shows the average candle range is compressing before a decisive move. With the 15m RSI at 55.32, momentum is neutral, yet the short bias targets TP1 at 0.06263 and TP2 at 0.06168, implying a measured drop from the entry zone between 0.06386 and 0.06426. The invalidation level sits at 0.0
SLX-3.62%
Everyone is sleeping on BNB while the 4h trend screams LONG.

$BNB /USDT - LONG

Trade Plan:
Entry: 726.84 – 728.66
SL: 719.00
TP1: 734.31
TP2: 738.69
TP3: 745.25

Why this setup?
Why now? The daily trend is firmly bullish, giving us a macro tailwind for this long. The 1h price sits at 727.75, right inside our entry zone, while the 15m RSI at 72.2 shows momentum is strong but not yet exhausted. We are using the 1h ATR of 3.645589 to size our targets, aiming for TP1 at 734.31 and TP2 at 738.69 with a defined risk profile. The line in the sand is the invalidation level at 721.61, which we mus
BNB+1.31%
#GateSquareMidAutumnReunion
The interesting part of this market isn’t just that stocks are falling — it’s how quickly the same fear can move from Wall Street into crypto.
I’m watching the next few sessions very closely because we have several major catalysts hitting the market at almost the same time: AI stocks are under pressure, oil is above $100, Treasury yields are elevated, and the Federal Reserve decision is coming on September 16.
Today’s move in technology stocks is already showing how sensitive sentiment has become. Nasdaq-100 futures dropped around 1.72%, while major AI and semicon
post-image
MrFlower_XingChen
#GateSquareMidAutumnReunion
The interesting part of this market isn’t just that stocks are falling — it’s how quickly the same fear can move from Wall Street into crypto.
I’m watching the next few sessions very closely because we have several major catalysts hitting the market at almost the same time: AI stocks are under pressure, oil is above $100, Treasury yields are elevated, and the Federal Reserve decision is coming on September 16.
Today’s move in technology stocks is already showing how sensitive sentiment has become. Nasdaq-100 futures dropped around 1.72%, while major AI and semiconductor names came under pressure after fresh concerns about the pace of AI development. Nvidia was down more than 2% in premarket trading, while AMD and Intel also saw significant weakness.
For me, this is important because the AI trade has been one of the biggest drivers of the broader stock-market rally. When traders start questioning future AI spending, valuations or growth expectations, the impact doesn’t stay inside one sector. It can quickly affect the Nasdaq, S&P 500, semiconductor stocks and overall risk appetite.
Then comes oil.
Brent crude is trading around $108, while WTI is above $103. Higher energy prices create another inflation problem at exactly the wrong time. If oil stays elevated, investors have to consider the possibility that inflation remains sticky for longer, which can influence how aggressive the Fed needs to be.
And that brings us to the biggest catalyst of the week:
September 16 — Federal Reserve interest-rate decision.
The FOMC meeting is underway September 15–16, with the rate decision and economic projections scheduled for 2:00 PM ET on September 16, followed by the Fed press conference at 2:30 PM ET.
Markets are currently assigning a very high probability to a rate hike. That expectation itself is already influencing stocks, the dollar, bond yields and crypto. The important thing, however, may not be the decision alone. The Fed’s language and forward guidance could matter even more.
This is where FOMO can become a real market force.
Imagine the Fed comes across as less hawkish than traders fear. If Nasdaq support holds, AI stocks stabilize and yields start falling, traders who were sitting on the sidelines may suddenly feel they are missing the next move.
That creates upside FOMO.
Money can rush back into NVDA, AMD, MU, INTC and other high-beta technology names, potentially turning a relief bounce into a much stronger rally.
And crypto can react to exactly the same change in risk sentiment.
Bitcoin is currently around $77.6K and remains below the important $80K psychological level. Recent market coverage shows BTC has struggled to regain that area while Fed-hike expectations and ETF outflows have created additional pressure.
If stocks recover after the Fed and BTC reclaims $78K–$80K with volume, crypto FOMO could become very interesting. Traders who missed the first move may start chasing BTC, and if Bitcoin breaks resistance, that momentum can eventually rotate into ETH and higher-beta altcoins.
But FOMO can work in the opposite direction too.
If the Fed delivers a more hawkish message, oil remains above $100 and Nasdaq breaks important support, traders may rush to reduce risk. That can create downside FOMO — panic selling and forced positioning — across both stocks and crypto.
So I’m not treating this as a simple “stocks down, crypto down” situation.
I’m watching the chain reaction:
Fed decision → yields → Nasdaq/AI stocks → risk sentiment → BTC → altcoin FOMO.
For me, September 16 is the key date, but the real signal will be the market’s reaction after the decision.
If buyers absorb the bad news and start reclaiming resistance, that tells me something very different from a market that keeps selling every bounce.
Right now, I’m watching Nasdaq, S&P 500, NVDA, AMD, MU, BTC and ETH.
This is one of those weeks where the first move may be a trap.
I want to see where the liquidity actually goes before deciding which direction deserves the trade.
@GateSquare @Gate_Square
$BTC ‌ ‌
repost-content-media
BTC+2.77%
Retail investor: Nike $NKE just hit a 52 week low. That's gotta be a steal at these prices.
Me: Maybe. Let's actually check instead of guessing.
Retail investor: It's Nike. Everybody knows Nike.
Me: Brand recognition doesn't matter... Pull up the earnings. Are profits growing or shrinking over the last few years?
Retail investor: ...I don't actually know.
Me: That's the whole question. A falling price with growing profits is a dip. A falling price with falling profits is a company in trouble...
Retail investor: So a 52 week low means nothing by itself?
Me: Nothing. It's a price, not a value. W
post-image
NKE+0.70%
How many people are awake?
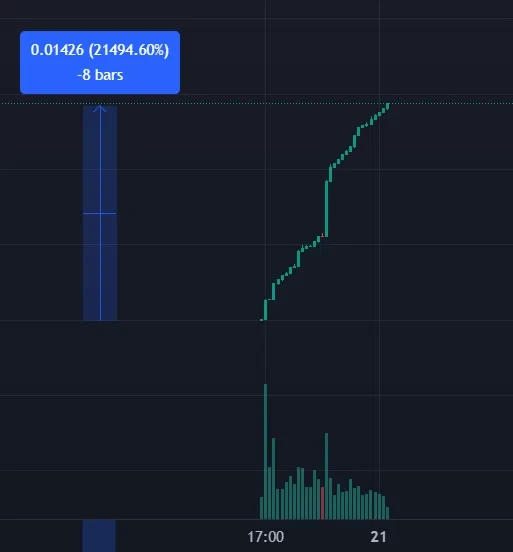
It did 50x in 2 days. Those chasing memecoins must have seen this at the bottoms.
$biketyson
post-image
MEME-1.20%
“You can’t be unlucky for 365 days.”
Crypto traders: “Watch me.” 💀😂
One day you’re up 30%, the next day the market takes it all back.
Stop loss hit. Liquidation avoided. Trade reversed.
But somehow… we’re still here. 😭📉📈
The real skill in crypto isn’t winning every trade — it’s surviving long enough to catch the next one.
Who else can relate? 😂👇
#CryptoTraders #CryptoTrading #TraderLife
post-image
$WIFH is built beyond the hype, its utility gives the community a reason to stay, participate, and grow. The vision is simple: build real value, strengthen the ecosystem, and make every holder part of the journey.
Ca
0x4606bd72eba7259c40f910ecd76cf82950c0428c
Everyone watching ADA for a breakout is about to get blindsided by a range-bound trap.

$ADA /USDT - SHORT

Trade Plan:
Entry: 0.2142 – 0.2154
SL: 0.2204
TP1: 0.2106
TP2: 0.2077
TP3: 0.2035

Why this setup?
Why now? The daily trend is range, meaning the 1h price is stuck in a tight band where a short setup is forming. The 1h ATR of 0.00235 shows volatility is compressed enough for a sharp move, while the 15m RSI at 57.04 signals just enough bearish momentum without being overextended. The entry zone between 0.2142 and 0.2154 aligns perfectly with the 1h price, giving a precise trigger for a
ADA+3.26%
Everyone is long, but the tape says something else entirely.

$BTC /USDT - SHORT

Trade Plan:
Entry: 79112.5 – 79317.1
SL: 80492.1
TP1: 78256.9
TP2: 77618.2
TP3: 76660.3

Why this setup?
Why now? The daily trend is bullish yet the 1h price sits at 79211.1, just 3.7 below the entry reference of 79214.8, exposing a fragile consensus. The 15m RSI at 65.38 signals room to run before overbought, while the 1h ATR of 409.38 quantifies the wave size that could push us to TP1 at 78256.9. From there, a clean break below invalidates the setup at 78218.0, turning the invalidation level into the absolut
BTC+2.77%
$NVDA /USDT is range-bound on the daily trend, but the 15m RSI tells a different story.

$NVDA /USDT - SHORT

Trade Plan:
Entry: N/A – N/A
SL: N/A
TP1: N/A
TP2: N/A
TP3: N/A

Why this setup?
Why now? The daily trend is a range, which usually traps momentum traders, yet the 15m RSI sits at 36.65, signaling weak bullish exhaustion. The 1h ATR is absent, so volatility is compressed and a squeeze could accelerate the move. The entry zone is locked at 211.02, which is the exact level where the short bias is armed. This confluence suggests the range is about to break lower, not higher. The invali
NVDA-1.85%
[New streamer BTC]
live-cover
LIVE75
Guys, $BTC is bouncing strongly from the $76K support, exactly as I mentioned earlier.
Price has now reclaimed $79K and buyers are pushing back with strong momentum.
The next levels I’m watching:
$80,560 → $82,280 → $82,800
A clean 4H breakout above $82,300 could open the door toward $85K+.
But first, BTC needs to hold above $79K and reclaim $80.5K with strength.
The $76K support held. Now let’s see how far this recovery can run.
post-image
BTC+2.77%
Nobody is talking about this hidden short setup in $XAUT /USDT right now.

$XAUT /USDT - SHORT

Trade Plan:
Entry: 4290.7 – 4298.5
SL: 4331.6
TP1: 4266.8
TP2: 4248.3
TP3: 4220.5

Why this setup?
Why now? The daily trend is bearish, setting the macro stage for lower prices. The 1h price sits at 4294.6, which is also the entry reference, placing you right at the trigger zone. A 15m RSI of 60.67 shows the market is not overbought, so the bearish move can still have room to run. The 1h ATR of 15.434948 tells us the current volatility is high enough to make the move to TP1 at 4266.8 and TP2 at 4
XAUT-0.90%
Nobody is talking about the silent move forming inside $LAB /USDT right now.

$LAB /USDT - SHORT

Trade Plan:
Entry: 0.05315 – 0.05437
SL: 0.05965
TP1: 0.04934
TP2: 0.04640
TP3: 0.04199

Why this setup?
Why now? The 1d trend is bearish and the 4h setup has 95 percent confidence, which means the market structure is already collapsing downward. The 1h ATR of 0.002453 shows volatility is compressed just before a breakout, and the 15m RSI at 51.62 proves the short term is neither overbought nor oversold, leaving room for a sharp move. The entry zone between 0.05315 and 0.05437 lines up perfectl
LAB-21.61%
Load More

Join 40 M users in our growing community

⚡️ Join 40 M users in the crypto craze discussion

💬 Engage with your favorite top creators

👍 See what interests you

Trending Topics

GateTopsGlobalGrowth

24.21k Views531 Discussing

According to the latest CryptoQuant data, Gate's spot trading volume ranks top 3 globally, with the fastest growth worldwide, while futures trading volume growth also ranks top 3 globally. Market activity is accelerating back, and Gate's growth momentum continues to lead. Market heat is back — are you mainly trading spot or futures these days? [👉 Full report:](https://cryptoquant.com/insights/research/6aa7aaca26ed15760f9ca834)

GateUSExpandsTo37StateLicenses

22.34k Views328 Discussing

AnthropicPicksNasdaqForIPO

72.46k Views801 Discussing

View More