Square
Following
Hot
News
Notifications
Profile
Share your thoughts
placeholder
Article
Just got another subscriber.
It's cook o'clock 😋🤞
post-image
$ROBO

My old stubborn donkey of a friend has decided to start a Good News series. It’s about time!
ROBO-2.79%
Trenches
ZIG
Z
bade
b
ZIG
0x8c...1145
Market Cap
$.
Change
.
24h Vol
$.
Holders
.
STONK
S
bade
b
STONK
6GmA...UNgx
Market Cap
$.
Change
.
24h Vol
$.
Holders
.
BTC
B
bade
b
BTC
C5xp...pump
Market Cap
$.
Change
.
24h Vol
$.
Holders
.
MAGGIE
M
bade
b
MAGGIE
8rHo...PmZV
Market Cap
$.
Change
.
24h Vol
$.
Holders
.
CLAUDIA
C
bade
b
CLAUDIA
2j5S...W2ZM
Market Cap
$
Change
.
24h Vol
$.
Holders
.
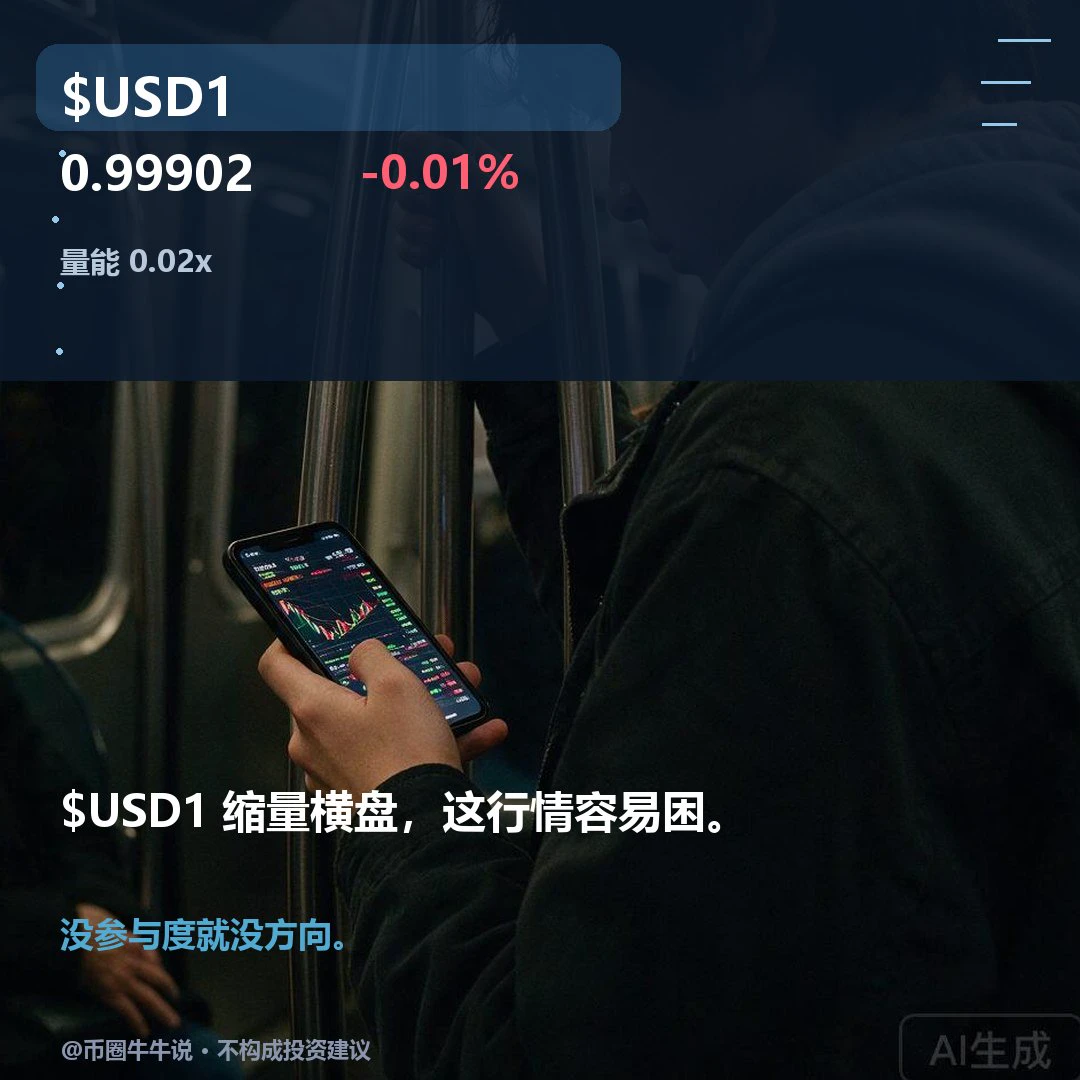
$USD1 Current price 0.99902, 24H -0.005% (0.9984–0.9994). 1H has a bullish bias: RSI 60.85/EMA20 0.998957, support 0.9984/resistance 0.9994; 4H has a bullish bias: RSI 49.12/EMA20 0.999010, support 0.998/resistance 0.99988. Bullish condition: hold above the 0.9994 resistance; bearish condition: break below the 0.9984 support. Review whether 0.9994 holds and whether price can recover after losing 0.9984; volume ratio is 0.021x, and the setup is invalid without confirmation from participation. Market volatility is high; for observation only.
post-image
USD1+0.00%
The biggest fear during mega-cap tech earnings season isn’t weak results—it’s expectations that are too high. Stocks like PLTR, AMD, and NVDA have posted mind-boggling gains over the past few years: PLTR rose about 167% in 2023 and another 340% in 2024, NVDA gained about 239% in 2023 and 171% in 2024, and AMD rose about 127% in 2023. With gains like these, current prices have long since priced in “smooth sailing for the next five years,” embedding very high growth assumptions in their valuations.

If guidance is even slightly softer than expected, or gross margins or next quarter’s revenue out
post-image
PLTR+3.57%
AMD+11.55%
NVDA+2.80%
MSFT-0.95%
AMZN-0.44%
$UAI Down 44% in a day—those who chased at 0.13 are sweating now. The 24h low was 0.0666, and the current price of 0.0692 is basically on the floor. Trading volume of 101.6M shows panic selling, not a lack of attention.
My discipline: don’t catch a falling knife; wait for stabilization. Enter in batches in the 0.066–0.068 range, set an unconditional stop-loss below 0.064, and take profit at 0.082 for the first target and 0.095 for the second. Keep the position below 20%; don’t go all in.
The logic is simple: it fell from 0.13 to 0.066—a deep enough drop—but any rebound depends on whether volum
UAI-7.58%
JCT-3.26%
BTC-0.67%
GN to those who GN💤
post-image
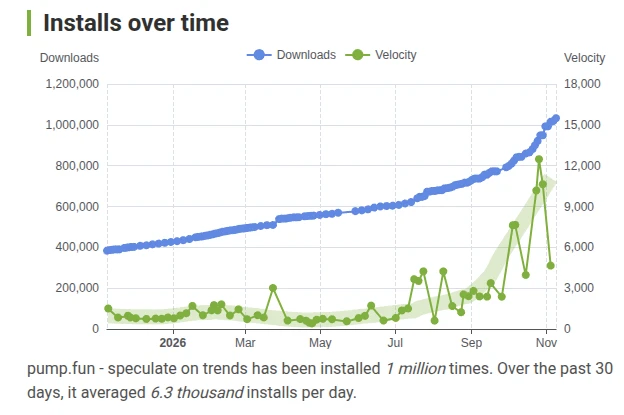
Robinhood Wallet app downloads spiked with the chain release, likely just crypto natives checking listings, then faded
The idea that "RH normies are buying our bags" was always a data-free myth. Compare with apps like Pumpfun which continue to grow
post-image
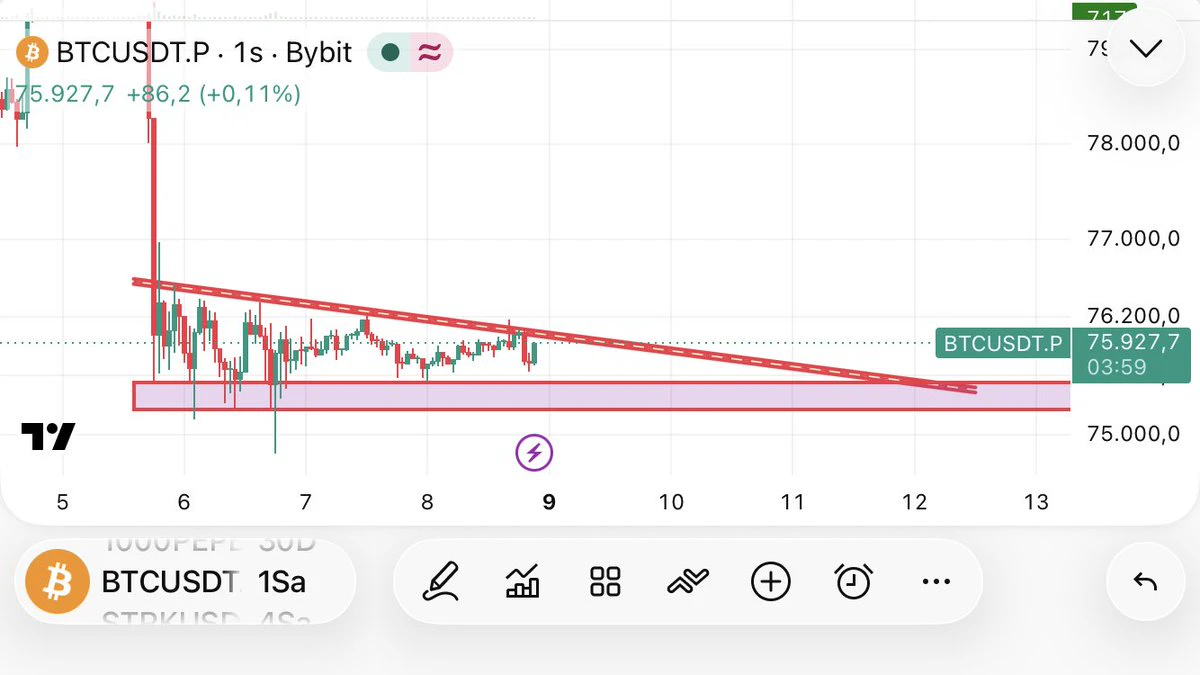
#Btc If the lower range holds, why not an inverted Bart? 🤔
#Bitcoin #eth #Ethereum #Crypto #cryptocurrency
post-image
BTC-0.67%
ALT-1.40%
ETH-1.26%
market prices updattes
live-cover
LIVE67
🚀 BTC LIVE: Bull Run or Big Crash? Where Is Bitcoin Heading Next?
live-cover
LIVE852
Why did the world raise interest rates simultaneously during the same week?

The weekly summary has been verified point by point: employment in the United States increased by 165,000, the unemployment rate fell to 4.1%, and wages rose by 0.4%. The Bank of England raised interest rates to 4.00%—its first such move in over three years—while Australia pushed its rates to 4.85%, an 18-year high. Inflation climbed to 4.0% in the Eurozone and 1.5% in Switzerland, and Sweden raised its interest rate to 2.00%. Norway kept its rate steady at 4.50% but left the door open for future adjustments; meanwhil
NAS100+1.90%
GBPUSD+0.13%
EURUSD+0.06%
USDJPY+0.52%
BTC-0.67%
  • 9
  • 4
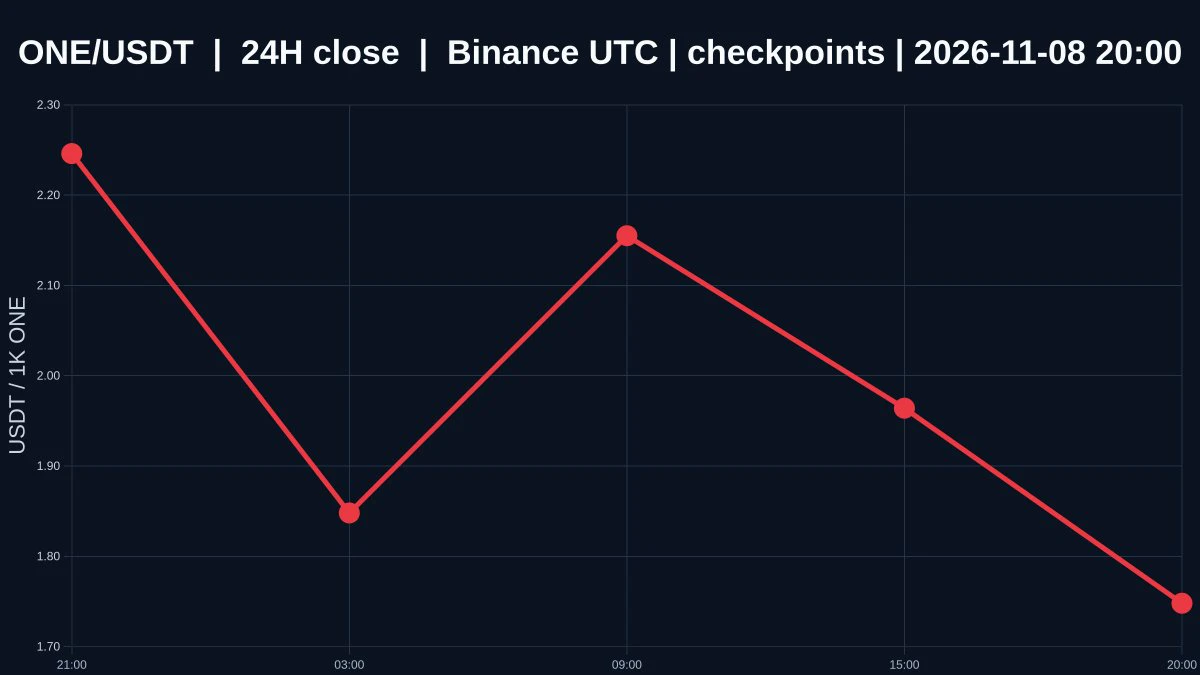
What’s easiest to misread when $ONE’s two time frames haven’t aligned yet?

$ONE is currently priced at 0.001748, down 26.77% over 24 hours, with an intraday high of 0.00243 and a low of 0.001692. The 1-hour trend is weak, while the 4-hour trend is strong. The volume ratio is 0.10325723931514065. The two time frames point in opposite directions, so the trend has yet to be confirmed.

At 0.001748, the price is only 0.000056 above the 1-hour support at 0.001692, but 0.000682 below resistance at 0.00243. This puts it clearly closer to support. Whether support at 0.001692 holds depends on whether
post-image
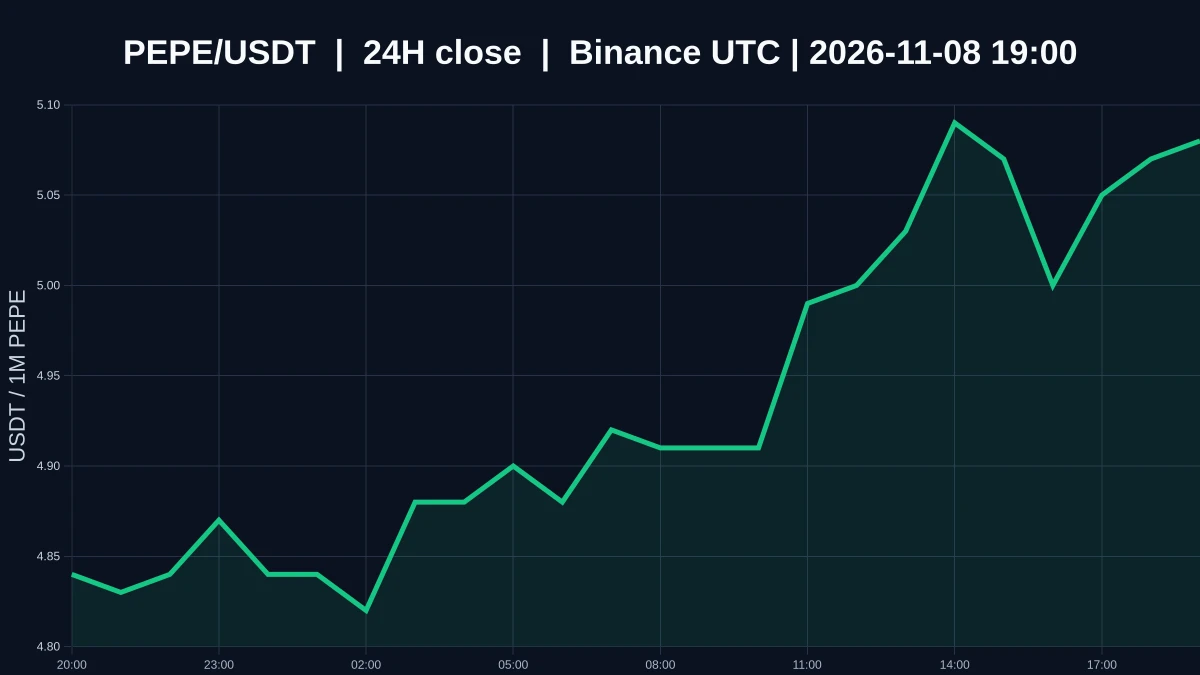
$PEPE ’s price has already moved. Why hasn’t trading volume followed?

$PEPE is currently priced at 0.00000508, up 3.885% over 24 hours, with an intraday high of 0.00000513 and a low of 0.00000478. The 1-hour and 4-hour trends are both relatively strong, but the volume ratio is only 0.030028783815234078. The direction looks clear, but volume hasn’t weighed in, which makes this move less convincing.

On the 1-hour chart, support is at 0.00000478 and resistance is at 0.00000513. At 0.00000508, the current price is about 0.00000030 above support and about 0.00000005 below resistance, putting it ve
post-image
PEPE+0.97%
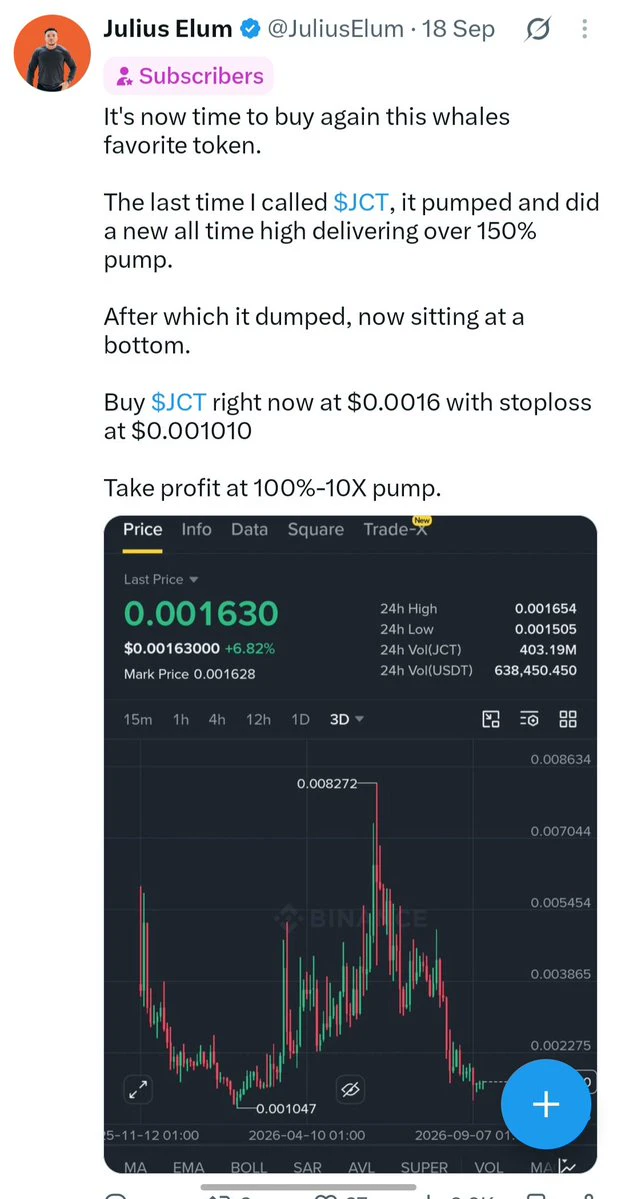
$JCT pumped 12X from the price I called it.
The first time I called it was on the 28th of September. It pumped about 150%
Then went down again, and I called it again, on the 23rd of October.
It has over since then done 12X.
So, if you're not printing from the market, you are not with Mr. Black.
Stay with me and I guarantee you a good print.
post-image
JCT-3.26%
$BMT ‌ is holding the recovery structure better than expected.

After pulling back from the $0.0494 spike, the price is stabilizing around $0.0239. The daily Supertrend remains bullish at $0.01854, keeping the broader setup constructive.

Levels on my radar:

Support: $0.0223 to $0.0213
Major support: $0.0185
Resistance: $0.0268
Next hurdle: $0.0288

A strong reclaim of $0.0268 could bring another test of $0.0288. Losing $0.0213 would put the recovery under pressure.

BMT needs a clean breakout now, not just another short-lived bounce.

$NVDA ‌#USCPIDataIncoming #USAIStocksHitHard
BMT+5.93%
NVDA+2.80%
#USCPIDataIncoming
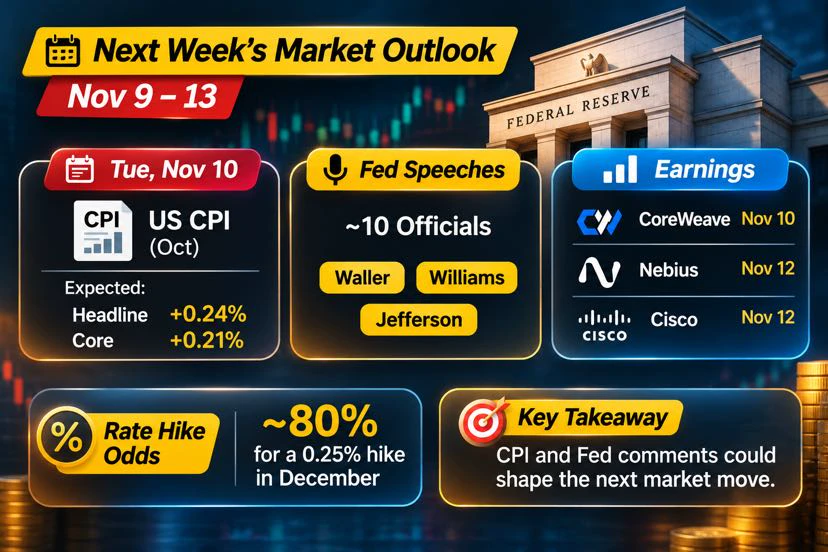
Next week could be an important one for the markets 👀
* Tuesday: US October CPI data.
* Tuesday: CoreWeave earnings.
* Thursday: Nebius and Cisco earnings.
* Friday: US October PPI data.
After stronger than expected jobs data, markets are now pricing in around an 80% chance of a 0.25% rate hike in December.
Hmm i think CPI will be the biggest event for the market. If inflation comes in higher than expected, it could put more pressure on rate cut hopes. AI earnings will also be interesting, especially for the demand for computing power.
For Bitcoin and crypto, I’ll be watch
post-image
CRWV+6.18%
CSCO-2.05%
BTC-0.67%
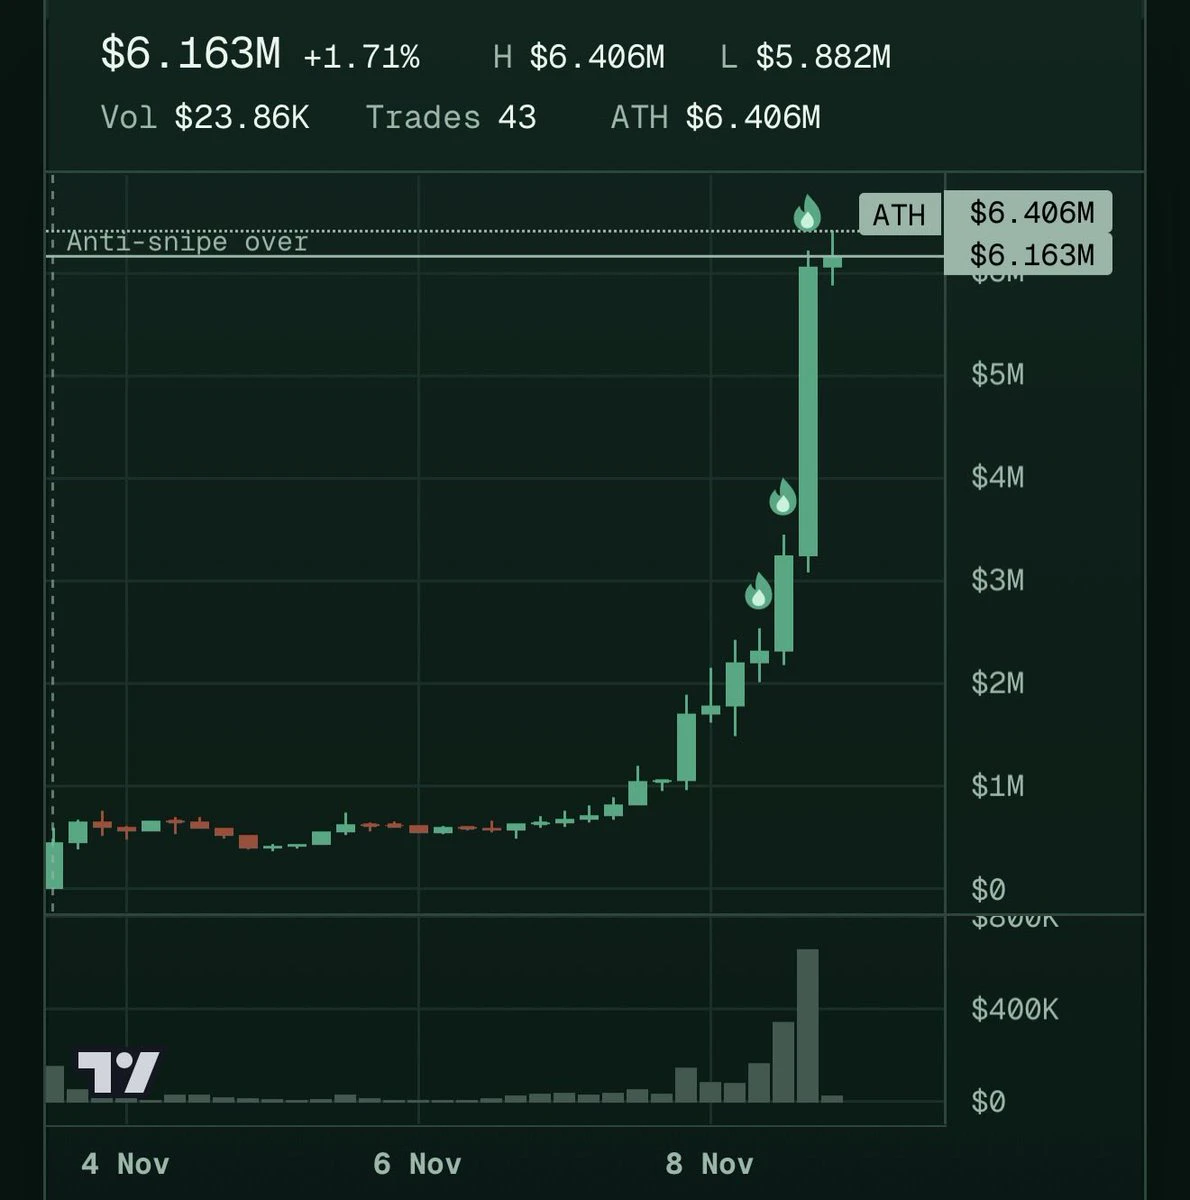
500% in 24h for $VOLTA gg
post-image
*#StakeOnLaunchpoolToShare450KVLX — New Rewards Pool Live*

Stake on Launchpool to share *450K VLX* in rewards! A major opportunity for the Velas community to earn passive rewards.

*How it works:*
1. *Stake:* Deposit your tokens into the Launchpool. Choose flexible or locked options.
2. *Rewards Pool:* Tokens are collected into a shared rewards pool, distributed in real-time.
3. *Earn:* Claim your staking rewards anytime and withdraw staked + rewards.

*Key Benefits:*
Secure & Non-Custodial, Competitive APY up to 18.5% dynamic, Flexible Staking, and Transparent On-Chain activity.

With ove
post-image
VLX+0.00%
#70%OfAltcoinsFallBelow200DMA
Market Observation: 70% of Altcoins Now Below 200DMA

Recent data from CryptoQuant analyst Darkfost indicates a notable shift in the altcoin market structure. According to the report, approximately 70% of altcoins are currently trading below their 200-day moving average (200DMA). This is a sharp increase from early October, when the figure was around 10%.

The 200DMA is a widely used technical indicator to gauge longer-term market trends. A broad breakdown below this level often indicates a shift in market momentum toward a bearish phase or a period of prolonged
  • 1
Load More

Join 40 M users in our growing community

⚡️ Join 40 M users in the crypto craze discussion

💬 Engage with your favorite top creators

👍 See what interests you

Trending Topics

USCPIDataIncoming

15.13k Views1.66k Discussing

The U.S. October CPI report will be released on November 10 at 8:30 a.m. ET. September CPI came in at 3.7% year over year, and markets will be watching closely for signs that inflation is cooling, especially in core CPI. A softer-than-expected reading could strengthen rate-cut expectations, while hotter inflation may pressure risk assets through higher Treasury yields and a stronger dollar. How do you think this CPI print will move $BTC, U.S. stocks and gold?

USAIStocksHitHard

29.19k Views3.74k Discussing

USNonfarmPayrolls

56.39k Views4.5k Discussing

View More