Share your thoughts
placeholder
Article
live Market Update
live-cover
LIVE160
The market humbles everyone eventually, but this time it has been pretty gentle with me.
When it plunged intraday, 1.117 looked like it was about to collapse, but it ultimately couldn’t push any lower. Volume dried up completely—those who were going to run had already done so, leaving only the ones who didn’t want to move.
When I checked the chart after lunch, the price had already started quietly climbing back. I had just one thought at the time: at this level, set a stop-loss and take a shot at a rebound.
Now at 4.532, with a +14729.64% return, the guys on board should be waking up laughing,
post-image
SNDK+1.12%
XRP+0.32%
A sincere piece of advice: trade fewer altcoins and focus more on major coins.
Looking at SNDK and ZEC, how many people were completely wiped out by the extreme market moves?
Over the past two days, watching SNDK and ZEC take turns delivering extreme roller-coaster moves has left me with a lot of thoughts. Many friends were drawn in by the narrative of explosive price increases and rushed in out of FOMO, only to see the market quickly reverse and their accounts get completely wiped out. Some others ended up deeply trapped in their positions.
This is how small-cap coin markets work: when short
ZEC+19.99%
SNDK+1.12%
It is said that the way Chinese people have fun has changed dramatically. What do you like doing most these days?
post-image
I was just about to go to the forum and rant, but then I saw my balance and thought, forget it—the market is always right. 😂
A few days ago, it was still barely holding on before bed. Every rebound seemed to lack that final push, while volume quietly shrank. At a level like this, not opening a short position would have been hard to justify. Entry reference: 0.17647. When I opened the chart this morning, the price had plunged straight to 0.04593, and the short position was already showing +1457.07% unrealized profit. This profit feels great. 🔥
Take profits steadily; don't get greedy for the l
post-image
SOL+2.40%
LAB-3.96%
The week is coming to an end. The market first moved down and then up, pulled back again on Friday due to fundamental factors, and then slowly climbed higher. Overall, it remained in a wide-ranging consolidation. A total of 13,140 points were captured this week, marking another consecutive account doubling. Although the movement this weekend was much slower than on previous weekends and the volatility was also relatively low, range trading, shorting the highs, and longing the lows still brought in some gains. Now we will see how the new week unfolds. Going for another 30-win streak.
From the
post-image
BTC+0.29%
ETH+1.09%
Everyone’s chasing TAO’s green candles, but the 4h tape is screaming something they refuse to hear.

$TAO /USDT - SHORT

Trade Plan:
Entry: 267.0 – 269.4
SL: 283.5
TP1: 256.7
TP2: 249.1
TP3: 237.6

Why this setup?
- RSI on the 15m is overheated at 69.6—buyers are exhausted right as price tags the 268.2 reference.
- ATR (1h: 4.89) shows volatility is compressing; a snap back toward 256.7 (TP1) is the path of least resistance.
- 1D trend is range-bound, so fading the top of the range (269.4) with a 77.4 confidence short isn’t a gamble—it’s statistical edge.

Debate:
If TAO rejects 269 an
TAO+10.87%
Everyone’s staring at DASH at 71.41—but the range just whispered a secret the bulls missed.

$DASH /USDT - SHORT

Trade Plan:
Entry: 70.72 – 72.10
SL: 77.99
TP1: 66.48
TP2: 63.19
TP3: 58.26

Why this setup?
Why now? The 1D trend is *range*, not breakout—so we’re playing mean reversion, not momentum.
- 4h bias: SHORT (Conf 55.4) with entry zone 70.72–72.10.
- RSI 15m at 57.38 shows a weak bounce—no fuel for a push above 72.10.
- ATR 1h (2.74) says volatility is contracting—tight stops, fast move.
- Targets: TP1 66.48, TP2 63.19. Invalidation only if price closes above 55.29 (wait—tha
DASH+5.43%
Everyone is staring at ADA’s green 15-min RSI, but the 4h tape just whispered something darker.

$ADA /USDT - SHORT

Trade Plan:
Entry: 0.2212 – 0.2224
SL: 0.2274
TP1: 0.2176
TP2: 0.2148
TP3: 0.2105

Why this setup?
Why now? The daily trend is range-bound, which means mean reversion is the game. RSI(15m) at 63 is a local overheat, not a breakout signal. ATR(1h) is thin at 0.0023, so the short squeeze fuel is low. We’re sitting at 0.2218 with a clear invalidation at 0.2133. If we reject 0.2224, the path to TP1 (0.2176) and TP2 (0.2148) is a straight line down. The 55 confidence score says "p
post-image
ADA+0.77%
Everyone’s chasing $MU /USDT longs while the 4h quietly flips—are you early or early exit?

$MU /USDT - SHORT

Trade Plan:
Entry: 1019.67 – 1021.43
SL: 1029.04
TP1: 1014.18
TP2: 1009.93
TP3: 1003.57

Why this setup?
- 1D is *range*, not breakout—so the 1020.55 reference is a midpoint trap, not a launchpad.
- RSI 15m at 55.1 shows weak bounce fuel; momentum stalls right under the entry zone.
- ATR 1h (3.54) is tight—when it expands, it’s usually down from here.
- Why now? Price is sitting at the exact SHORT trigger with SL at 1029.04, giving a 2.3R to TP2 at 1009.93 before the daily ra
MU+0.50%
Which of these will make you a millionaire?
ethereum:0x95ad61b0a150d79219dcf64e1e6cc01f0b64c4ce

$PEPE
terra-luna:native
$LUNA
$CORE
ETH+1.09%
PEPE-0.11%
LUNA+0.36%
CORE-0.31%
Everyone’s staring at $ETH /USDT’s range—but the 4h clock just started ticking for the quiet exit.

$ETH /USDT - SHORT

Trade Plan:
Entry: 2492.99 – 2499.19
SL: 2525.89
TP1: 2473.74
TP2: 2458.85
TP3: 2436.50

Why this setup?
Why now? The 1D says “range,” but the 4h frame is whispering SHORT with 55% conviction. Price is parked at 2496, right on the entry ref. ATR (12.41) is thin—volatility is coiled. RSI 15m at 51.7 shows zero momentum, meaning longs aren’t committed. The path of least resistance is down to TP1 (2473) then TP2 (2458), unless we invalidate above 2470.67—wait, that’s the inva
ETH+1.06%
What can be the AMC top? I’m a bit conflicted.
post-image
AMC+0.67%
I originally wanted to cut my losses as a sacrifice to the heavens, but the ceremony never happened—the meat cooked itself instead🍖A few days ago, the last thing I saw before bed was $SEI pushing slightly higher again, but the volume looked nothing like a genuine breakout. The selling pressure was massive, with someone dumping every time it surged. I thought to myself, if I don't short this level, I'd be letting myself down, so I entered directly at 0.06851. Feeling great, brothers😎

The subsequent price action gave me the complete answer, sliding all the way from my entry price to 0.04914.
post-image
SEI+2.40%
XRP+0.32%
ADA+0.77%
$ETH Signal】1H pullback long + 4H momentum support
$ETH Order-book sell pressure skewed -57.52%, yet the price is pinned at 2496.32. The 1H EMA20 at 2492.43 provides short-term support, while the 4H MACD histogram is expanding at 1.64, with the broader trend intact. The 1H MACD histogram is contracting at -0.32, indicating a short-term pullback.
🎯Direction: Long
⚡Entry/Limit order: 2489.64-2496.32
🛑Stop-loss: 2462.92
🚀Target 1: 2546.41
🚀Target 2: 2571.46
🛡️Trade management:
- Execution strategy: After reaching Target 1, reduce the position by 50% and move the stop-loss up to breakeven. I
post-image
ETH+1.06%
BTC+0.29%
SOL+2.41%
My hand trembled when I set the stop-loss a few days ago, only to realize this morning that the filial piety was unnecessary. 😌

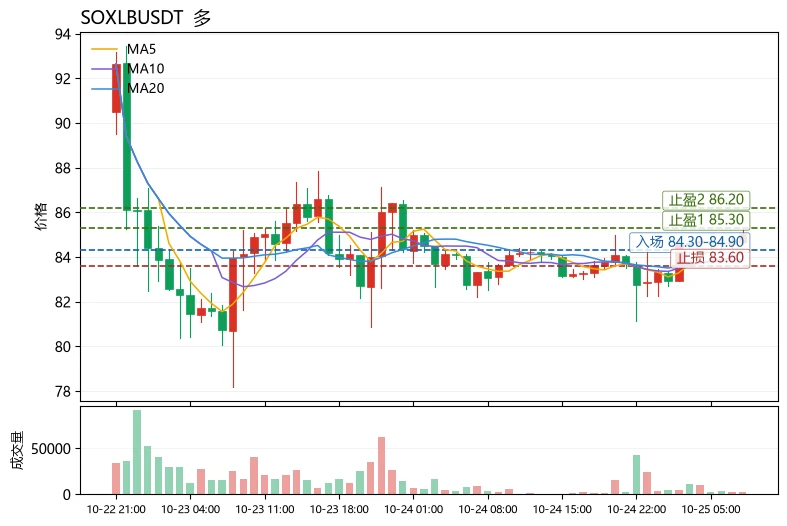
As the market repeatedly swung intraday, the price kept grinding around 91.82, with the volume shrinking more and more noticeably. Someone stepped in to buy every dip. I watched it for half a day; this kind of level is more of an opportunity than a panic signal, so I cautiously took a shot.

The price has now climbed to 104.92, giving a floating profit of +687.56%. We caught the rhythm of this move perfectly, and everyone is feeling great.

Don't lose your patien
post-image
ADA+0.77%
ZEC+19.99%
Everyone’s watching ARB’s range—but the 4h chart just whispered a secret that most retail is ignoring.

$ARB /USDT - SHORT

Trade Plan:
Entry: 0.18559 – 0.18925
SL: 0.20496
TP1: 0.17426
TP2: 0.16549
TP3: 0.15233

Why this setup?
Why now? The 1D trend is flat, yet the 4h structure is screaming SHORT with 55% confidence. RSI on 15m is at 59.58—not overheated, but stalling right under entry resistance (0.18742). ATR (0.00731) shows tight coils; break below 0.18559 opens the trapdoor to TP1 at 0.17426. This isn’t a reversal—it’s a range rejection play.

Debate:
If ARB taps 0.18925 first, do yo
ARB+4.20%
$RAY Signal】Long | 1H support holds after pullback
$RAY Pullback to near the 1H EMA20, with clear buy-side support orders on the order book and a 17.5% bullish depth imbalance. The 4H MACD histogram is contracting but remains above the zero line, while the price holds the key 1.24 level. The 1H RSI is 58, with most overbought pressure already released. The funding rate is a moderate 0.005%, showing no signs of overheating. The current risk-reward ratio is approximately 1.5, making it worth a try.
🎯 Direction: Long
⚡ Entry/limit orders: Enter in batches within the 1.243758 - 1.247500 range
post-image
RAY+40.61%
$DOOD Signal】Bullish breakout + overbought continuation
$DOOD RSI 14 surged to 91.21, while 1H/4H MACD showed dual bullish expansion, and the price advanced along the upper Bollinger Band. Depth imbalance stood at 16.31%, with clear bid support. 1H surged from 0.001673 to 0.001951 at a steep slope, while 4H volume increased simultaneously. The funding rate of 0.0351% remains moderate, and OI is stable. The price continues to be aggressively pushed higher in the overbought zone, with a risk-reward ratio of 1.5; strict stop-loss placement is required.
🎯Direction: Long
⚡Entry/limit order: 0.001
post-image
DOOD+29.01%
BTC+0.29%
ETH+1.09%
SOL+2.41%
Load More

Join 40 M users in our growing community

⚡️ Join 40 M users in the crypto craze discussion

💬 Engage with your favorite top creators

👍 See what interests you

View More