

Square
Following
Hot
News
Profile
Share your thoughts
placeholder
Article
10.14 Intraday ZEC Strategy Review
Intraday $ZEC Silk Road strategy failed:
Intraday, it failed to break through 1286 and hold above 1300.
A loss is a loss, and one must stand straight after taking a beating.
Analysis and explanation regarding CPI in the evening: Considering that the market maker should have pushed the price upward to make the shorts more aggressive and provide some liquidity before forming a major waterfall, it instead started falling directly. The original view of Duo Dan, targeting 852 and 2560, was therefore invalidated, so I exited early, preserving principal and leaving
AChenBit
Still unsure whether to go long or short tonight?
The current trend analysis gives you the answer:
Trading factors: After Bitcoin and Ethereum fell to test the bottom, they simultaneously entered range-bound consolidation. ZEC initially followed the broader market in consolidation, then broke upward out of the range, but pulled back after rising sharply, showing a clear divergence in strength. Previously, both experienced sharp declines to test the bottom, followed by capital entering to repair the damage after finding the bottom, but their subsequent trends diverged.
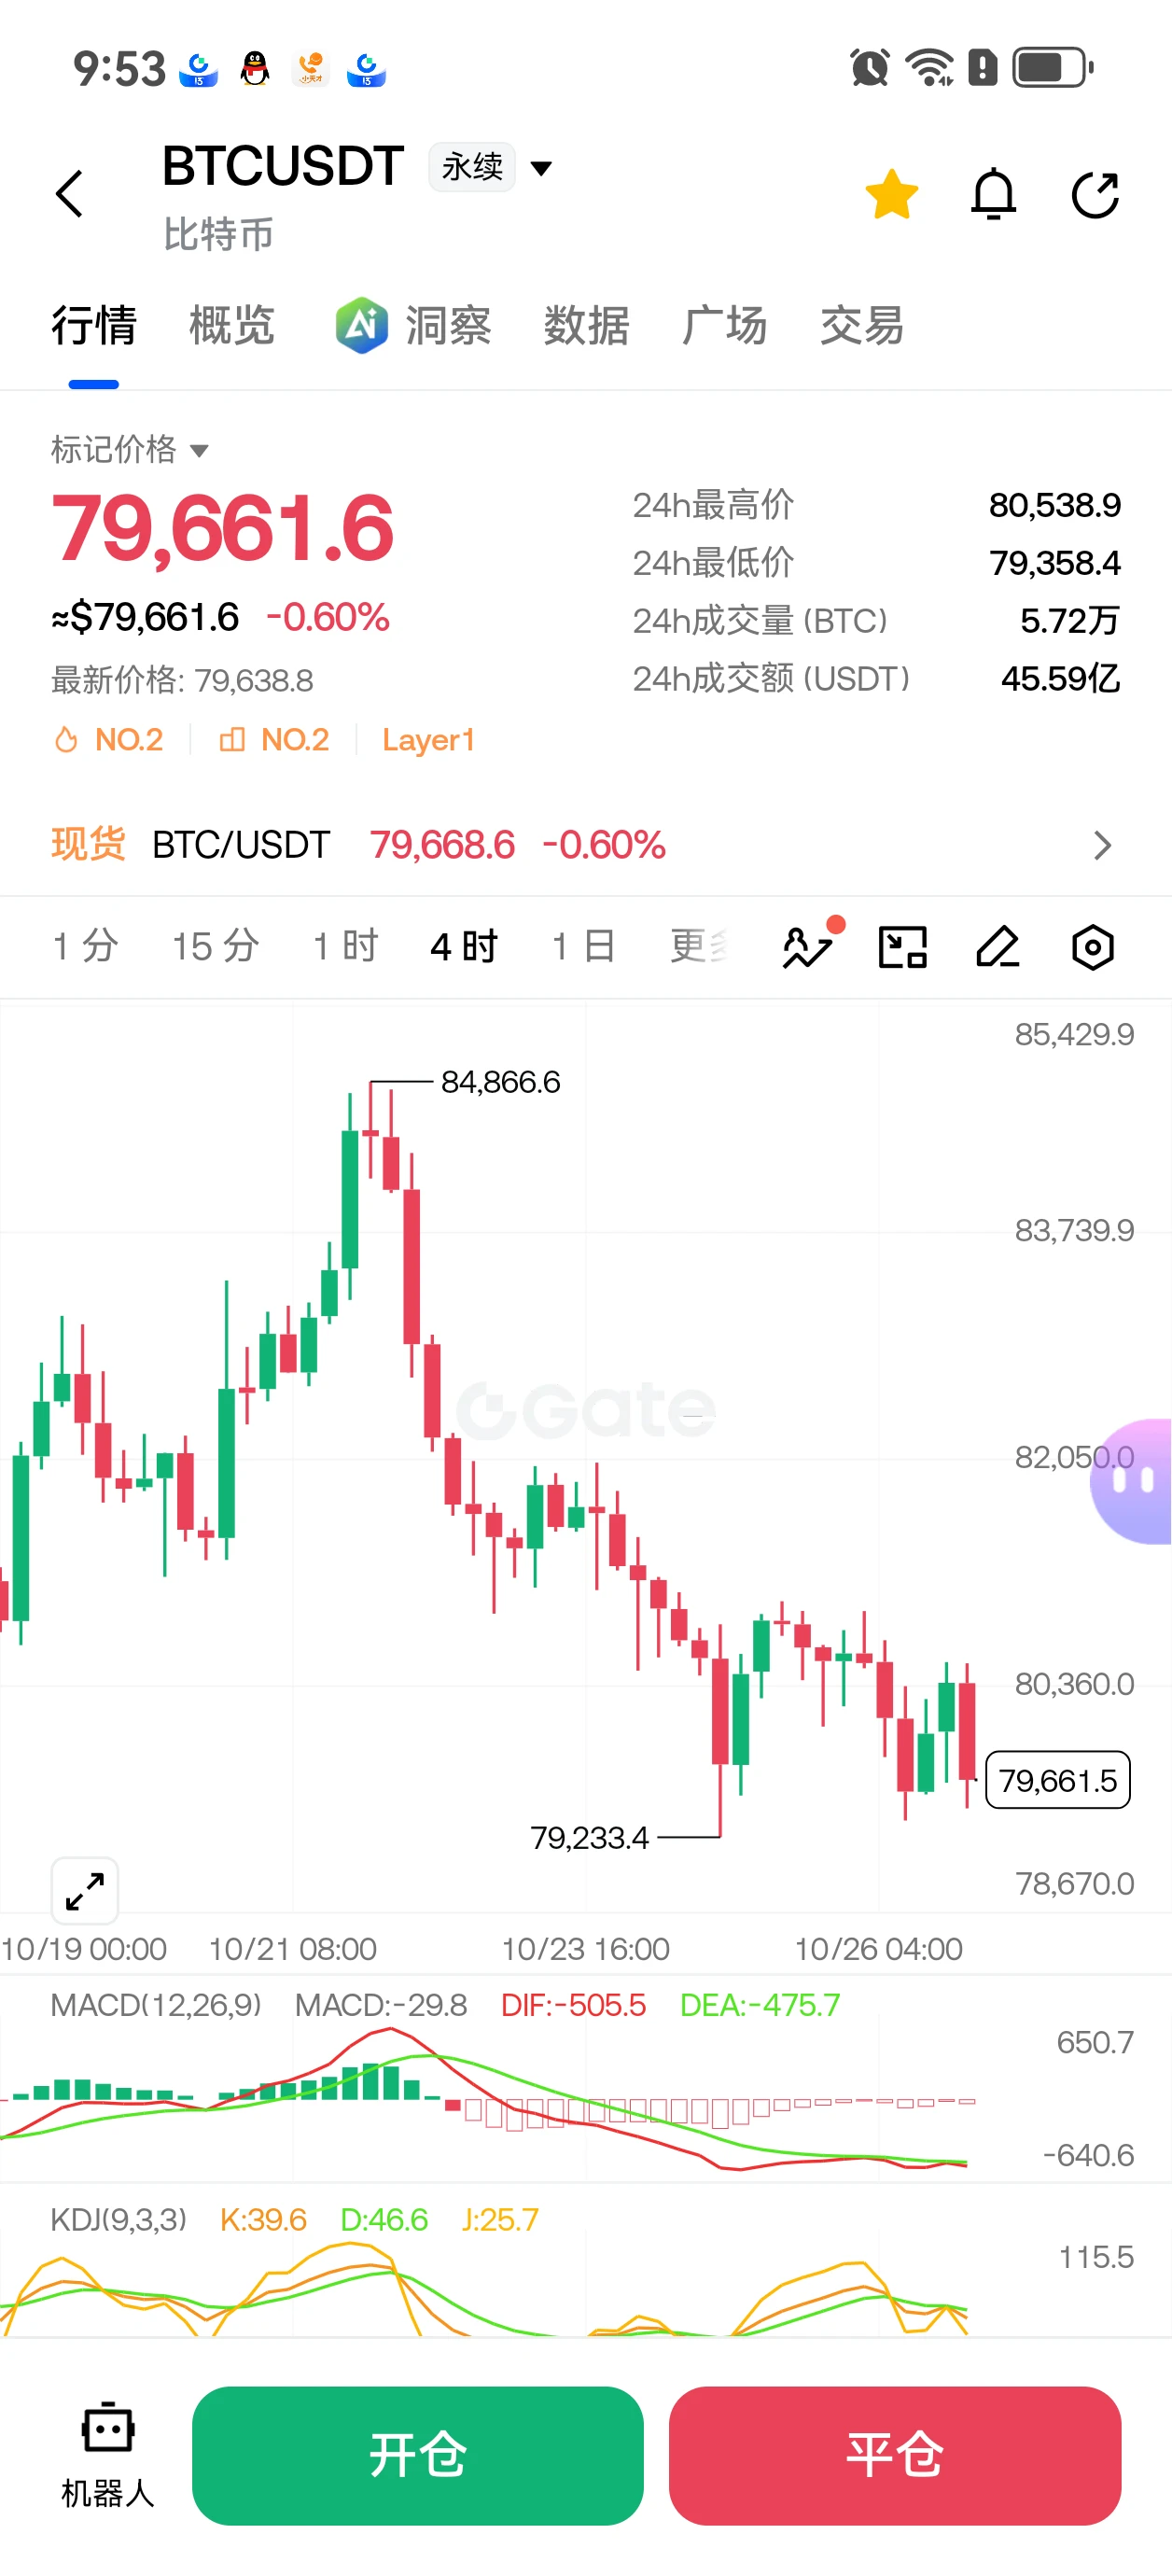
$BTC remains constrained within the range in the short term, with no clear one-way direction. Only a break above 84259 could open up further upside; a break below 82793 would weaken again and move lower. For now, focus on selling high and buying low, and do not bet on a breakout in advance.
$ETH has not yet developed an independent trend and is undergoing passive consolidation in line with the broader market. Resistance is at 2535 above, while support is at 2468 below. Bitcoin needs to break out of its range first before ETH can follow and choose a direction.
$ZEC is a strong asset within the sector and broke out first, but the breakout lacks sustained volume expansion, making a false breakout and retest likely. Key support is near 1233. If this level holds on a pullback, there will be another chance to rise; if it falls back inside the original range, it will return to a consolidation pattern and the bullish logic will become invalid.
CPI data will be released tonight, with risk and profit equivalent. Prioritize long positions on Bitcoin and Ethereum, targeting above 852 and 2560. Once these highs are reached, execute planB. Do not take long positions on ZEC; prioritize short positions at high levels, targeting the lower boundary of the range.
Tonight's data is highly likely to be favorable, preparing for a rate hike in November or December. Wicks in both directions may easily trigger stop-losses, so enter cautiously with small positions.
#韩林博士受邀牛津大学辩论社演讲
#美国9月CPI即将公布
#GateWCTCS9全球交易赛
repost-content-media
ZEC-4.15%
BTC-1.59%
ETH-2.95%
History doesn’t repeat perfectly, but sometimes the charts rhyme. 👀
In 2023, $BTC reclaimed its moving average, pulled back, and then continued higher.
Now in 2026, Bitcoin is showing a similar structure — with price testing the area around its rising moving average after a strong rally.
Will history rhyme again?
The key is whether BTC can hold support and regain momentum. The setup is worth watching, but confirmation matters more than comparison.
#USSeptemberCPITopsEstimates #ASMLTSMCQ3EarningsSoon
post-image
BTC-1.58%
  • 4
  • 1
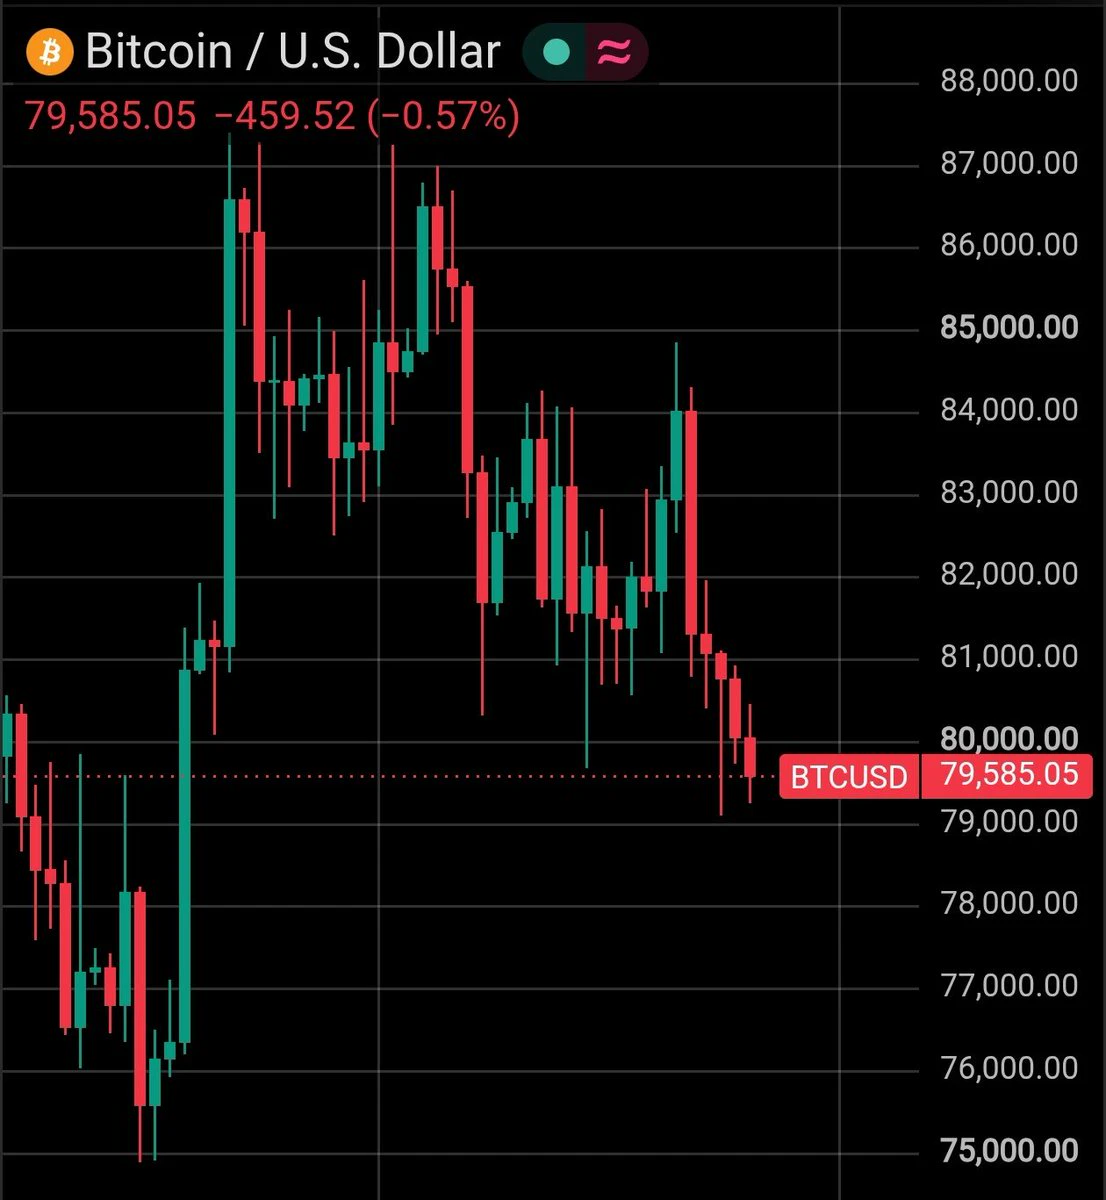
From yesterday to today, I really don’t know how many times I’ve warned: short, short, short—just around 83.8k and 84.3k is enough. I’ve said countless times that these levels are resistance, so why are so many people still not taking profits? I really don’t get it, I really don’t. 😴😴
$BTC #美国9月CPI超预期
BTC-1.59%
$Lobster Isn’t this Chinese mitten crab just following Pepe’s trajectory back then? If so, buying 100u could take off by Chinese New Year🚀
$PEP
post-image
龙虾-39.15%
PEPE-2.67%
Some things are worth holding through the cycles.
BAYC #9281 🦍
Pudgy Penguin #3568 🐧
Both have a place in my wallet for years to come. ♥️
PENGUIN-5.16%
You know you made it in crypto as a grifter when you start dressing like bitboy.
Hex and pulsechain founder
post-image
⏳ 5 days left|The next livestream is your chance to make the leaderboard!
Let valuable perspectives be seen, and let consistent creation earn rewards. Join Gate’s Social Rising Stars Launch, win GT rewards and official promotion, and make your mark on the leaderboard with the power of your content!
🎁 Three rewards await
1️⃣ Newcomer livestream: Complete the livestream tasks to unlock up to $50 GT
2️⃣ New and existing streamer leaderboard challenge: Complete 3 livestream tasks to participate in the leaderboard, with up to $30 GT in rewards
3️⃣ Rewards for engagement: Complete engagement tasks
GateLiveChinese
⏳ 5 days left|The next livestream is your chance to make the leaderboard!
Let valuable perspectives be seen, and let consistent creation earn rewards. Join Gate’s Social Rising Stars Launch, win GT rewards and official promotion, and make your mark on the leaderboard with the power of your content!
🎁 Three rewards await
1️⃣ Newcomer livestream: Complete the livestream tasks to unlock up to $50 GT
2️⃣ New and existing streamer leaderboard challenge: Complete 3 livestream tasks to participate in the leaderboard, with up to $30 GT in rewards
3️⃣ Rewards for engagement: Complete engagement tasks such as liking and commenting to win a Gate merchandise gift box!
📌 Sign up → Post a preview & complete the livestream → Post a recap
⏰ Campaign ends: October 19, 23:59
Only 5 days left—GT rewards are available on a first-come, first-served basis. Go live now and seize your chance to make the leaderboard!
👉 https://www.gate.com/zh/campaigns/6434
repost-content-media
GT-2.79%
$DEFI MASSIVE SEND INCOMING
post-image
$CRDO SMA200 retest on D1.
post-image
CRDO-8.79%
#USCPISoon #ShareWeekly
Headline CPI printed at 3.2 percent year-over-year, down from the previous 3.4 percent reading. Core CPI, which excludes the volatile food and energy components, came in at 2.2 percent year-over-year, declining from 2.4 percent and marking the lowest core reading since early 2021. Shelter inflation eased to 4.6 percent from 5.0 percent. Energy inflation slowed to 4.1 percent from 5.6 percent. Food inflation moderated to 2.0 percent from 2.2 percent. These percentage declines represent meaningful disinflation progress and have immediate implications for interest-rate ex
BTC-1.58%
ETH-2.93%
US500-1.31%
US30-0.40%
Insiders are quietly loading $SKHYNIX /USDT while the market sleeps.

$SKHYNIX /USDT - LONG

Trade Plan:
Entry: 1041.42 – 1048.54
SL: 1000.54
TP1: 1078.31
TP2: 1100.53
TP3: 1133.86

Why this setup?
Why now? The 1h price sits at 1045.04 inside a tight entry zone between 1041.42 and 1048.54, giving us a precise trigger. The 15m RSI at 40.19 shows room for upside before overbought territory, while the 1h ATR of 14.244025 confirms enough momentum for a sustained move. With the daily trend range-bound, a break above the entry high targets TP1 at 1078.31 and TP2 at 1100.53, but the line in the sa
SKHYNIX-5.51%
#NvidiaPlans2BMoreForEuropeanAI
NVIDIA at $220.83: European AI Expansion Meets a Critical Support Test
NVIDIA’s European AI expansion remains a strategically important story, but the price action is sending a different short-term message. With NVDA now trading at $220.83, the stock is approaching a key support zone after moving significantly below the previously discussed $228.91 level.
Jensen Huang’s plan to announce approximately $2 billion in new European AI deals adds to NVIDIA’s broader investment in the region. However, investors are now facing two separate questions: Can NVIDIA strengt
NVDA-2.90%
#美国9月CPI超预期 Bitcoin Faces a Fed Repricing Test as Inflation Hits 3.7%
The biggest risk after a hot CPI report is not always the first red candle. It is what happens when traders begin changing their expectations for interest rates.
On October 14, the U.S. September inflation report delivered a clear warning: price pressures are moving in the wrong direction. Headline CPI increased 3.7% year over year, up from 3.4% in August and above the 3.6% forecast. Monthly inflation accelerated to 0.6% from 0.4%. Core CPI, which excludes food and energy, rose 2.6% annually and 0.3% monthly. These figures m
post-image
BTC-1.58%
GAS+0.05%
🚨 Everyone, $BTW is showing a clear bearish continuation pattern, and the chart structure also confirms the weakness in the trend. Trading volume is declining with each candlestick, and sellers are in complete control of the trend.
Dear followers, please remain highly active now. Once the support level breaks, this move could continue rapidly. Short $BTW in time……the price could easily fall toward $2.00 to $1.80. Stay disciplined and do not rush into trades; follow the trend and lock in profits as the market progresses. Click below to trade now……👇
post-image
BTW+13.54%
$ETH Ethereum
History Repeating?
Baseline Test & Volume is KEY
Take a look at the two yellow boxes on this chart
Price action setup between early summer & right now looks almost identical at first glance
You have to read the rest of the JUICY details👇
post-image
ETH-2.93%
btc market updates
live-cover
LIVE1,134
$WAL Up 53% in 24 hours, but 0.0581 is not a level for you to chase.
People in the group were already circulating this before dawn—the pump came on the eve of the Fed minutes. CME interest-rate futures showed the probability of a June rate cut quietly climbing from 48% to 61%; as the dollar index weakened, altcoins began to stir. $WAL The 24-hour low was 0.0378 and the high was 0.0629, a range of over 66%, with $433 million in trading volume. This is not volume retail traders can generate.
But chasing the rise now carries significant risk. Funding rates have most likely turned positive, and a
WAL+58.05%
USIDX+0.34%
Many people use “it has fallen this much, so it will definitely rebound” as a reason to enter, which is a typical bottom-fishing misconception—the decline itself is not support; the moving-average structure is. Using $GTC
as an example, here is a reusable method: first assess trend health by looking at the relative positions of MA5 and MA20, then use RSI and MACD to verify momentum. Currently, $GTC spot price is 0.20783, with MA5=0.211402 still above MA20=0.210018. The short-term moving averages have not deteriorated, suggesting this -8.61% pullback is more likely a shakeout than a trend rev
post-image
ETH-2.93%
📊 The U.S. September CPI Dilemma: What’s Next for the Markets?
The latest U.S. CPI data is officially in, leaving the market facing another critical multiple-choice question. Both the September Consumer Price Index (CPI) and core CPI came in above expectations, highlighting that the path to cooling inflation will not be a smooth ride.
As these macroeconomic numbers shift the landscape, important questions arise regarding the future of Federal Reserve rate-cut expectations and overall market sentiment.
🔍 Key Questions on the Table:
Bitcoin's Next Move: Will BTC experience short-term dow
BTC-1.58%
ETH-2.93%
XAU-1.49%
NAS100-2.10%
  • 1
  • 1
Load More

Join 40 M users in our growing community

⚡️ Join 40 M users in the crypto craze discussion

💬 Engage with your favorite top creators

👍 See what interests you

Trending Topics

USSeptemberCPITopsEstimates

35.64k Views2.26k Discussing

US September CPI rose 3.7% YoY, above the 3.6% estimate; core CPI rose 2.6%, also above the 2.5% estimate. With inflation topping forecasts across the board, how will rate hike expectations shift? How will BTC react? Share your view.

DrLinHanSpeaksAtOxfordUnion

135.03k Views1.85k Discussing

GateWCTCS9GlobalTradingCompetition

37.32k Views6.11k Discussing

View More