Share your thoughts
placeholder
Article
I originally just wanted to watch the show, but my account ended up taking center stage and putting on a whole performance. As the market repeatedly swung back and forth, $SNDK tried to push higher several times but kept falling just short, and volume failed to follow. The bull-trap smell was too strong, so I immediately took a long position.

Entry price: 1500.51, simply betting that its rebound would lack strength. The subsequent move was indeed decisive, heading straight down. It’s currently at 1766.69, with +1259.54% secured—what a rush. That’s what it feels like to get the rhythm right.
post-image
SNDK+0.17%
LAB-3.18%
BTC-0.12%
Everyone's watching UAI's 15m RSI at 73.8—but that's the exact moment smart money loads the truck.

$UAI /USDT - LONG

Trade Plan:
Entry: 0.59538 – 0.61528
SL: 0.50986
TP1: 0.67694
TP2: 0.72467
TP3: 0.79628

Why this setup?
- 95% confidence on a 4h LONG isn't a guess; it's a signal.
- 1D trend is bullish, and the 1h ATR (0.0397) shows volatility is compressing—breakouts feed on this.
- Entry zone 0.595–0.615 is a gift before TP1 at 0.677 (up ~12%).
- The 15m RSI overbought? That's a pause, not a reversal—momentum is shifting higher.

Debate:
Are you fading this 4h long because of a 1
UAI+24.95%
$BTC Signal】Long + 1H V-shaped reversal, 4H negative histogram contracting
$BTC 1H V-shaped reversal; after the long lower wick touched 79125, buying pressure pushed the price back above 79700. The current price of 79821 is holding above the EMA20/EMA50 convergence zone.
🎯Direction: Long
⚡Entry/limit order: 79657.737 - 79821.700
🛑Stop loss: 79023.483
🚀Target 1: 81019.026
🚀Target 2: 81617.688
🛡️Trade management: - Reduce the position by 50% upon reaching target 1 and move the stop loss up to breakeven. If the price falls back to the entry level, exit automatically to protect the principal
post-image
BTC-0.12%
ETH+0.63%
SOL+2.17%
Financial News, Crypto Updates, Real-World Strategies
live-cover
LIVE1,279
$XAN Signal】Long | 1H momentum continuation + funding rate anomaly
$XAN Funding rate anomaly at 0.0312%, 4H Bollinger upper band at 0.0177 was directly touched, and the MACD bullish histogram is expanding. 1H buying repeatedly absorbed sell pressure above 0.0174, with the order book depth imbalance of 3.48% favoring buyers. RSI 78 has entered the overbought zone, but short-term momentum has not weakened; tight stop-losses are mandatory when chasing longs.
🎯 Direction: Long
⚡ Entry/limit order: 0.01769276-0.01774600, directly target entry at the current price
🛑 Stop-loss: 0.01756854
🚀 Tar
post-image
XAN+23.45%
162,000 new jobs, but two-thirds came from waiting tables and teaching kids? This data is seriously inflated
My first reaction when the nonfarm payrolls report came out was, “It’s over, we’re going to drop,” but after calming down and digging into the data, I found that those 162,000 jobs were nowhere near as impressive as they looked.
The new jobs were heavily concentrated in low-wage industries. Of the 162,000 jobs, the hospitality and food services sector jumped by 62,000 in a single month—note that this sector had already declined for two consecutive months, so this was purely a technical
SNDK+11.88%
#RedBullTradingTourSeason6
Red Bull Trading Tour Season Six Kicks Off With High Energy
Red Bull Trading Tour is back for its sixth run, and buzz is high across the trading crowd. Known for mixing pro insight with bold live action, the tour turns chart reading into a real-world arena. This season brings new cities, new faces and a fresh prize pool, with a focus on skill, speed and clear risk control. Early sign-ups show strong interest, as both past finalists and new challengers aim to claim a seat on the leaderboard.
① What Makes This Tour Stand Out
Unlike pure online contests, this tour blen
  • 9
  • 5
Bitcoin’s long-term trend still looks bullish.
But $440K? That’s a massive move.
If adoption, liquidity, and institutional demand keep growing, could $BTC eventually get there? 👀
The real question is: how high can Bitcoin go this cycle?
post-image
BTC-0.15%
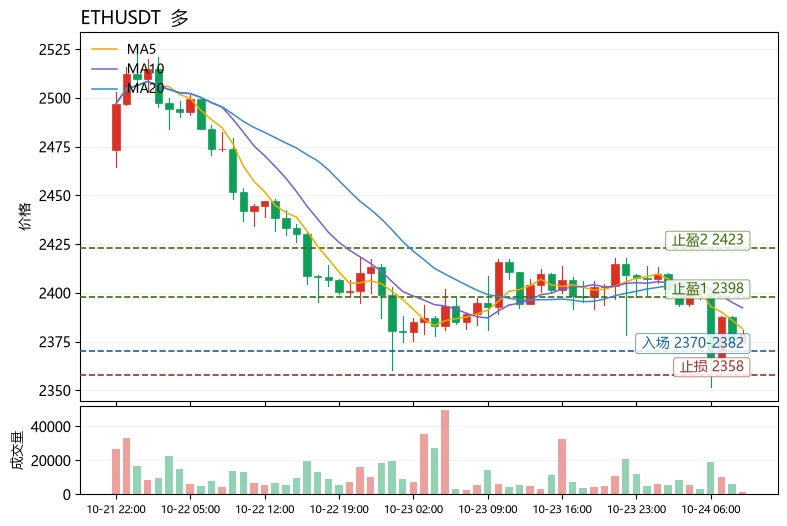
$ETH Signal】Multi-timeframe friction, long entry orders positioned at 2475-2483
$ETH Order book depth imbalance -37.24%, with price testing the 2475-2483 support zone. The 1H MACD bearish divergence is expanding, while the 4H MACD histogram is narrowing, creating conflicting multi-timeframe directions. RSI is 47.59 on 1H and 54.02 on 4H, with buyers not fully withdrawn. The 2459 low is holding, and the funding rate is 0.0014%. With a 1.5 risk-reward ratio, it is worth a try.
🎯Direction: Long
⚡Entry/limit order: 2475.89 - 2483.34
🛑Stop-loss: 2458.51
🚀Target 1: 2520.59
🚀Target 2: 2539.22
🛡
post-image
ETH+0.67%
BTC-0.15%
SOL+2.17%
Everyone’s staring at SUI’s range—but the 4H tape is quietly loading the short that nobody’s ready for.

$SUI /USDT - SHORT

Trade Plan:
Entry: 0.7908 – 0.7958
SL: 0.8177
TP1: 0.7750
TP2: 0.7628
TP3: 0.7445

Why this setup?
Why now? The 1D is *range*, not trend—so we fade the top, not chase it.
- Price sits at 0.7933, with RSI (15m) at 46.6: no buying pressure to break out.
- ATR (1h) at 0.0101 means tight stops—but our SL at 0.8177 gives a 3% buffer against a fake pump.
- TP1 at 0.7750 is the first magnet; if that cracks, TP2 at 0.7628 opens a fast 200-pip slide.
This is a low-conv
post-image
SUI-1.57%
I did nothing—just went to the bathroom, and by the time I came back, the candlestick chart had already done the work for me.

A few days ago, before bed, I was watching the last hourly candle on $RIVER . It kept hovering around 6.705, and both attempts to break higher were immediately pushed back down. The resistance above was too obvious, and volume wasn’t keeping up. I marked a note in my plan at the time: this isn’t a suitable level to chase longs; those looking to short can try with a small position. While others were still waiting for a breakout, I had already placed my short order.

W
post-image
RIVER-5.99%
ADA-0.68%
ETH+0.67%
#HYPEBreaks88HitsNewAllTimeHigh
HYPE Hits $89: The Price Is Rising, But the Institutional Story Is Even Bigger
HYPE has pushed through the $88 level and is now trading around $89, putting Hyperliquid firmly back in the spotlight.
But this move is not simply another crypto token rally.
What makes the current HYPE story particularly interesting is the combination of new price discovery, institutional exposure, and growing recognition of DeFi infrastructure.
According to the institutional ownership figures reported on September 6, around 30 institutional holders controlled approximately 115,000
HYPE+2.60%
  • 1
This was purely the market being in a good mood and casually scattering some gold coins—one just happened to hit me on the head. A few days ago in the afternoon, while watching $CLO ’s order book, I noticed something was off: the price kept hovering around 0.06977, but every dip was quickly bought back up. Signs of strengthening bottom-side buying like that can’t be faked. I added to my long position amid the repeated intraday swings and didn’t say much to anyone, posting only one line: “If the retest holds, I’ll test the waters.” Not long after, the move started paying me back.

I just check
post-image
CLO-5.33%
XRP-0.60%
DOGE-3.63%
#BTCReclaims80K
#BTC ‌The $80K Battle Is Getting Interesting
Bitcoin is trading around $79,950, with the current session holding a relatively tight range between roughly $79.5K and $80.1K. After the recent recovery from the June lows, BTC has managed to return to the $80K area, but the real question now is whether buyers can turn this level into support rather than another temporary resistance zone.
The broader structure is constructive, but it is not risk-free.
One of the strongest factors supporting BTC right now is institutional demand. U.S. spot Bitcoin ETFs recorded approximately $730.8
post-image
BTC-0.15%
Everyone’s chasing the 15m RSI pop—I’m watching $SOXL /USDT bleed from 123.64 instead.

$SOXL /USDT - SHORT

Trade Plan:
Entry: 123.43 – 123.85
SL: 125.64
TP1: 122.14
TP2: 121.14
TP3: 119.64

Why this setup?
- 4h bias says SHORT, but the 1D trend is just *range*—no breakout fuel.
- RSI(15m) at 71.58 is overheated; mean reversion pulls price back to the 1h ATR floor (0.834).
- Entry zone 123.43–123.85 sits right under resistance. Why now? Because TP1 at 122.14 is only a 1.2% drop—but TP2 at 121.14 gives us 2% with momentum fading.
- Stop at 125.64 is tight—risk/reward is 1:2.3 if you r
post-image
SOXL+6.52%
Why is $SKHYNIX /USDT's 15m RSI at 41.93 while the 4h chart screams lower—most traders are already late.

$SKHYNIX /USDT - SHORT

Trade Plan:
Entry: 1278.91 – 1281.75
SL: 1293.92
TP1: 1270.14
TP2: 1263.34
TP3: 1253.15

Why this setup?
This isn't a breakout; it's a controlled descent. With 1D stuck in 'range' and ATR at 5.66, volatility is compressing before a snap. The short setup is armed: entry 1280.33, but the real meat is TP2 at 1263.34. Why now? The momentum divergence between the 15m (cooling off) and the 4h bias (SHORT) means smart money is distributing into that 1281.75 high. If we
SKHYNIX+0.65%
Everyone’s chasing green candles, but HYPE’s 15m RSI just flashed 42.65—are you early or early exit?

$HYPE /USDT - LONG

Trade Plan:
Entry: 87.64 – 88.08
SL: 85.70
TP1: 89.48
TP2: 90.55
TP3: 92.17

Why this setup?
- 4h structure is screaming LONG with 95% confidence while the 1D trend remains bullish.
- The pullback to 87.86 (entry ref) is a textbook retest of a broken range—not a reversal.
- ATR (0.898) suggests volatility is compressing; the next expansion historically favors the trend side.
- Why now? RSI cooling off on lower timeframes gives the bull a clean springboard before TP
HYPE+2.60%
ETF Flows Stabilize After Recent Pressure! Can BTC & ETH Build Fresh Momentum?
live-cover
LIVE379
🚀The sector is making a full-throttle push, with the bulls driving an explosive rally. $UAI After an extended period of bottoming at low levels, repeated volatility and shakeouts wore down many traders’ patience, causing them to dump their holdings early and miss the subsequent surge.
Order-book data shows that buying support in the bottom range has continued to strengthen, tokens have changed hands extensively, incremental capital has continued to enter, and bullish momentum has steadily built up. Opened a 50x leveraged long position at an average entry price of 0.38561, ignoring the shakeou
post-image
UAI+24.95%
ETH+0.67%
BTC-0.12%
A few days ago, I was still calculating whether I had enough money for instant noodles this month; this morning, I was already wondering whether to add a sausage. The last thing I saw before bed was $TAO holding steadily at the lows, with volume shrinking while key levels kept moving higher. The funds came in quietly, not with a big commotion.
Following the bullish direction at the time, I placed an order at 225.0. The logic was straightforward: hold above support on the pullback and form a base without breaking down. Positions at this level are easy to hold, the stop-loss is close, losses are
post-image
TAO+10.45%
ADA-0.68%
BTC-0.12%
Load More

Join 40 M users in our growing community

⚡️ Join 40 M users in the crypto craze discussion

💬 Engage with your favorite top creators

👍 See what interests you

View More