
Share your thoughts
placeholder
Article
#MU just crossed back above $1,000 — but the interesting part isn't the number itself. It's what has changed underneath the stock.
Micron closed the latest session at $1,016.59, gaining about 6.1% and finishing the week roughly 9% higher. The move came alongside a broader semiconductor rally, but MU had its own fundamental reason to attract buyers: the AI memory cycle is getting stronger.
Micron's latest quarter was unusually strong.
Fiscal Q3 revenue reached $41.46B, while GAAP net income came in at $28.24B. Even more important for the forward outlook, Micron guided fiscal Q4 revenue to appro
MU+5.89%
  • 1
I originally wanted to hold the position until the end of time, but it obediently came down on its own. 😂

When I checked the chart after lunch, the resistance above $TSLAX was too obvious. Every time it moved up, there was no one willing to take the other side, and the rebound was pitifully weak. I directly said this was where the bears should step in, so I opened a short on the rebound and left the rest to the market. Sure enough, it slowly declined afterward, with the rhythm basically on point. 🙌

I entered at 361.69, and it has now reached 356.94, with a +118.22% return already in my p
post-image
TSLAX+0.34%
LAB-4.42%
ADA+0.70%
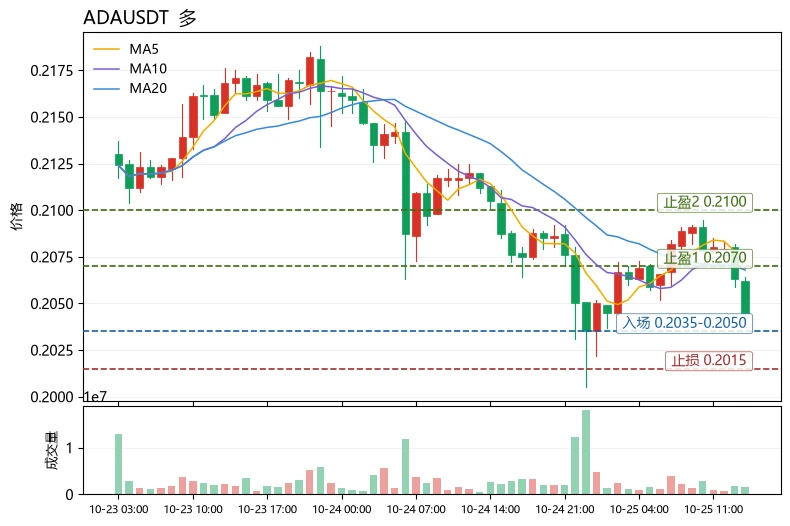
This was purely the market being in a good mood and casually tossing out some gold coins—one just happened to hit me on the head. 🤔 While everyone else was running, I instead spotted a shorting opportunity on $MOVR —a drop isn’t panic; a low-volume rebound is the real bull trap, and insufficient buying support is the shorts’ best fuel.

I opened a short position around 0.995, and before long, the market had moved down to 0.816, with the account showing +216.35%. Those who got on board should be laughing in their sleep—the price dragged its feet for ages on the way up, then came down cleanly
post-image
MOVR-0.61%
BTC-0.05%
ADA+0.70%
What I posted yesterday is indeed something many beginners just can’t figure out··· Let’s put it in more straightforward terms···
For example, with a 95% win rate, and a stop-loss on every trade, does that mean he is guaranteed to make money?
Not necessarily, absolutely not··· If you see someone constantly emphasizing their win rate while never mentioning their risk-reward ratio, you should basically steer clear···
Using the simplest calculation, suppose every trade is 100u at 100x leverage, with the take-profit set by default at 0.5–0.7%. Then the profit from each take-profit trade is 5
post-image
4-12.88%
There is nothing new on Wall Street. While others are competing in popular coins, I set my sights on Raydium in the Solana ecosystem. Recently, $RAY protocol bought back over 30% of its circulating supply, and Revolut gave it exposure to 5 billion people, making the fundamentals rock-solid.
Technically, it just broke through the long-term downtrend line. At Gate’s Red Bull arena, I opened a long on RAYUSDT at 1.1222 with 25x leverage to fully capture the main upward wave, taking profit at 1.3570 after a surge of +513.45%!
But Livermore warned: leverage is a meat grinder. Follow the path of le
post-image
RAY+59.82%
BTC-0.05%
ETH+1.06%
Market update
live-cover
LIVE1,089
#ZEC Major sell signal, with multiple sell signals stacking up—go straight short! If the move continues, add to your position at 1350 and 1250!
Only those who can't see the situation clearly are going long—seize this move.
post-image
ZEC+15.42%
Sunday Evening Market Updates
live-cover
LIVE2,152
#Bots I'm trading HYPE/USDT with Gate's Spot Grid bot. Join me!
post-image
HYPE+3.98%
The direction was right; the only question left is whether you can hold on. I caught this wave of $WLD 's surge, which took roughly two or three false breakouts from structural confirmation to a genuine breakout on volume before it truly established itself. Floating profits retraced for a while after entry, but once that bullish candle appeared, I knew the bulls had the upper hand.
Technically, I prioritize the price-volume relationship. The breakout candle had sufficient volume, and the pullback did not erase the gains, which is a relatively healthy sign. The price repeatedly tested the 0.4169
post-image
WLD+4.43%
ZEC+15.42%
ADA+0.70%
【$BULLAU Signal】Go long + 1H MACD bearish contraction
$BULLAU Order book depth imbalance -2.30%, buy orders are slightly thin, and the current price of 0.077148 is sitting just below the 1H Bollinger middle band. The 1H MACD histogram at -0.0019 continues to narrow, indicating weakening bearish momentum. The 4H MACD histogram is +0.0017, with bullish momentum still present but slowing. The price is trading above the 1H EMA20 at 0.0756, while the bullish EMA50 alignment at 0.0651 remains intact.
🎯 Direction: 【Go long】
⚡ Entry/Orders: 【0.07691656 - 0.07714800】
🛑 Stop-loss: 【0.07637652】
🚀 Ta
post-image
Everyone’s watching $ETH /USDT sideways—but the 4h tape is quietly loading a trapdoor.

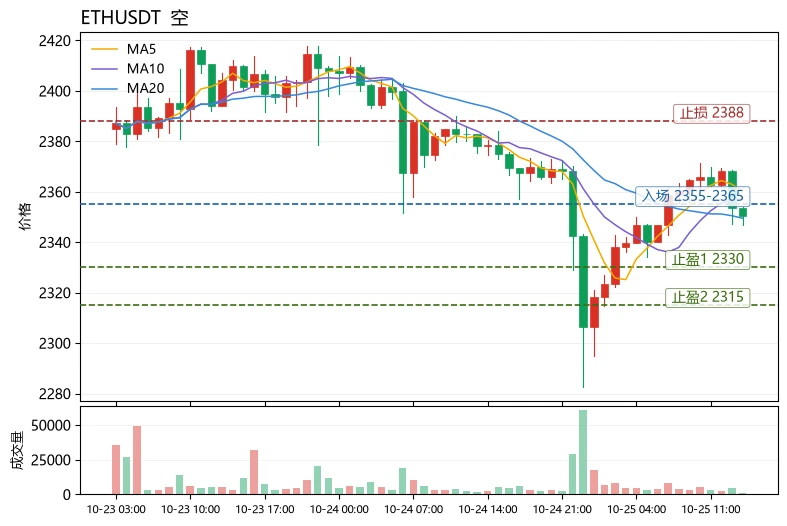
$ETH /USDT - SHORT

Trade Plan:
Entry: 2496.36 – 2502.06
SL: 2526.56
TP1: 2478.69
TP2: 2465.02
TP3: 2444.50

Why this setup?
Why now?
- 1D trend is *range*, not bull—so rallies are sellers’ gifts.
- RSI 15m at 49.23 = zero momentum, just waiting for direction.
- ATR 1h at 11.39 means volatility is coiled; the 2499.21 ref is the pivot.
- Short setup armed: TP1 2478.69, TP2 2465.02—risk to SL 2526.56 is only ~1% for a 1.4% move down.

Debate:
If price taps 2499.21 again, do you fade it or wait for
ETH+1.06%
$BTC Signal】Go long + buy the pullback amid a bullish order-book tilt
$BTC Order-book buy/sell ratio 1.12, with depth imbalance favoring buyers. The 1H MACD negative bar is expanding, while the price is moving sideways in the 79720-79970 range. The 4H Bollinger Bands are narrowing, with the middle band at 80053 still overhead. OI is stable, and the funding rate is 0.0036%, showing no signs of overheating.
🎯Direction: Long
⚡Entry/Limit order: 79629.971 - 79794.500
🛑Stop-loss: 78996.555
🚀Target 1: 80991.418
🚀Target 2: 81589.876
🛡️Trade management:
- Execution strategy: After reaching Targe
BTC-0.05%
Every era has its king, and this cycle belongs to Robinhood again.
I checked Robinhood’s on-chain revenue over the past 24H, which at one point exceeded $6M, making it the highest among public chains.
From DeFi to the zoo, then from MEME to inscriptions, and now to the coin-stock concept, the first wave of every innovation can take off.
Now we’ll see whether any public chain can replicate Robinhood and keep up, so those who missed out can at least get a share. 🫡
post-image
MEME-2.33%
Everyone’s staring at gold, but the real trap is silver’s 4H ceiling—$XAG /USDT just armed a short at 66.28.

$XAG /USDT - SHORT

Trade Plan:
Entry: 66.26 – 66.30
SL: 66.47
TP1: 66.13
TP2: 66.04
TP3: 65.89

Why this setup?
- Why now? Price is pinned at 66.28 with RSI (15m) at 49.93—no momentum to break higher.
- 1D trend is *range*, not breakout. That means resistance holds until proven otherwise.
- ATR (1h) is 0.08—tight coils snap fast. Target TP2 at 66.04 is just 0.36% away, but SL at 66.47 caps risk at 0.29%.
- The math favors the short: 2.2R to TP2, but only 0.6R to invalidation
XAG0.00%
【$RAYSOL Signal】Long | 4H MACD bullish expansion
$RAYSOL RSI 4H 79.52, buying demand gap.
4H MACD bullish momentum is expanding, while the 1H red bars are shortening, indicating insufficient short-term follow-through. Order book depth imbalance: -7.90%; the share of aggressive buyers is declining. OI is stable, with the funding rate at -0.0128%; shorts have not retreated.
🎯Direction: Long
⚡Entry/Limit order: 1.131495 - 1.134900
🛑Stop-loss: 1.078155
🚀Target 1: 1.220017
🚀Target 2: 1.262576
🛡️Trade management:
- Execution strategy: After reaching Target 1, reduce the position by 50% and move
post-image
BTC-0.03%
ETH+1.09%
SOL+3.00%
A like tells you someone saw your content. A subscription tells you they want to see more.
That’s an interesting shift for creators building an audience on Gate.
If you’re already sharing market analysis, trading strategies, market observations, or discussing the market during livestreams, Gate Social Subscriptions gives you the option to create a more focused space for people who genuinely want deeper content.
You can decide which content remains public and which content is available to subscribers. You can also set your own subscription price, while Gate says creators currently receive 0% re
#ETH Ethereum is trading around your quoted $2,492, and the latest market snapshot is also around $2,494, with an intraday high near $2,521 and low around $2,452. The broader 24-hour move is roughly +1.5–2%. Recent market analysis shows ETH continuing to hold its strong monthly recovery, while institutional demand and ETF flows remain important catalysts.
ETH Momentum — Why Traders Are Watching $2,500
ETH's current structure is interesting because price is sitting directly around the major $2,500 psychological level. This is the decision zone between continuation and another rejection.
Recent
post-image
ETH+1.09%
  • 1
Cryptocurrency Trading Strategy
Lesson 1 :
post-image
August nonfarm payrolls rose by 162k—should BTC and U.S. stocks be cautious? The real variable is interest rates
U.S. August nonfarm payrolls beat expectations, with 162k jobs added, nearly three times the market forecast of 56k; June and July employment figures were also revised up by a combined 55k.
What does this mean for risk assets?
Simply put: The market had been expecting the narrative of “economic cooling → Fed rate cuts → liquidity release,” but a plot twist has suddenly emerged.
Strong employment has prompted the market to start betting again that the Fed may maintain higher interest
TSLA-5.96%
  • 55
Load More

Join 40 M users in our growing community

⚡️ Join 40 M users in the crypto craze discussion

💬 Engage with your favorite top creators

👍 See what interests you

View More