Share your thoughts
placeholder
Article
Financial News, Crypto Updates, Real-World Strategies
live-cover
LIVE1,496
Everyone’s watching ARB’s range—but the 4h chart just whispered a secret that most retail is ignoring.

$ARB /USDT - SHORT

Trade Plan:
Entry: 0.18559 – 0.18925
SL: 0.20496
TP1: 0.17426
TP2: 0.16549
TP3: 0.15233

Why this setup?
Why now? The 1D trend is flat, yet the 4h structure is screaming SHORT with 55% confidence. RSI on 15m is at 59.58—not overheated, but stalling right under entry resistance (0.18742). ATR (0.00731) shows tight coils; break below 0.18559 opens the trapdoor to TP1 at 0.17426. This isn’t a reversal—it’s a range rejection play.

Debate:
If ARB taps 0.18925 first, do yo
ARB+5.64%
This was purely the market being in a good mood, casually scattering a few gold coins that happened to land right on my head. ✨

While everyone was still waiting on the sidelines, $WLD stayed around 0.3669 for a long time, with volume shrinking the longer it moved sideways. I figured most of those who wanted to leave had already done so, and this level was worth taking a position at, so I set up my trade in advance.

When I checked the chart again, the price had already reached 0.4224, with unrealized gains at +1074.08%. The profit wasn’t huge, but it felt good to take.

The prerequisite f
post-image
WLD+4.61%
DOGE-0.73%
ADA0.00%
Everyone’s watching the 4H timeframe, but the real trap is hiding in the 15-minute RSI.

$BULLA /USDT - SHORT

Trade Plan:
Entry: 0.071460 – 0.074848
SL: 0.089419
TP1: 0.060955
TP2: 0.052823
TP3: 0.040624

Why this setup?
- BULLA flashes SHORT at 55.4% confidence, yet the 15m RSI sits at 47.2—not oversold, not exhausted.
- Price is pinned at 0.073154 inside a 1D range, with ATR (0.0067) hinting at a squeeze.
- Why now? The range low at 0.071460 is the last defense; a break there opens the slide to TP1 (0.060955) and beyond.
- If bulls reclaim 0.074848, the alt setup flips to long—this
BULLA-7.78%
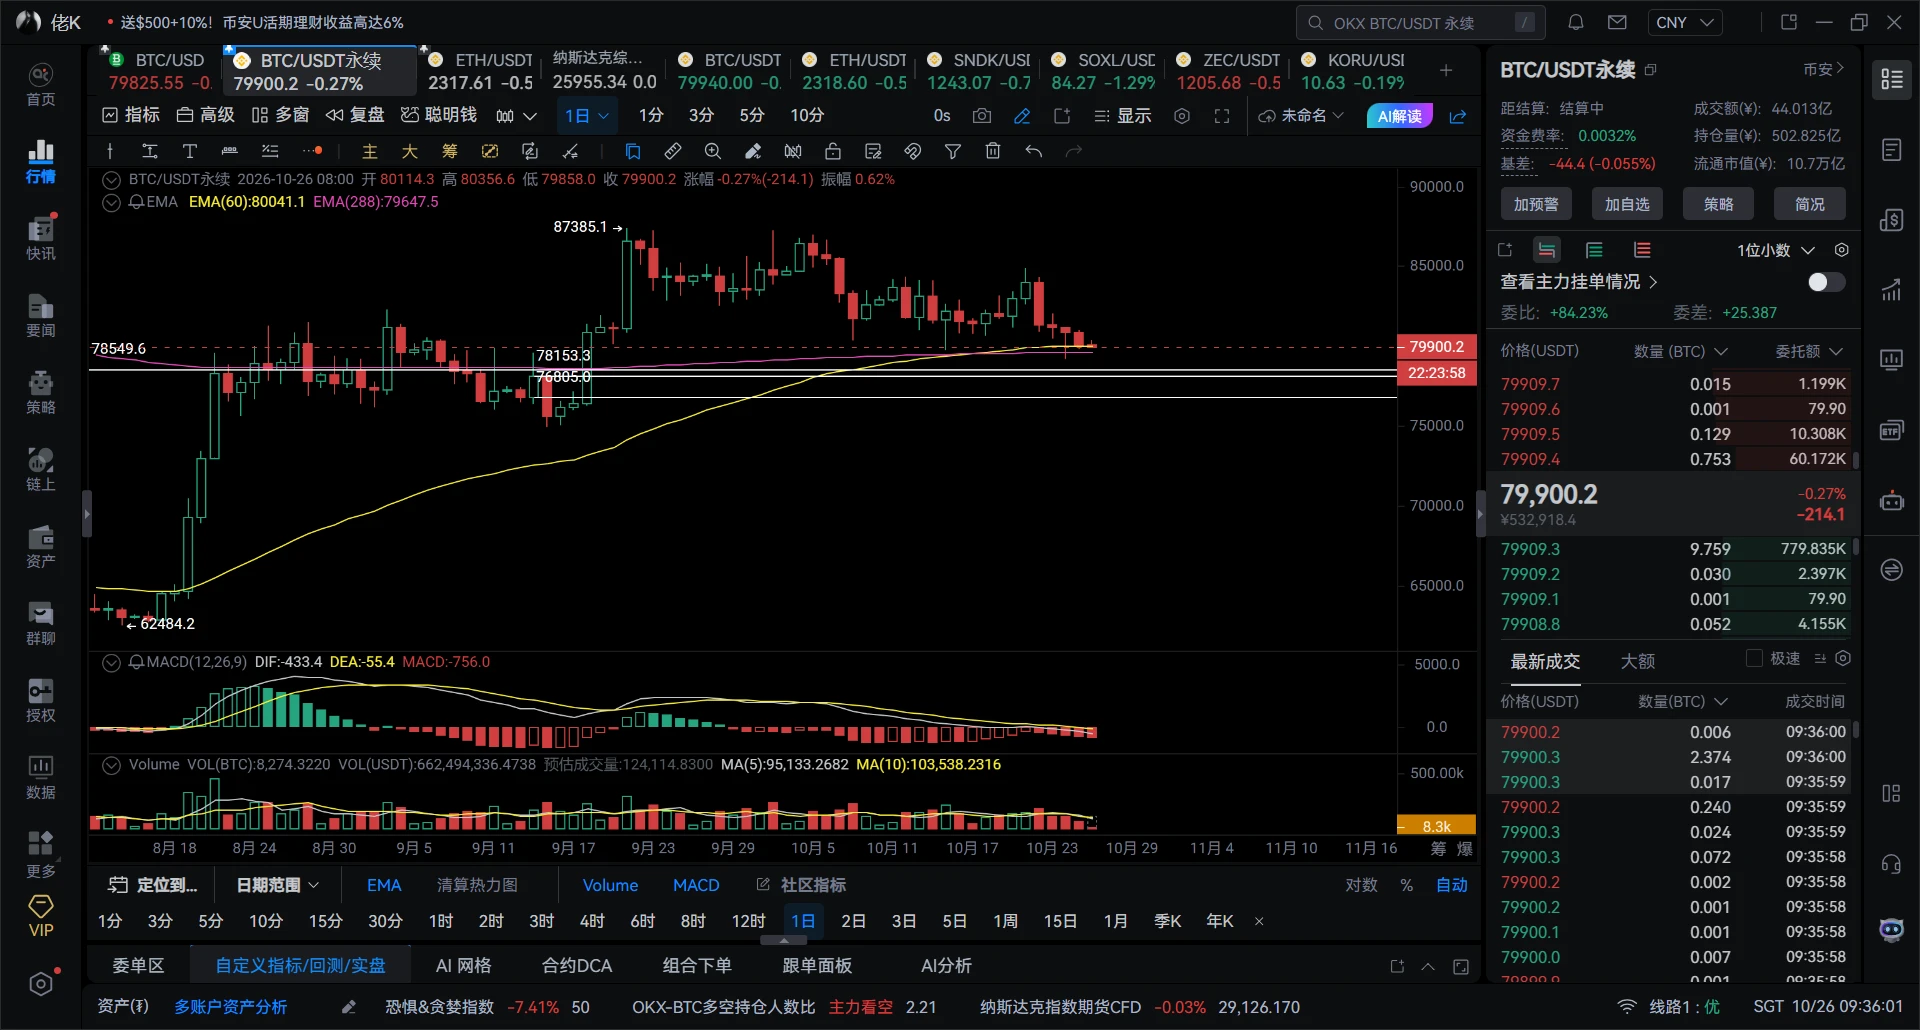
Bitcoin swing longs and swing shorts both pocketed 800 points🥩
Going long on the way up and short on the way down—feels great!!!
BTC-0.15%
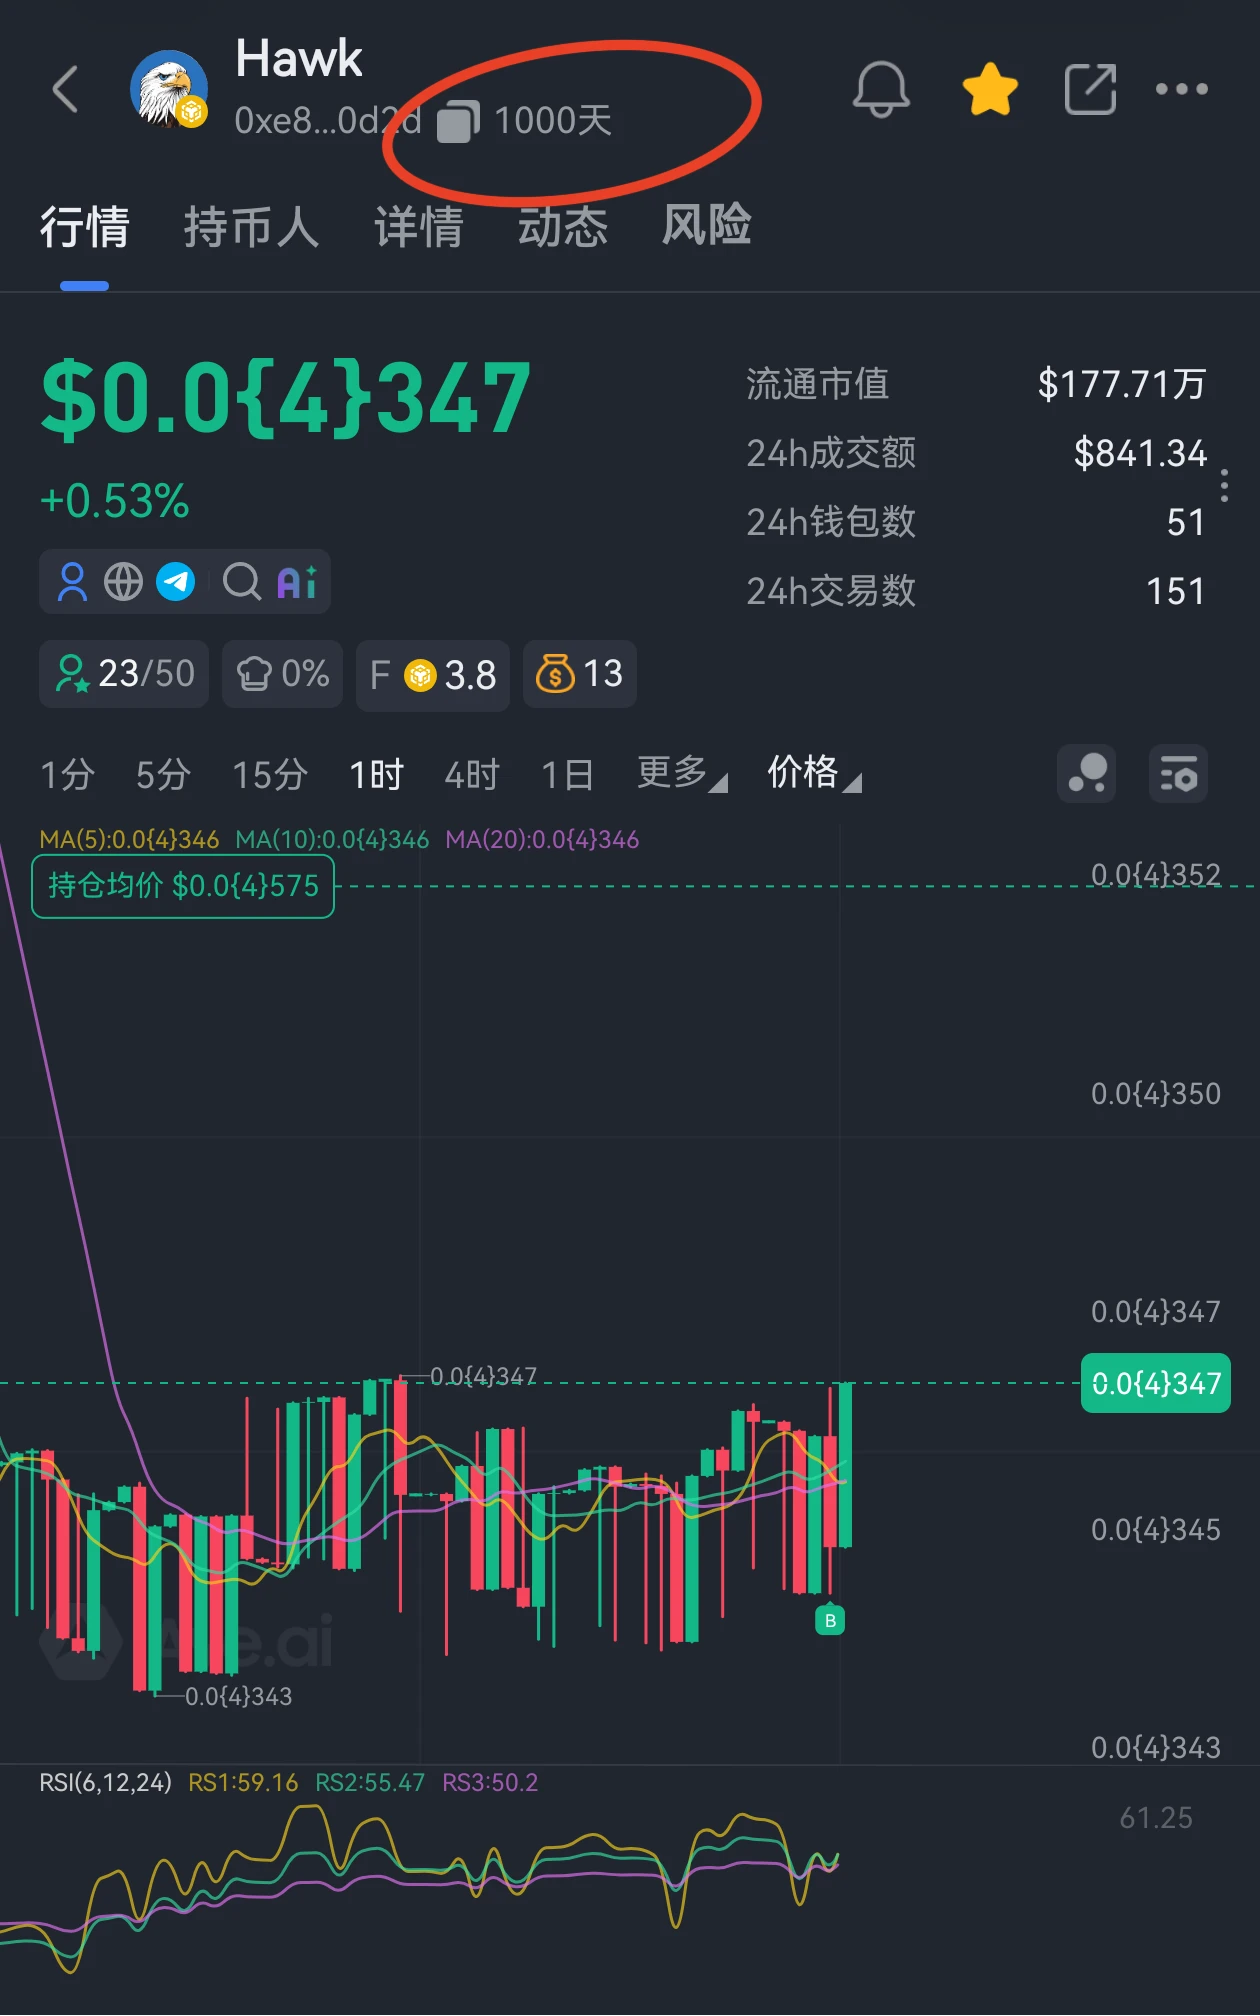
This profit has me feeling both thrilled and apprehensive, afraid the market will catch on tomorrow and blacklist me😂 I opened the chart this morning and saw $SAHARA still grinding around the highs, with a weak rebound and no volume on the way up. I immediately felt something was off with the trend—it looked exactly like a bull trap😏

Right after I finished reading the bearish news, it happened to give me an entry for a short at 0.03226. I wasn't expecting to make much, but when I checked just now, the current price had already dropped to 0.00932, with +3424.49% firmly in my hands. Staying
post-image
SAHARA-0.64%
LAB-4.13%
SNDK+1.13%
Everyone’s watching $SPCX /USDT pump—but the 4h chart just whispered a secret that most retail will ignore.

$SPCX /USDT - SHORT

Trade Plan:
Entry: 151.06 – 151.26
SL: 152.44
TP1: 150.20
TP2: 149.56
TP3: 148.60

Why this setup?
- Price is pinned at 151.16 with a **SHORT bias (77% confidence)** while the daily trend says “range”—that’s a compression zone.
- RSI on 15m is only 57.97—not overheated, not cold. It’s a **lull before a snap**, not a breakout signal.
- ATR on 1h (0.41) is tight—meaning the next 4h candle could stretch 3x that move.
- The “Waiting” status + invalidation at 14
SPCX+0.93%
Everyone’s staring at $ETH /USDT’s range—but the 4h clock just started ticking for the quiet exit.

$ETH /USDT - SHORT

Trade Plan:
Entry: 2492.99 – 2499.19
SL: 2525.89
TP1: 2473.74
TP2: 2458.85
TP3: 2436.50

Why this setup?
Why now? The 1D says “range,” but the 4h frame is whispering SHORT with 55% conviction. Price is parked at 2496, right on the entry ref. ATR (12.41) is thin—volatility is coiled. RSI 15m at 51.7 shows zero momentum, meaning longs aren’t committed. The path of least resistance is down to TP1 (2473) then TP2 (2458), unless we invalidate above 2470.67—wait, that’s the inva
ETH+0.52%
$MARA
It gave me the impression that it may be forming an inverse H+S in this area
post-image
MARA-2.41%
This long position was not opened by forcefully chasing the breakout at the moment it occurred; instead, I waited for the price to pull back to the upper boundary of the previous range and entered only after confirming the strength of the support. As the price approached the upper target zone, I began taking profits in batches as planned, closing out 70% of the position first, while raising the protective stop for the remaining 30% to above the entry price, so that even an intraday wick would not turn a profitable trade into a losing one. The moving averages continue to fan upward, key levels
post-image
BULLA-7.78%
ETH+0.52%
SNDK+1.13%
Everyone’s chasing $MU /USDT longs while the 4h quietly flips—are you early or early exit?

$MU /USDT - SHORT

Trade Plan:
Entry: 1019.67 – 1021.43
SL: 1029.04
TP1: 1014.18
TP2: 1009.93
TP3: 1003.57

Why this setup?
- 1D is *range*, not breakout—so the 1020.55 reference is a midpoint trap, not a launchpad.
- RSI 15m at 55.1 shows weak bounce fuel; momentum stalls right under the entry zone.
- ATR 1h (3.54) is tight—when it expands, it’s usually down from here.
- Why now? Price is sitting at the exact SHORT trigger with SL at 1029.04, giving a 2.3R to TP2 at 1009.93 before the daily ra
MU+0.46%
As discussed today in my live stream i have filled the order and now waiting for the target 🎯 to get hit very soon as expected if the market is going to respect my analysis and the structure so it's confirmed that after the descending channel breakout and hold above it the buyer will push more higher towards our targets as discussed. and recently i have shown you the big move on it which is also a good sign that it will definitely move to the moon.
This is our last chance of buying in this price if the momentum or push just come to it so this token will never give you a chance back again for
post-image
SOPH+3.45%
  • 4
I originally just wanted to freeload a breakfast, but the market ended up making me eat dumplings for half a year🥟. A few days ago at dawn, $SNDK /SNDK was still grinding around that level, but buying pressure was quietly strengthening, so I opened a long position and went in directly without hesitation.

Now the bullish thesis has played out crystal clear. The price went from 1586.74 all the way to 1785.04, netting +887.24%. Feeling good, brothers—the harder it grinds beforehand, the more satisfying the breakout.

Take off 75% first, and place the remaining 20% above 1586.74 to protect the
post-image
SNDK+1.13%
LAB-4.13%
ETH+0.52%
Everyone’s staring at $SOXL /USDT’s 15m RSI at 68—but that’s not the trap you think it is.

$SOXL /USDT - SHORT

Trade Plan:
Entry: 124.11 – 124.53
SL: 126.34
TP1: 122.81
TP2: 121.80
TP3: 120.28

Why this setup?
Why now? The 1D range is the cage, but the 4h bias says SHORT with 55% conviction.
- RSI 15m at 68.13 = overheated micro-pump, ripe for a fade at 124.32.
- ATR 1h (0.84) shows low volatility—tight range, so TP1 at 122.81 is a magnet before real volume hits.
- Entry ref 124.32 sits right under the range ceiling; if we reject here, the slide to 121.80 (TP2) is a clean 2% move.
SOXL+5.73%
Everyone’s watching ENA for a breakout—but the 4h chart is screaming the opposite.

$ENA /USDT - SHORT

Trade Plan:
Entry: 0.17564 – 0.17726
SL: 0.18423
TP1: 0.17062
TP2: 0.16673
TP3: 0.16089

Why this setup?
- 1D trend is *range*, not momentum—meaning the 0.17645 level is a magnet, not a launchpad.
- RSI (15m) at 62 is fading—buyers exhausted before they even reach the 1h resistance.
- ATR (1h) at 0.00324 is tight—when volatility squeezes, shorts win the first pop down to TP1 (0.17062) and TP2 (0.16673).
- Why now? The “waiting” status means the trap is set: 0.17645 is the bait, 0.18
ENA+2.43%
Layout for Bitcoin, Ethereum, and Dogecoin
live-cover
LIVE3,655
  • 1
Ride the Bull Run: Trade to Win Up to 6 ZEC
https://www.gate.com/share/act/f950db50
ZEC+20.54%
  • 10
$DOOD Signal】Bullish breakout + overbought continuation
$DOOD RSI 14 surged to 91.21, while 1H/4H MACD showed dual bullish expansion, and the price advanced along the upper Bollinger Band. Depth imbalance stood at 16.31%, with clear bid support. 1H surged from 0.001673 to 0.001951 at a steep slope, while 4H volume increased simultaneously. The funding rate of 0.0351% remains moderate, and OI is stable. The price continues to be aggressively pushed higher in the overbought zone, with a risk-reward ratio of 1.5; strict stop-loss placement is required.
🎯Direction: Long
⚡Entry/limit order: 0.001
post-image
DOOD+26.00%
BTC-0.15%
ETH+0.49%
SOL+1.75%
I was just about to go to the forum and rant, but then I saw my balance and decided against it—the market is always right.

During the intraday plunge, $ZKC fell from 0.04950 all the way down. Watching the entire screen turn green actually calmed me down. Before that, it had rebounded several times, but every time it approached 0.04950, it was pushed back down. Selling pressure remained heavy, making it clear that no one above was willing to take the other side. So I didn’t chase longs; instead, I waited for the rebound to lose momentum and tried a short. The price has now dropped to 0.04876
post-image
ZKC-2.82%
BNB-2.77%
BTC-0.15%
Load More

Join 40 M users in our growing community

⚡️ Join 40 M users in the crypto craze discussion

💬 Engage with your favorite top creators

👍 See what interests you

View More