Square
Following
Hot
News
Profile
Share your thoughts
placeholder
Article
#美国9月PPI大超预期
🔥 BREAKING: U.S. September PPI Explodes Higher — Biggest Jump in Over 4 Years
Hotter-than-expected CPI on Wednesday was just the warm-up. Thursday’s Producer Price Index data confirmed that inflationary pressures are intensifying across the U.S. economy.
The Numbers That Shocked Markets
Headline PPI: +1.3% month-over-month (vs expected +0.5%) — the largest monthly increase since March 2022
Year-over-year: +6.3% (vs expected +5.3%) — the highest annual rate since December 2022
Core PPI (ex-food & energy): +0.7% MoM and +5.0% YoY — both well above forecasts
This is not just an ene
post-image
C+0.76%
UBS+1.33%
CME+1.39%
GAS+3.37%
  • 1
$SOXL closed at $107.35 on October 15, 2026, dropping $3.19 (or -2.89%) during the regular session.
Last Close / Price: $107.35 (After-hours around $104.45)
• Day Range: $95.24 – $108.80
• 52-Week Range: $28.12 – $302.00
• Trading Volume: ~29.1 million shares
• Leverage Strategy: Seeks 3x (300%) daily performance of its underlying semiconductor index.
SOXL+0.41%
0bcac04370454159b0c850a99b8f6706?txSecret=8761c9f605f9297ae38cf7268ee7e6c5&txTime=6ad2c503
post-image
$ETH ETH: The Sleeping Giant Just Rolled Over... Towards the Moon
ETH has been the quiet kid in class while everyone else was shouting, and history says quiet kids sometimes ace the exam.
Price is holding its ground on support like it pays rent there. Momentum is slowly turning, and the chart is starting to look like it wants to remember who it is.
If BTC opens the door, ETH tends to run through it with a lot of hype behind it. I'm watching for a clean break above the recent range highs as the green light.
I just really like this chart. Manage your risk.
post-image
ETH+2.95%
On the daily chart, Xiao Huangyu remains in a bearish structure of progressively lower highs. After consecutive declines, a candlestick with a lower shadow appeared, indicating a short-term willingness to stabilize and recover, and a technical rebound may emerge. However, the bullish candle's body is relatively weak and failed to break above the point where the previous decline began; essentially, it remains a pullback recovery
On the 4-hour chart, the price staged a slight rebound after stabilizing at a low, with several small bullish candles formed consecutively in the short term. However, t
post-image
BTC+1.12%
ETH+2.95%
#StrivePlans500MillionRaiseToBuyMoreBitcoin
Strive Plans a $500 Million Raise to Buy More Bitcoin — What Does This Mean for the Crypto Market?
The institutional Bitcoin story is getting more interesting. Strive's reported plan to raise up to $500 million to purchase additional Bitcoin has caught my attention because it highlights how some companies continue to explore Bitcoin as part of their corporate treasury strategy.
For me, the important question is not simply how much Bitcoin a company wants to buy. I also want to understand how it plans to raise the money, what risks shareholders coul
How will XAU, crypto, and U.S. stock markets fluctuate???
Time: 11:30 a.m.–12:00 p.m. Beijing time on October 16 (Friday). Format: A fireside chat with IMF Managing Director Georgieva at the IMF (International Monetary Fund) annual meeting in Bangkok, rather than a formal policy statement.
Background: This is the Federal Reserve’s last public appearance before the October 27–28 FOMC meeting’s blackout period, so the market is paying close attention.
Why this speech is important
The U.S. September CPI has just come in well above expectations (3.7% year-on-year), while the market remains divided
XAUUSD-0.08%
🔹Rate Hike Expectations Rise, but U.S. Stocks and Crypto Rally Against the Trend! Jensen Huang Step
live-cover
LIVE2,165
US Initial Jobless Claims
live-cover
LIVE1,794
After rebounding from the lows, the market has entered a sideways consolidation phase, leading many to wonder whether there are no more shorting opportunities. Back-and-forth price action is normal, and no effective breakout has occurred within the current range. There is clear resistance above, with short-term resistance at 83500. Below 84300, key support is at 80000. Overall, the market remains in a broad 84300-80000 consolidation range, with the intraday strategy still focused on shorting into strength.
Place short positions in batches above 83000; for a more conservative approach, enter at
BTC+1.15%
ETH+3.29%
10.16 ETH Market Analysis

Long: around 2400-2425, stop loss at 2380, targets 2450/2470

ETH is currently at 2434.32. After a strong bullish reversal from the bottom pushed the price up to 2466, resistance caused the rally to stall, while concentrated profit-taking at the highs led to a deep pullback. The market's center of gravity has shifted somewhat lower, but the main hourly structure of bottoming and rising remains intact. This pullback is not a trend reversal, but rather provides an opportunity to establish long positions at lower levels.
2400-2425 is the dense support zone formed duri
post-image
ETH+2.95%
$AAVE
Grinding down from 159, with holdings reduced by 5% over the week. Longs are capitulating in a long squeeze, and the funding rate is still negative. 😏 159.9 is capping it; any rebound is an opportunity to escape. Don’t wait until it crashes through 157 to run, or it’ll be too late.
post-image
AAVE+5.27%
$TRX TRX at End of Multi-Year Correction, Could go to $55+
TRX has spent months in an extremely tight range within what I’m counting as wave-e of E. My volatility-compression indicator is showing extreme, persistent readings, with the current stretch approaching its historical duration record.
I’ve labeled the potential 2018–2026 correction as a triangle, although other interpretations remain possible. The more immediate focus is the contracting structure developing from the 2024 high. If this triangle is completing, the count favors an upward thrust.
The bigger question is what that triangle
post-image
TRX+1.37%
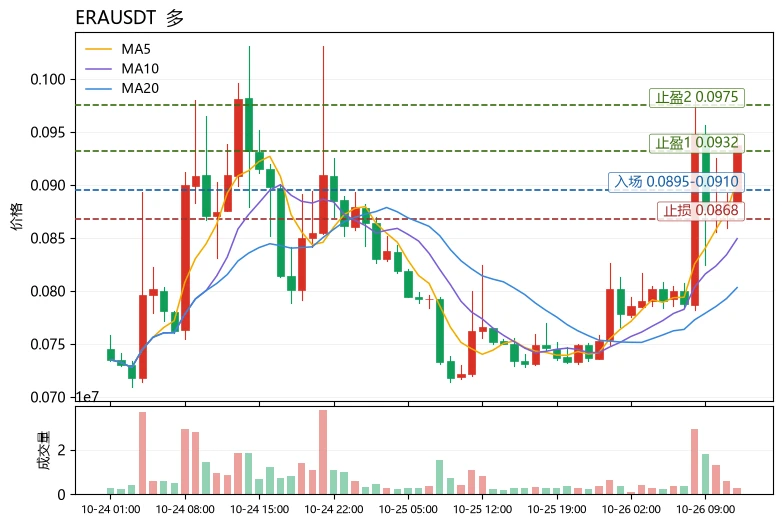
🔥 $OGN
After encountering resistance near the $0.0500 resistance zone, it has continued to show bearish momentum. The price has consistently formed lower highs and lower lows, gradually falling to the $0.0300 support area. If selling pressure persists and the support level breaks, OGN may retrace further to lower levels. 📉Take profit: 0.010556 Stop loss: 0.03747 Short $OGN 👇
post-image
OGN-3.73%
Nice, nice—the BSC one is starting to take off too.
$FTR #特斯拉能飞
post-image
TSLAG+3.06%
TSLAON+3.10%
TSLAX+3.22%
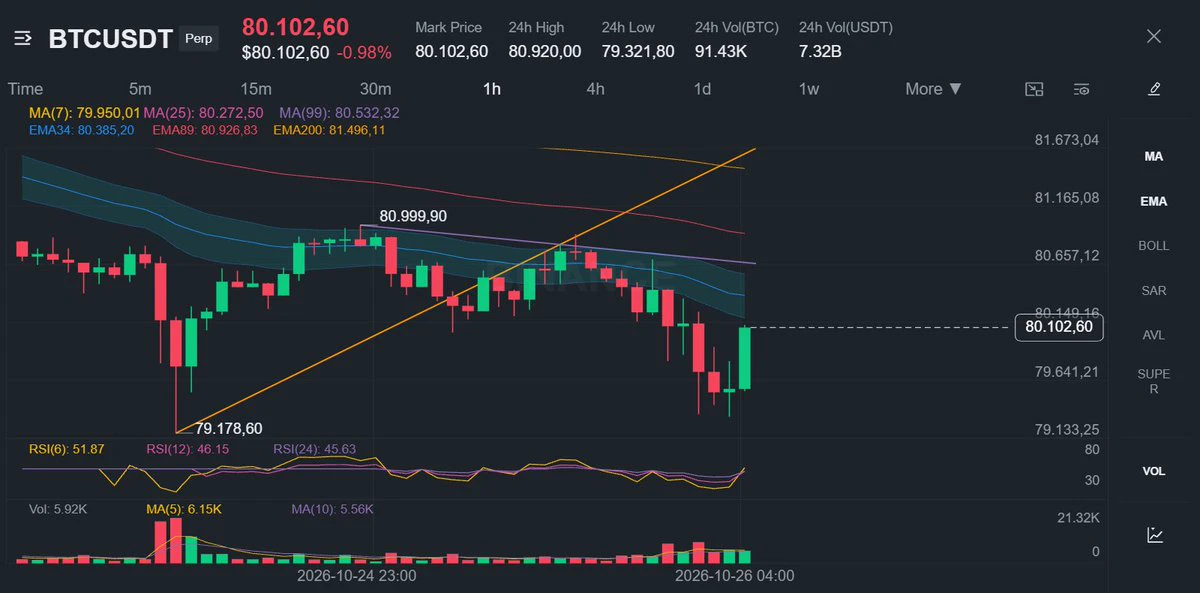
Last night, the broader market was affected by the decline in U.S. stocks and saw another pullback, with BTC briefly falling below the 80000 level before quickly rebounding. The market has now re-entered a consolidation phase, with a clear wait-and-see sentiment.
The key event to watch today is Waller’s speech at 11:30 a.m. In particular, with recent U.S. CPI and PPI data both coming in above expectations, the market remains divided over whether there will be another rate hike this month, so Waller’s speech could become an important factor in short-term market movements.
However, the market ha
BTC+1.12%
ETH+2.95%
SOL+2.75%
#美国9月PPI大超预期 Data beat expectations across the board, yet the market "isn't following the script": PPI came in at 6.3%, with BTC hanging by a thread at $80K—will this be "the end of bad news" or "stagflation panic"?

Actual data: U.S. September PPI rose 6.3% year-over-year (forecast 5.3%) and 1.3% month-over-month (forecast 0.5%)—the highest in more than four years; core PPI rose 5.0% year-over-year, while retail sales rose 0.8%, also beating expectations. All four readings "blew out the charts." But interestingly, the more explosive the data, the more "divided" the market became—U.S. Treasur
post-image
BTC+1.15%
XAU+0.52%
NDAQ+1.57%
DOW+1.59%
#美国9月PPI大超预期 #每周来晒
U.S. September PPI Surprises the Market — My Take on Inflation, the Fed, and Crypto |
Whenever important U.S. economic data comes out, I like to look beyond the headline and understand what it could mean for the market. This time, the September Producer Price Index (PPI) has caught my attention because the numbers came in much higher than expected.
According to the U.S. Bureau of Labor Statistics, producer prices increased 1.3% month over month in September, while the annual increase reached 6.3%. The monthly figure was the largest increase since March 2022. Energy prices
post-image
BTC+1.15%
ETH+3.29%
opencode's DeepSeek 4.1 Flash has only been free for a few days?
Everyone is promoting it.
Actually, WorkBuddy's international version has been free for several months!
I've been using it all along.
Unlimited tokens—hurry up and start using it.
post-image
$FIL I’m done pretending; I’ll alter the data
FIL+9.67%
  • 1
Load More

Join 40 M users in our growing community

⚡️ Join 40 M users in the crypto craze discussion

💬 Engage with your favorite top creators

👍 See what interests you

Trending Topics

USSeptemberPPIBeatsExpectations

91.35k Views1.9k Discussing

US September PPI came in at 6.3% YoY, well above the 5.3% market expectation, pointing to renewed producer-side inflation pressure. Weekly jobless claims were 199K, broadly in line with forecasts. Could hotter inflation further reduce room for rate cuts, and what does it mean for $BTC, US stocks, and gold?

GateWCTCS9GlobalTradingCompetition

37.87k Views6.41k Discussing

WarshIMFSpeech

62.4k Views747 Discussing

View More