
Square
Following
Hot
News
Profile
Share your thoughts
placeholder
Article
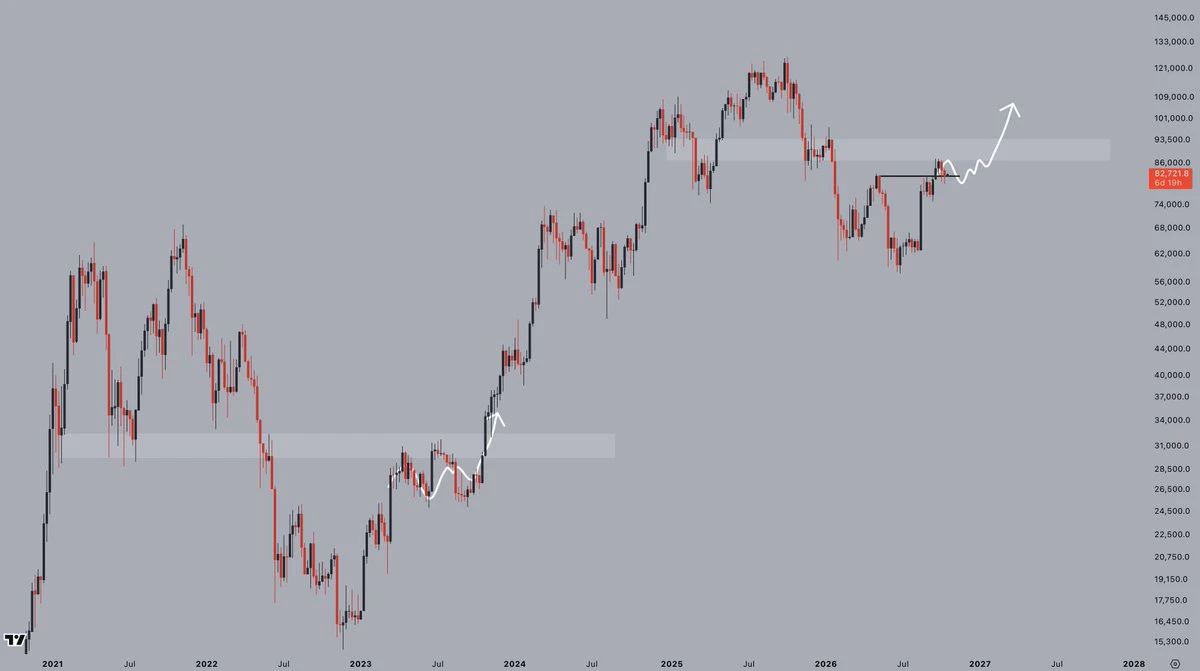
My $BTC outlook remains the same.
Resistance at 87k, support at 81k: a clearly defined chop range.
Great conditions to lose money in, so I'd rather not participate. Waiting for a break on either side to get more actively involved again.
Until then, patience is my game.
post-image
BTC+1.55%
According to RootData, as of August 24, Gate covered 1,022 TradFi assets and 366 stock derivative underlyings, ranking first on the data platform in both categories.
In September, CrossEx trading volume grew 200% month over month, while its asset scale grew 37.3%, with both reaching all-time highs.
The range of assets available to users for trading continues to expand, while trading activity and capital on the institutional side are also growing. CrossEx has also integrated real stocks and ETFs, further enhancing its cross-market trading services.
👉
#Gate #GateTransparencyReport #TradFi
post-image
Trenches
AGT
A
bade
b
AGT
0x5d...e274
Market Cap
$.
Change
.
24h Vol
$.
Holders
.
PIERRE
P
bade
b
PIERRE
D3S6...pump
Market Cap
$.
Change
.
24h Vol
$.
Holders
.
STONK
S
bade
b
STONK
6GmA...UNgx
Market Cap
$.
Change
.
24h Vol
$.
Holders
.
PONS
P
bade
b
PONS
0x39...4571
Market Cap
$.
Change
.
24h Vol
$.
Holders
.
AI
A
bade
b
AI
0x2e...1e18
Market Cap
$.
Change
.
24h Vol
$.
Holders
.
#比特币短线站上8.2万美元 #GateWCTCS9全球交易赛 Bitcoin Back Above $82,000! Ethereum Rebounds Strongly—Is the Bull Market Really Coming Back?
The crypto market has finally caught a brief breath! On October 19, as Asian markets opened a new week of trading, Bitcoin and Ethereum both rebounded. BTC climbed back to around $82,000, while ETH posted even stronger gains. But with Federal Reserve rate expectations shifting back and forth and risk appetite not yet fully recovered, is this rebound a signal of a trend reversal, or merely a brief recovery amid a downturn?
I. Bitcoin rebounds as market sentiment shows si
BTC+1.55%
ETH+1.14%
  • 1
  • 1
The breakeven level he gave is exactly where he plans to short—the same price range: you’re waiting to get back to breakeven, he’s waiting to enter.
He called BTC at 84000. I checked: it was touched 21 times in 30 days. On October 12, it surged to 84352 and closed at 81850—it can reach that level but can’t hold it. Yesterday’s trading volume was over 800 million, more than a quarter below the average of the previous four days.
He called ETH at 2500 to 2560. It’s now at 2430, less than 3% away. That range was touched 25 times in 30 days; for trapped longs, it’s the exit.
The people I’m watching
post-image
BTC+1.52%
ETH+1.10%
#BitcoinTops$82K
Bitcoin is trading around the $82,000 area, but it is not comfortably above it. It fell to about $80,000 on October 15 after hot CPI and PPI data, then rallied sharply on October 17. Treat the level as a zone, not a settled breakout. Here is the post in English, with no hashtags, no stars, no tables or charts, and no banned terms.
Bitcoin Price Analysis for Monday, October 19, 2026: Can BTC Hold Above $82,000?
Bitcoin has been the center of attention this month, and the reason is simple. After weeks of trying to climb back toward the upper $80,000s, BTC has been pushed and pu
BTC+1.55%
After getting my tire repaired so many times, this is the first time someone has helped adjust this lead weight! Feels like all the previous repairs were done blindly!
I had never even noticed this thing on the wheel rim before!
post-image
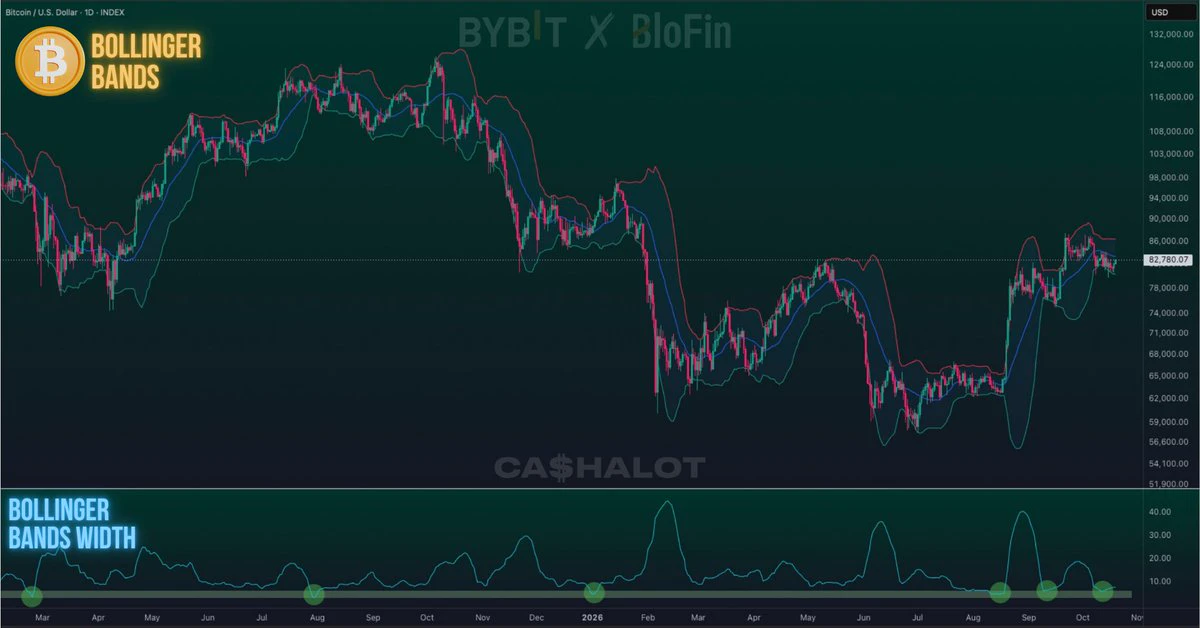
Bitcoin volatility is coiling: bitcoin:native Bollinger Band width has hit one of its tightest levels in the last 2.5 years.
👀️️️️️️ Historically, this kind of extreme squeeze precedes a massive breakout.
post-image
BTC+1.55%
Good way to start the Week 🚀
$BTC LONG Signal:
BTC+1.55%
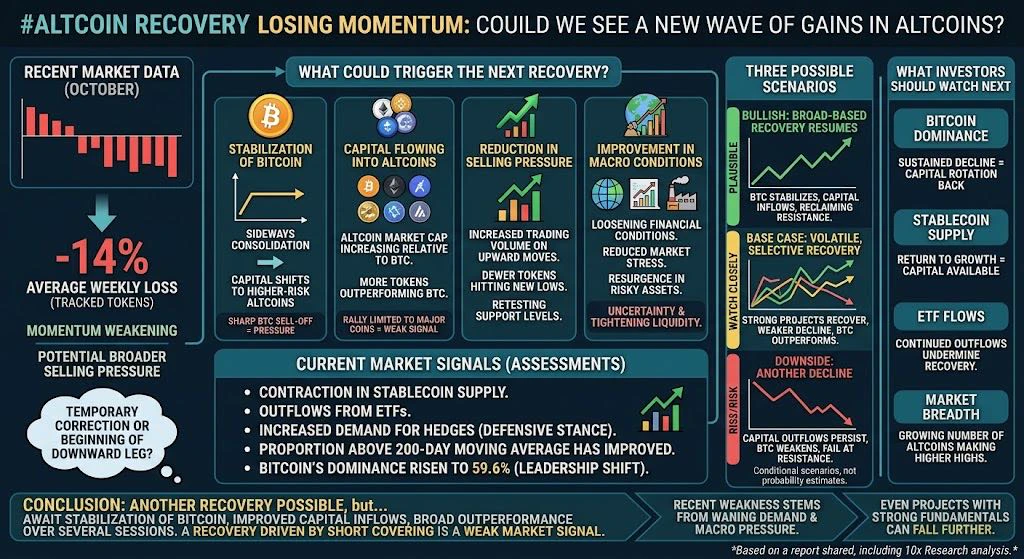
#AltcoinReboundLosesMomentum
Could altcoins see another rally?
Yes, another rally in altcoins is possible; however, a sustainable recovery requires stronger evidence than just a short-lived bounce. As noted in the report you shared, if the tracked tokens have fallen by an average of about 14% over the course of a week, it indicates that momentum has weakened and suggests the potential for broad-based selling pressure.
The key distinction here is whether this represents a temporary correction within an ongoing recovery or the beginning of another downward leg.
What could trigger the next recov
post-image
BTC+1.55%
  • 8
  • 1
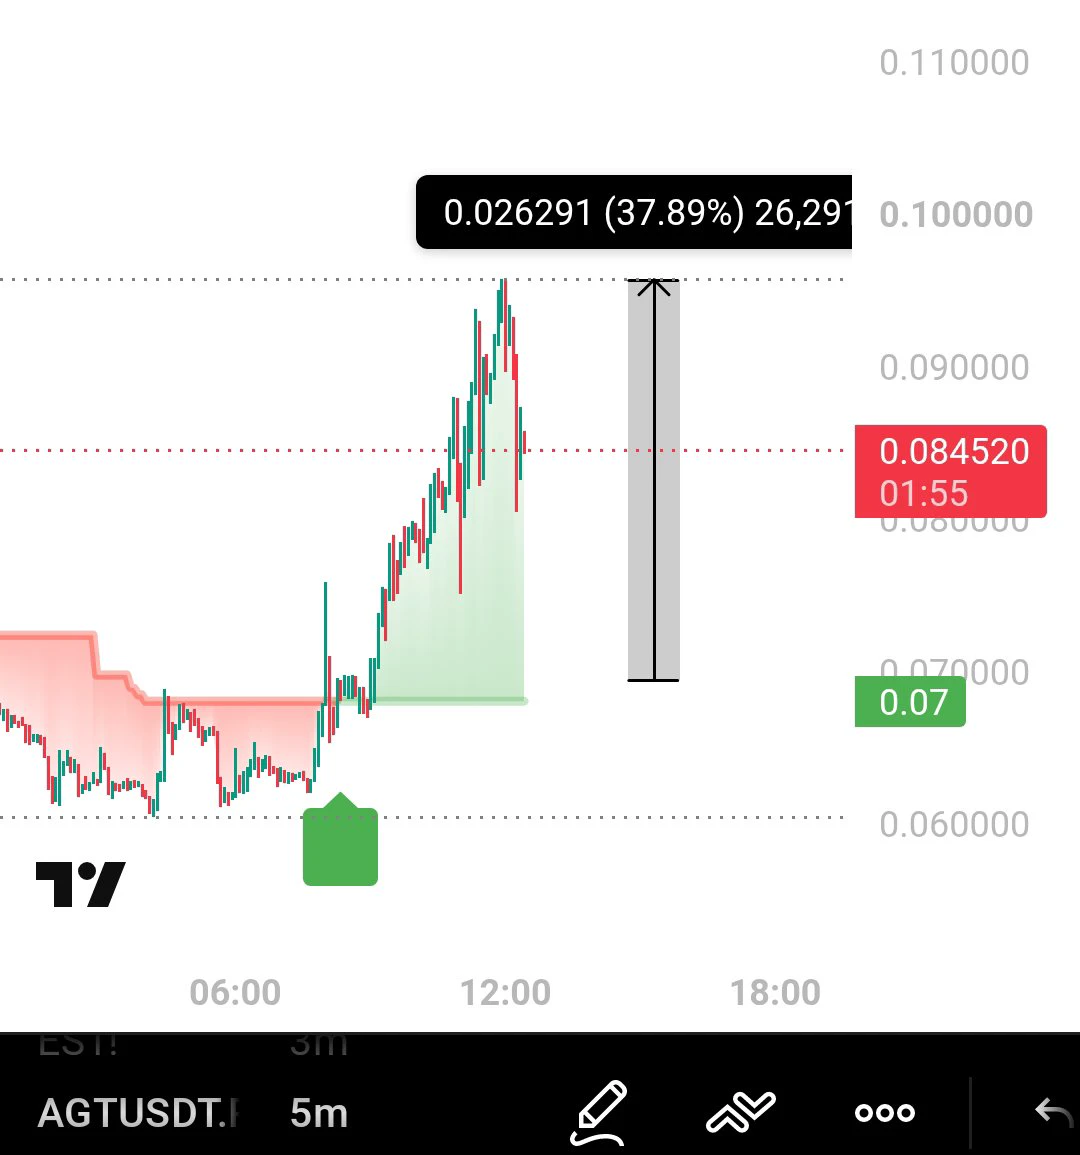
Check the accuracy of the trend Indicator. Absolutely unbelievable!
It detected just ONE bullish trend on $AGT , and $AGT went up 40% after that.
For longs, look for losers. For shorts, look for gainers. You can even combine both.
I've given you something truly powerful. I'm going to make trading so easy that nobody will need to depend on anyone else. You'll trade on your own and become skilled traders yourselves.
Remember the name. I'M UMER. 👑
post-image
AGT+8.89%
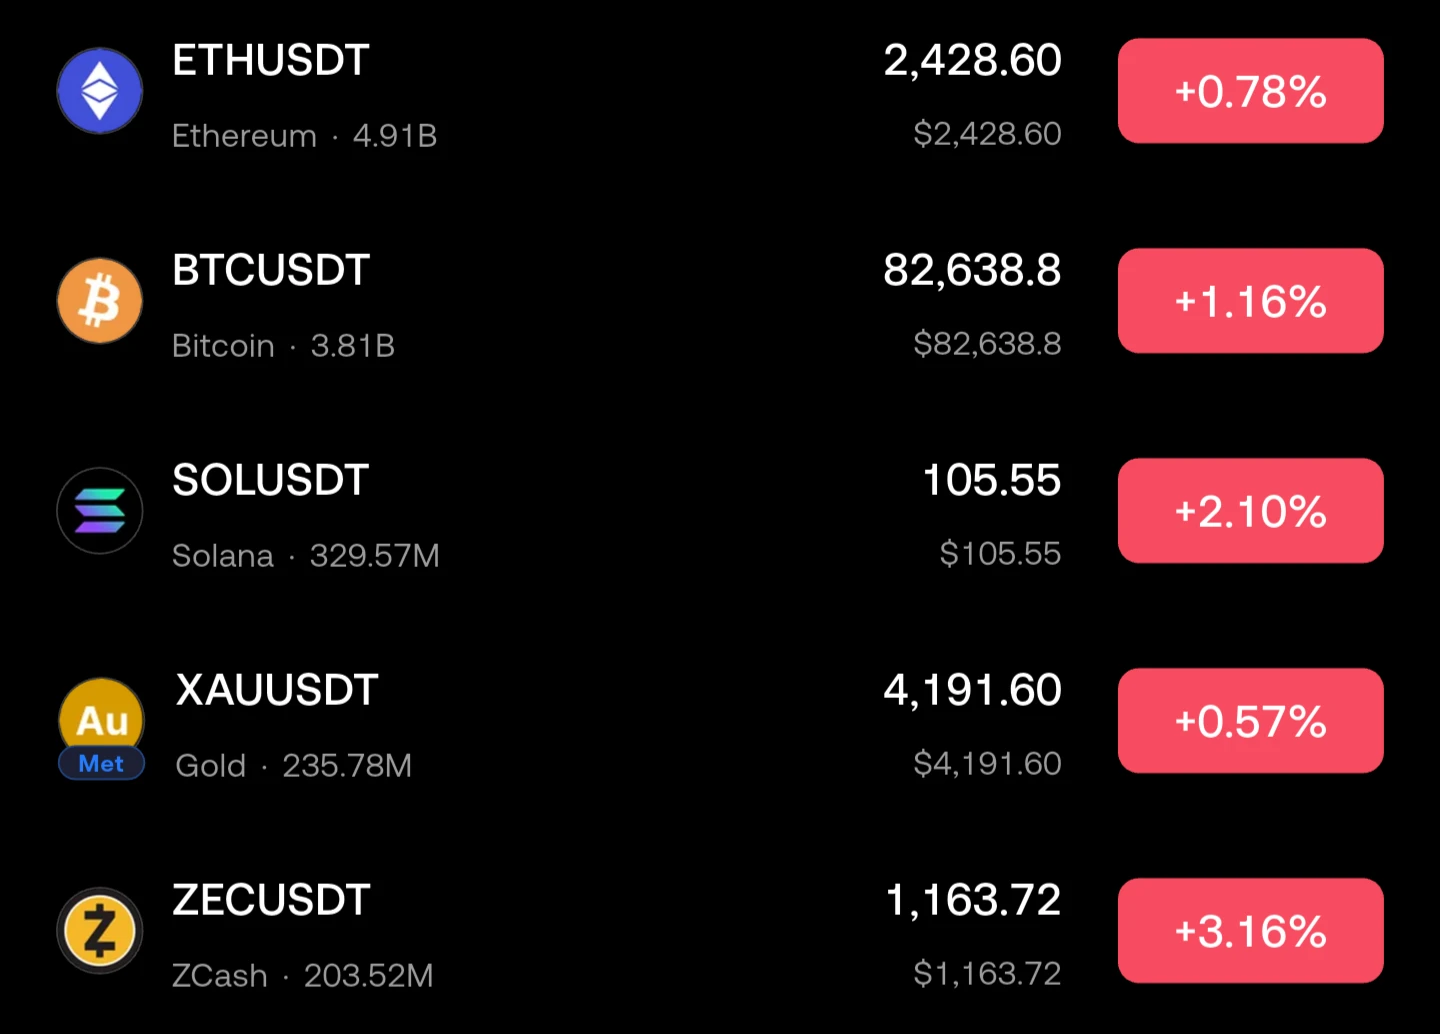
**📊 Market Update, 19 Oct 2026**
Green day across the board 🚀 (red = up on this app)
🔹 **$ZEC ** 1,163.72 | **+3.16%** 🏆 top gainer
🔹 **$SOL ** 105.55 | **+2.10%**
🔹 **$BTC ** 82,638.8 | **+1.16%**
🔹 **$ETH ** 2,428.60 | **+0.78%**
🔹 **$XAU (Gold)** 4,191.60 | **+0.57%**
ZEC and SOL are leading while BTC holds above 82K. Gold is also up, so there's strength in both crypto and metals.
*Not financial advice. DYOR.*
**Details from your screenshot**
| Pair | Price (USDT) | 24h change | Volume |
|---|---|---|---|
| ETHUSDT | 2,428.60 | +0.78% | 4.91B |
| BTCUSDT | 82,638.8 | +1.16% | 3.81B
post-image
ZEC+3.27%
SOL+2.50%
BTC+1.55%
ETH+1.14%
XAU+0.70%
  • 1
CRYPTO MARKET UPDATES
live-cover
LIVE1,891
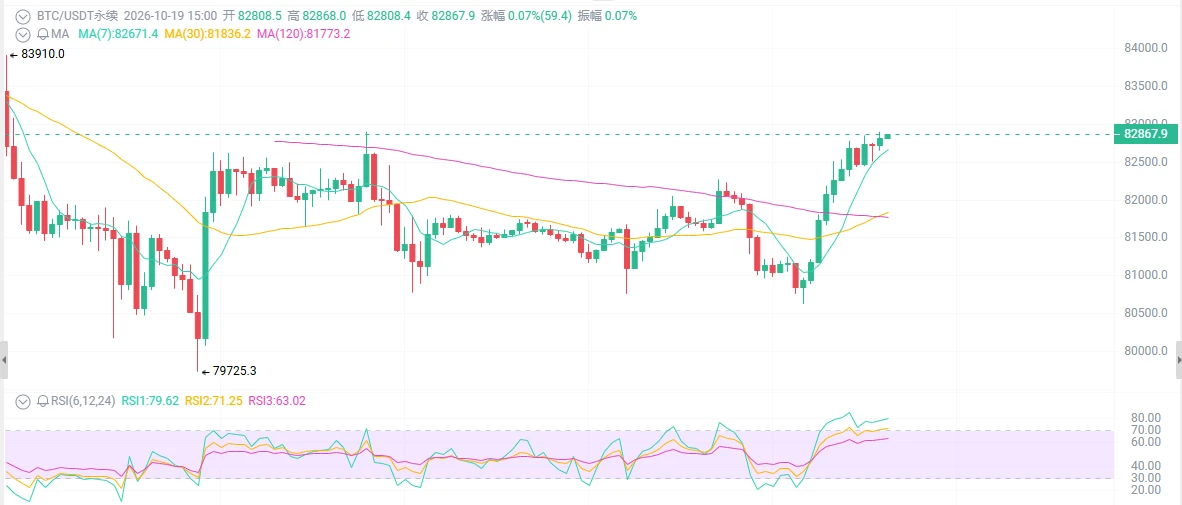
BTC at $82,800—would you still dare to chase?
ETF outflows of 229 million over five days, the Fed just hiked rates, yet BTC climbed back to $82,800—is this a bull trap or an entry point?
ETF net outflows of 617 million in October, 229 million over the past 5 days; institutions have fled, the bear is here.
Oil prices pull back, US stock futures strengthen, ETH and SOL both rebound, the bull is back.
ETF outflows scare off short-term traders, while on-chain accumulation absorbs panic-sold coins. Price hasn't broken 80,000; instead, it has moved above the SMA50 (about 81,400) and SMA200 (about 72
post-image
BTC+1.55%
ETH+1.14%
SOL+2.50%
According to sources, Indonesian officials plan to meet with MSCI executives on Monday (Oct 21) after the index provider threatened to downgrade Indonesia's market classification to "Standalone Market" status. The Jakarta Composite Index dropped 5% on Monday, reaching its lowest level since 2020. In
MSCI-1.02%
Sold too early at an average price of 0.12, but still made 3x profit $Q
post-image
Q-7.17%
Institutional funds are weakening—who will see buying return first, BTC or ETH?
Whenever the market drops, everyone waits for institutions to buy the dip. But institutional money can also sit on the sidelines, and ETFs are not one-way inflow pools.
From October 12 to 16, U.S. spot BTC ETFs saw net outflows of about $228.4 million, while spot ETH ETFs saw net outflows of about $320.1 million. ETH’s fund base is smaller, yet its outflows were larger—a pressure point worth taking seriously.
A closer look at the data, however, shows some change: BTC ETFs saw net outflows of about $679 million the
post-image
BTC-0.96%
ETH-1.64%
🔹 The Fed has entered its blackout period, with U.S. PMI data due Friday
live-cover
LIVE2,208
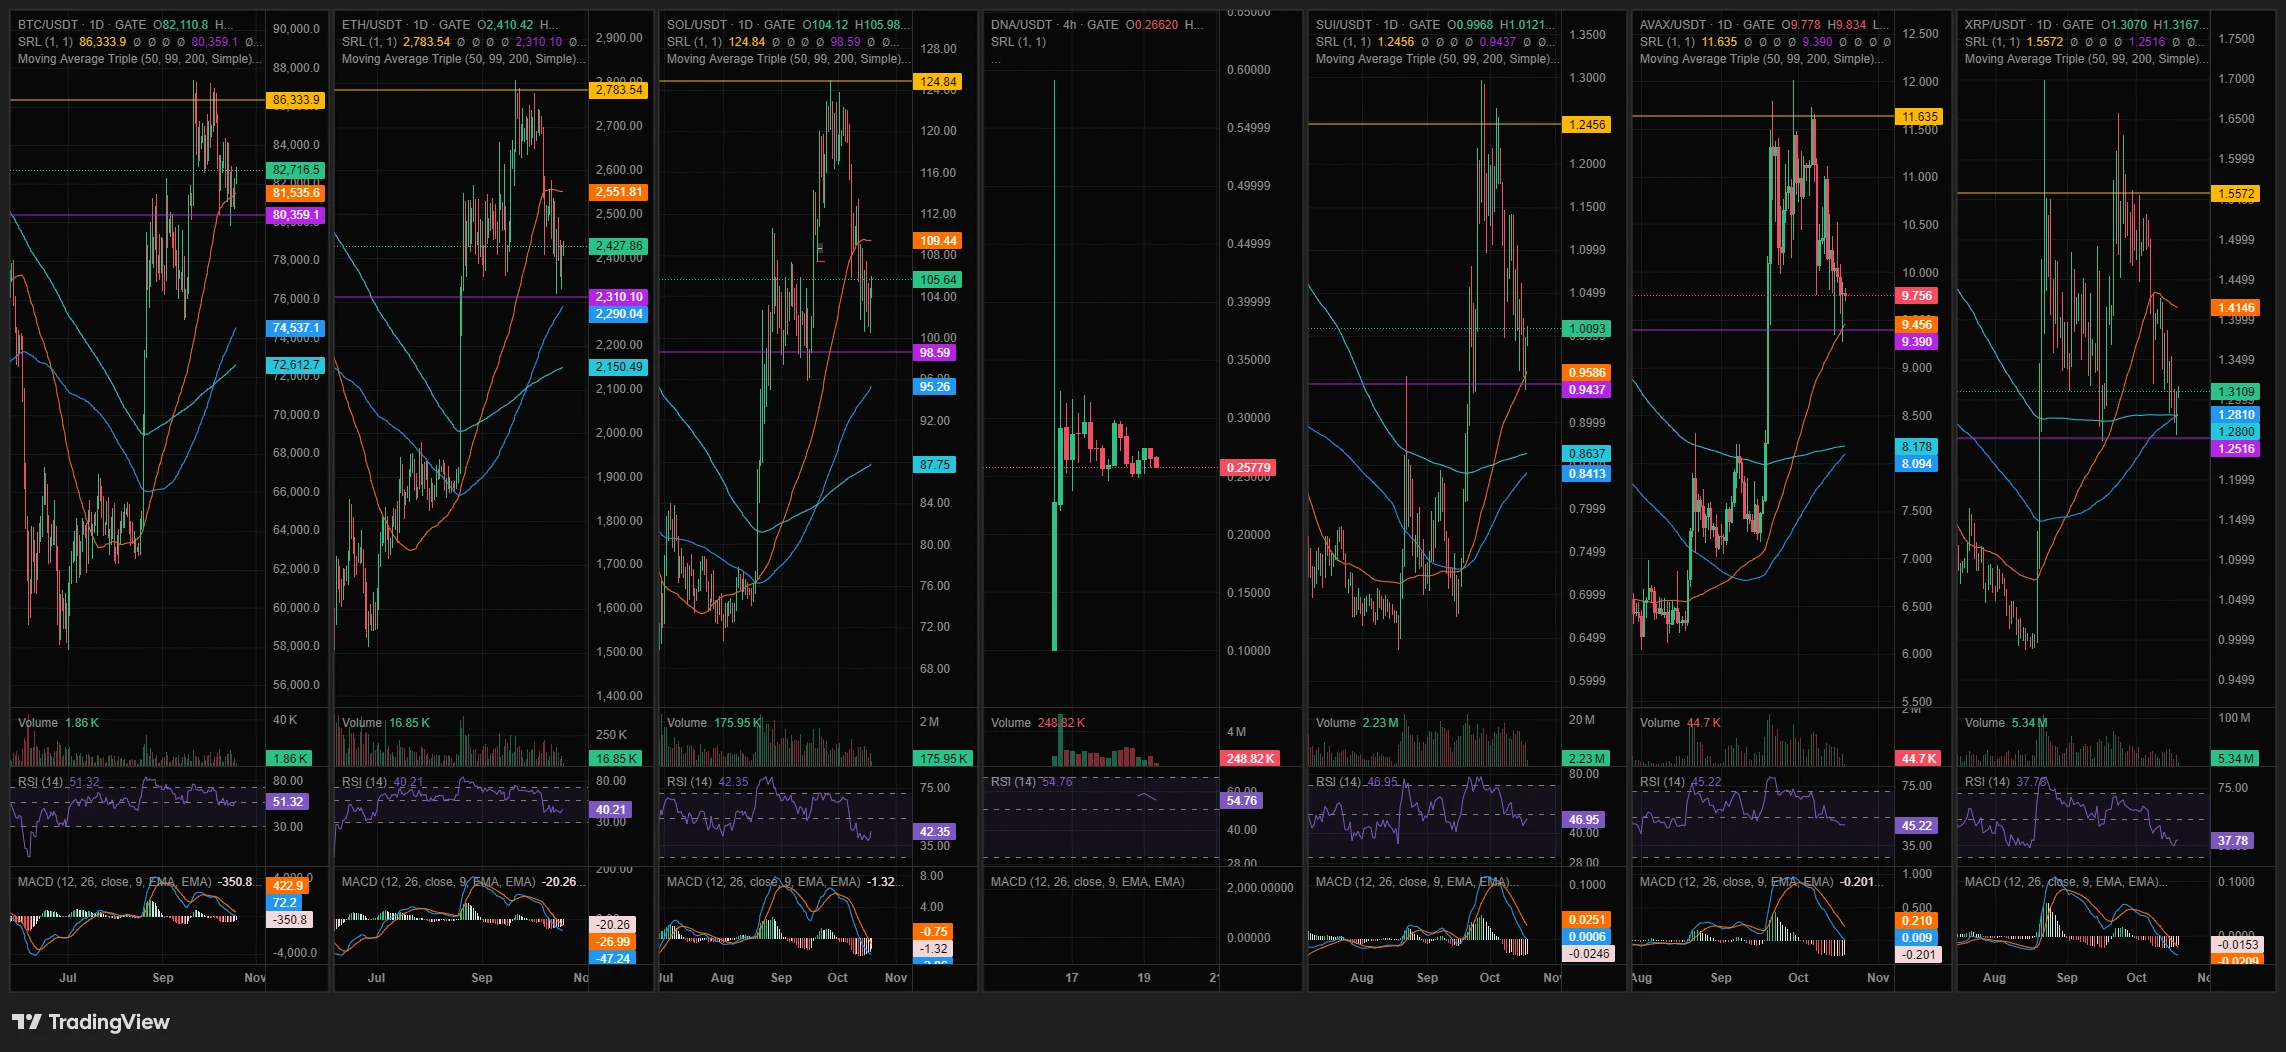
#AltcoinReboundLosesMomentum $SUI $AVAX $SOL #ShareWeekly
10x Research’s weekly numbers are the cleanest summary I’ve seen: 141 tracked altcoins fell an average of 14% last week while BTC fell 3%. Here’s what’s behind it and what my charts add.
1. The ratio and the recovery math
Alts fell about 4.7x as much as BTC (my math). The recovery math is harsher: a 14% drop needs about +16.3% to get back, versus +3.1% for BTC’s 3% drop (my math). That’s why altcoin rebounds feel slow even when they’re sharp.
2. Liquidity is the real story
The report flags falling volume, shrinking stablecoin supply an
post-image
SUI+3.52%
AVAX+0.49%
SOL+2.50%
  • 1
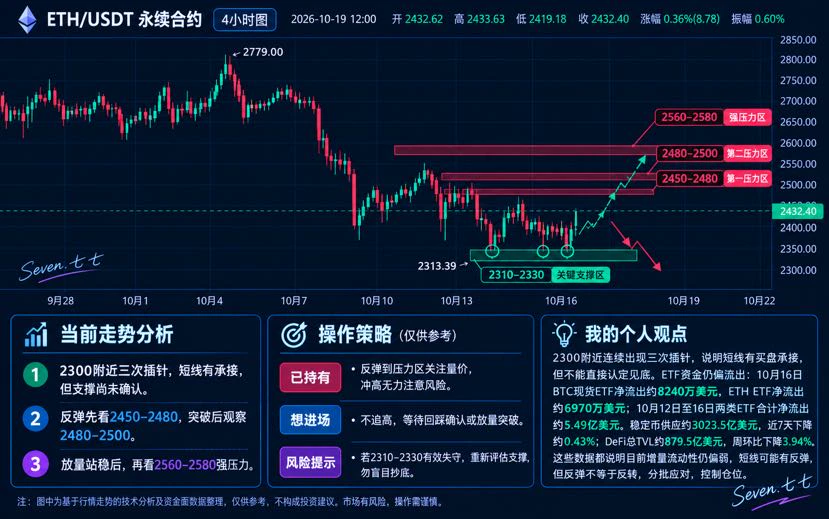
It fell again last night. $ETH What comes next? Here's my own take.
There have been three wicks around 2300, with a low of 2313.39.
Looking at the 4-hour chart, this area is seeing some support for now. If it continues to hold in the short term and the lows start moving higher, I'll watch for a rebound opportunity.
But where should we look for a rebound first?
The first target is 2450–2480, a relatively clear resistance zone recently.
If it breaks above this level on increased volume and holds, the next target is 2560–2580, but stronger price action will be needed.
Of course, this is just a te
post-image
ETH+1.10%
  • 1
#ShareWeekly #BTC
Bitcoin Near $82K: Real Recovery or Temporary Bounce? | Weekly Market Outlook
A new trading week begins with an important question: Is the crypto market recovering sustainably, or is this just a temporary bounce before another correction?
Bitcoin is trading near $82,400, while Ethereum is around $2,420. Meanwhile, Asian technology stocks remain under pressure following recent weakness in US technology shares and growing concerns about AI investment valuations.
My view is cautiously optimistic, but the market needs confirmation before we can call this a new bullish trend.
1.
BTC+1.55%
ETH+1.14%
JPN225+1.95%
SK Hynix+0.39%
Load More

Join 40 M users in our growing community

⚡️ Join 40 M users in the crypto craze discussion

💬 Engage with your favorite top creators

👍 See what interests you

Trending Topics

GateSeptemberTransparencyReport

289.49k Views2.64k Discussing

Gate’s global user base reached a new high as trading innovation and integrated financial services continued to advance. Global users have grown to 62 million, with support for 5,300+ digital assets and 12,800+ stocks and ETFs. Gate ranks among the global top two in spot trading and top three in derivatives. Gate Meme Go trading volume increased 77.55% MoM, while the number of Meme Go trading users rose 67% MoM. [👉 Full Report](https://www.gate.com/announcements/article/102291)

StakeLaunchPoolToShare2.8M$DNA

36.84k Views680 Discussing

BitcoinTops$82K

41.27k Views39.81k Discussing

View More