Share your thoughts
placeholder
Article
September 21 BTC Analysis
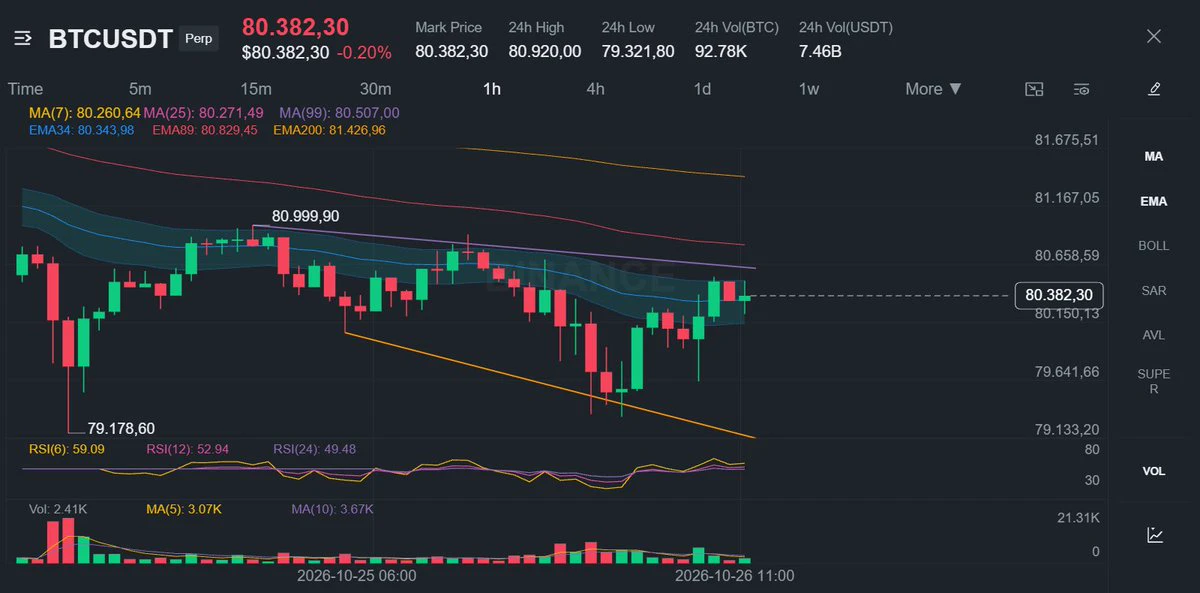
On the one-hour BTC chart, a low-level momentum rebound has formed, with the price touching the upper Bollinger Band. This is a secondary bearish retracement within the primary downtrend. The AO momentum indicator has risen rapidly, but initial signs of price-volume divergence have emerged, and the impulsive rally lacks sustained support from incremental capital inflows. The overhead trapped-holder zone around the volume peak and the upper Bollinger Band are creating converging resistance, making this a short-term sentiment-driven bull-trap recovery. Unrealized-profit
post-image
BTC+0.36%
ETH+1.55%
  • 1
Crude oil finally dropped. I couldn't hold on—it was taking too long. #USO
post-image
USO-0.95%
  • 1
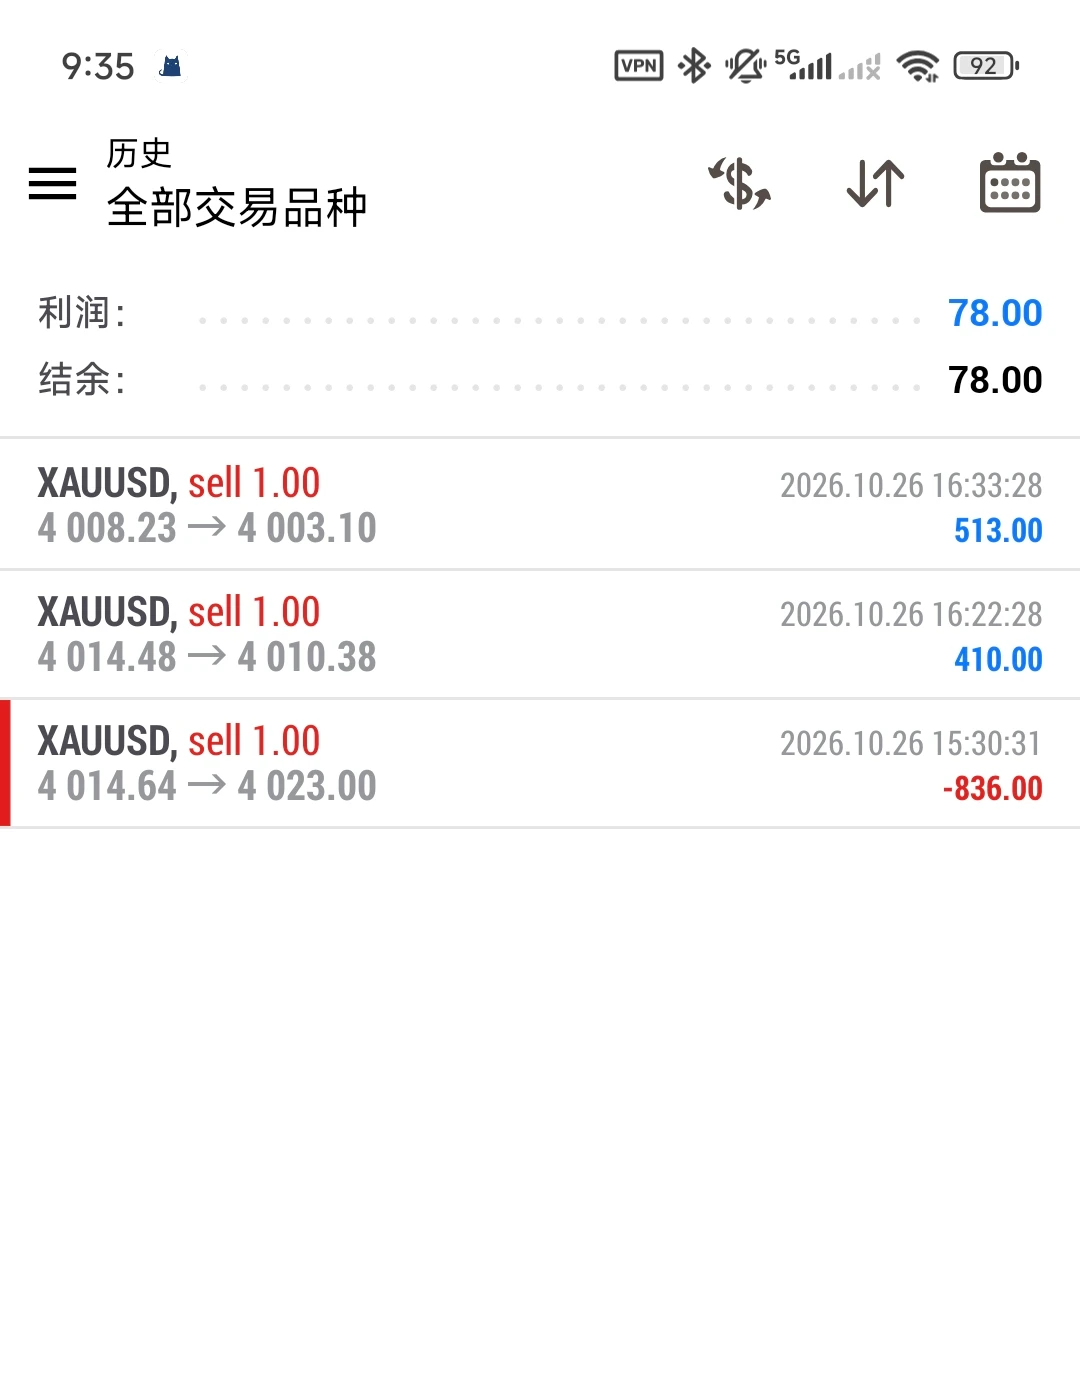
First win of the day! Shorted at 4378, exited at 4370, capturing an $8 move for a $1015 profit!
$BTC $XAU #黄金 #ETH突破2700美元
post-image
BTC+0.34%
XAU-0.17%
Why is everyone quietly setting alerts at 95.703 right now?

$HYPE /USDT - LONG

Trade Plan:
Entry: 92.475 – 92.971
SL: 90.339
TP1: 94.511
TP2: 95.703
TP3: 97.491

Why this setup?
Why now? The daily trend is bullish, which means the macro tide is pushing HYPE higher. The 1h ATR is 0.993398, so the recent hourly swings are wide enough to make a precise entry feel like a bargain. The 15m RSI sits at 39.95, showing the short-term pullback has not yet tipped into panic territory. The entry zone is anchored at 92.723, with a tight range between 92.475 and 92.971, giving a clean risk-defined spot
post-image
HYPE+1.29%
Ethereum’s hourly chart has completed a bottoming V-shaped reversal. The price has surged strongly from the 2562 low and is now challenging the 2700 level, with the short-term bullish trend now established. In terms of indicators, the Bollinger middle band at 2606 has shifted from previous resistance to the core strong support for this rebound, serving as the watershed for determining whether the bullish structure will continue. The MACD has formed a golden cross, the bullish volume bars continue to expand, bullish momentum is being steadily released, and trading volume has increased significa
post-image
ETH+1.50%
WARNING: $BTC BULL TRAP?
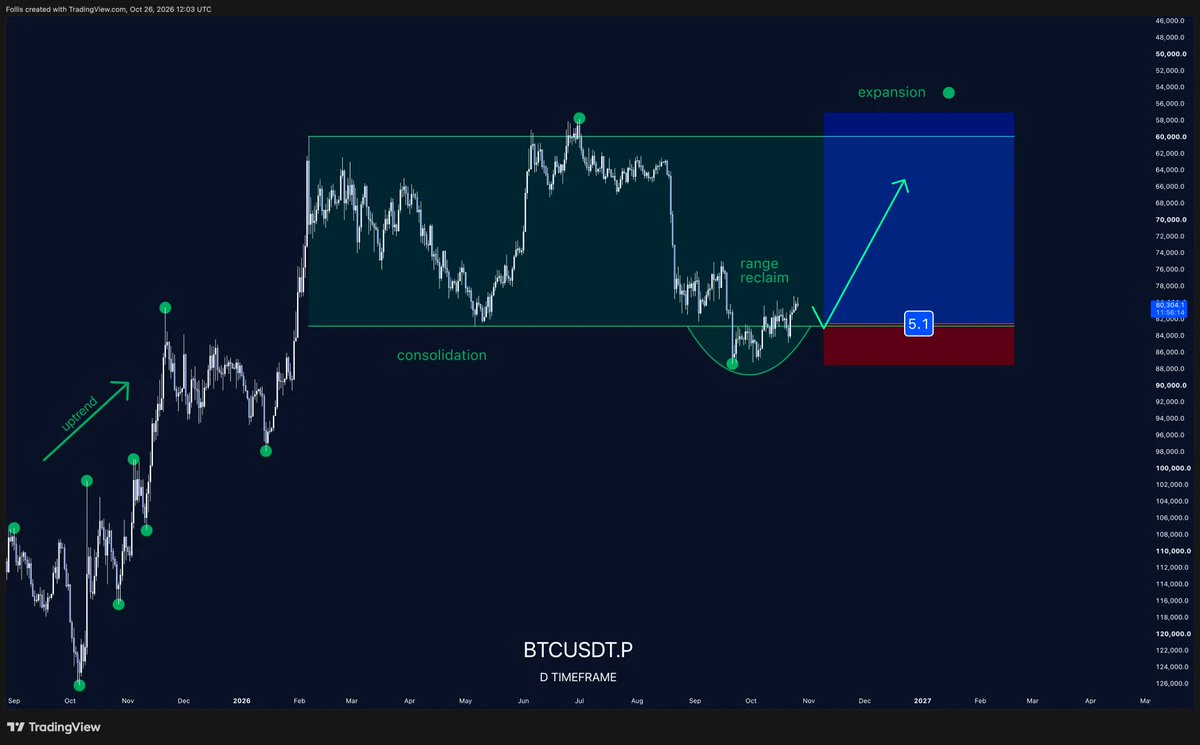
Bitcoin has formed a topping structure that previously led to roughly 30% drawdowns.
If the pattern repeats, $BTCUSDT could follow this path:
$77K
$82K →
$70K →
$60K →
$54K
$$BTCUSDC is struggling around the 50W MA after a strong relief rally, while sentiment has already turned bullish.
But we still haven't seen real capitulation, extreme fear or a confirmed macro bottom.
If this bounce fails, BTC could return toward $70K and then test the liquidity around previous lows.
Below $60K, selling pressure could accelerate, with ~$54K as the macro bottom zone I'm watching.
#
post-image
BTC+0.36%
$ENA /USDT is about to expose a hidden bullish trap most traders will ignore.

$ENA /USDT - LONG

Trade Plan:
Entry: 0.21937 – 0.22317
SL: 0.20300
TP1: 0.23497
TP2: 0.24410
TP3: 0.25780

Why this setup?
Why now? The daily trend is firmly bullish, giving us macro conviction. The 1h ATR of 0.007611 tells us volatility is expanding enough to fuel a clean move. The 15m RSI at 56.59 shows we are not yet overbought, leaving room for upside. We entered at 0.22127 with targets at 0.23497 and 0.24410, while the invalidation level sits at 0.16478, acting as our hard line in the sand.

Debate:
Are we
ENA-0.83%
9/21 Gold:
After retreating from the high near 4696, gold prices are currently fluctuating near and below the middle Bollinger Band, with the middle band around 4407 becoming an important resistance level above. The Bollinger Bands are narrowing overall, the major move is temporarily on hold, and the market has entered a range-bound consolidation phase.
DIFF remains below DEA, the death cross persists, and the green bars remain, indicating that the daily correction trend has not yet ended. However, the green bars have not expanded significantly, so short-term downside momentum is limited, with
post-image
GLDX+0.42%
PAXG-0.07%
After $AVAX came under Wall Street’s watch, it is currently undergoing a weekly-level rebound and has already doubled from its bottom. Based on previous ecosystem rotation rallies, $JOE should also move closely with an AXAV pump, and even more strongly. This is similar to how RAY follows when SOL pumps. The market probably still lacks sufficient capital, and JOE’s trading volume has only just started to pick up. Stay patient and wait a little longer.
post-image
AVAX+15.46%
JOE+9.69%
SOL+1.21%
RAY-2.51%
Nobody is warning you about $ADA /USDT right now.

$ADA /USDT - SHORT

Trade Plan:
Entry: 0.2275 – 0.2293
SL: 0.2370
TP1: 0.2219
TP2: 0.2176
TP3: 0.2112

Why this setup?
Why now? The 1h price is sitting at 0.2284 inside a tight range, and the 15m RSI reading of 44.81 shows momentum is already leaning bearish without a clear reversal signal. The 1h ATR of 0.003591 proves volatility is compressed, which often precedes a sharp directional move once a breakout finally occurs. With the daily trend labeled as range, short sellers are hunting for a failure at the 0.2293 resistance to push price to
post-image
ADA+0.75%
First trade of the early session
Look for a pullback first
Short at 4374, took profit and exited at 4360, 14 points, pocketed $1,497#黄金 #伦敦金 $XAUUSD
post-image
XAUUSD-0.26%
This one-way move came out of nowhere—how many people missed it?
And how many shorts were liquidated?
The weekend Silk Road call played out precisely.
The only regret is that Zhiying’s levels were still too conservative.
As long as the levels are set well, profits are guaranteed.
#MSTR领涨纳指100 $BTC
#Gate24小时净流入Top1 $ETH
BTC+0.34%
ETH+1.50%
Financial News, Crypto Market Updates, Real-World Strategies
live-cover
LIVE1,588
As usual, the first morning trade successfully locked in over 20 points
“4360-4383” 23 points, that simple
Hold what should be taken, secure what should be collected; stability comes first for sustainable gains
$XAU
XAU-0.17%
In early trading, gold pulled back to $4,358 before showing signs of an upward reversal. Next, watch the 15-minute or hourly chart to confirm whether the reversal level is stable. If stable, go long around 4,360, with a stop-loss below 4,340 and take-profit at 4,380–4,390#黄金 #伦敦金 $XAUUSD
post-image
XAUUSD-0.26%
Layout for Bitcoin, Ethereum, and Dogecoin
live-cover
LIVE1,871
ETH hits the 2,700 area as Bitmine’s unrealized losses narrow to about $2.71B; they still hold ~5.96M ETH at a cost basis around $3,340, with 85% staked. This highlights ongoing treasury recovery amid rising prices. $ETH
post-image
ETH+1.55%
BMNR+8.66%
9.21 Morning Market Analysis Pullbacks are free money—go straight in! $BTC $ETH
After Bitcoin completed a deep squat at 74900, the bulls launched a fierce counterattack, and it is now firmly above the 80k mark! The dual-timeframe resonance is sending a clear signal: go all-in on the long thesis:
Daily chart sets the direction: The long lower shadow confirms strong buying at the bottom, while the flattening moving averages and expanding volume have fully opened up the larger-timeframe rebound pattern, with a clear sideways-to-bullish trend!
Hourly chart finds the rhythm: After the sharp rise
post-image
BTC+0.34%
ETH+1.50%
Load More

Join 40 M users in our growing community

⚡️ Join 40 M users in the crypto craze discussion

💬 Engage with your favorite top creators

👍 See what interests you

Trending Topics

MSTRTopsNasdaq100

74.48k Views1.38k Discussing

Strategy (MSTR) has gained about 48% over the past month, making it the best-performing stock in the Nasdaq 100, while Bitcoin rose roughly 12% over the same period. The company holds 845,050 BTC with a cumulative cost basis of about $63.73B. MSTR is not a pure Bitcoin proxy — its price swings can be more extreme. Can this rally last?

Gate Tops 24H Net Inflows Among Exchanges

26.68k Views3.7k Discussing

BTCBreaks82K

57.61k Views10.16k Discussing

View More