Share your thoughts
placeholder
Article
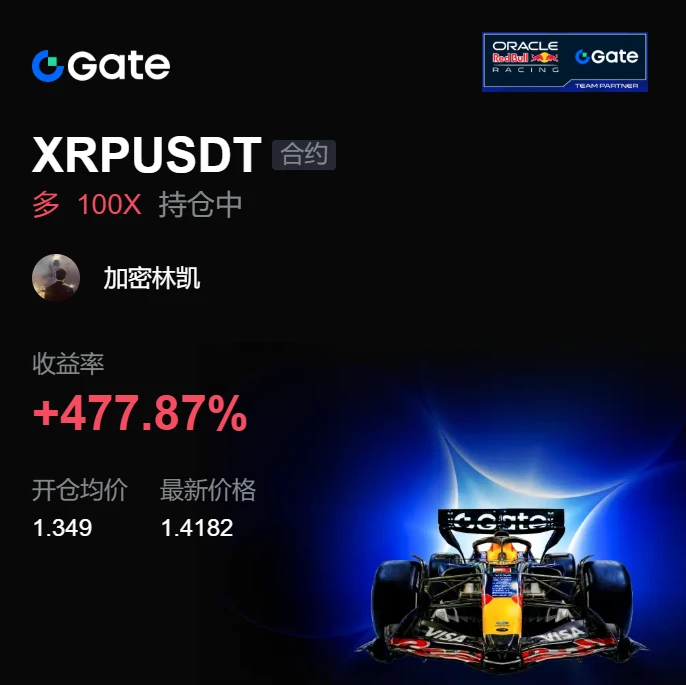
I originally wanted to sell at a loss to appease the heavens, but the ritual failed—the meat roasted itself. The wording may be crude, but this $XRP trade was genuinely satisfying.

During the intraday bottoming process, XRP kept bouncing around 1.3490 without breaking the key level at all. I judged this to be shaking people out, not a real collapse. The funds hadn't fled and volume was still there, so holding was enough—just wait for it to put on its own show.

Sure enough, it pushed all the way up from 1.3490, and now we're seeing 1.4189. The +482.7% gain in the account is already enough t
post-image
XRP+1.19%
ETH+1.97%
LAB-2.48%
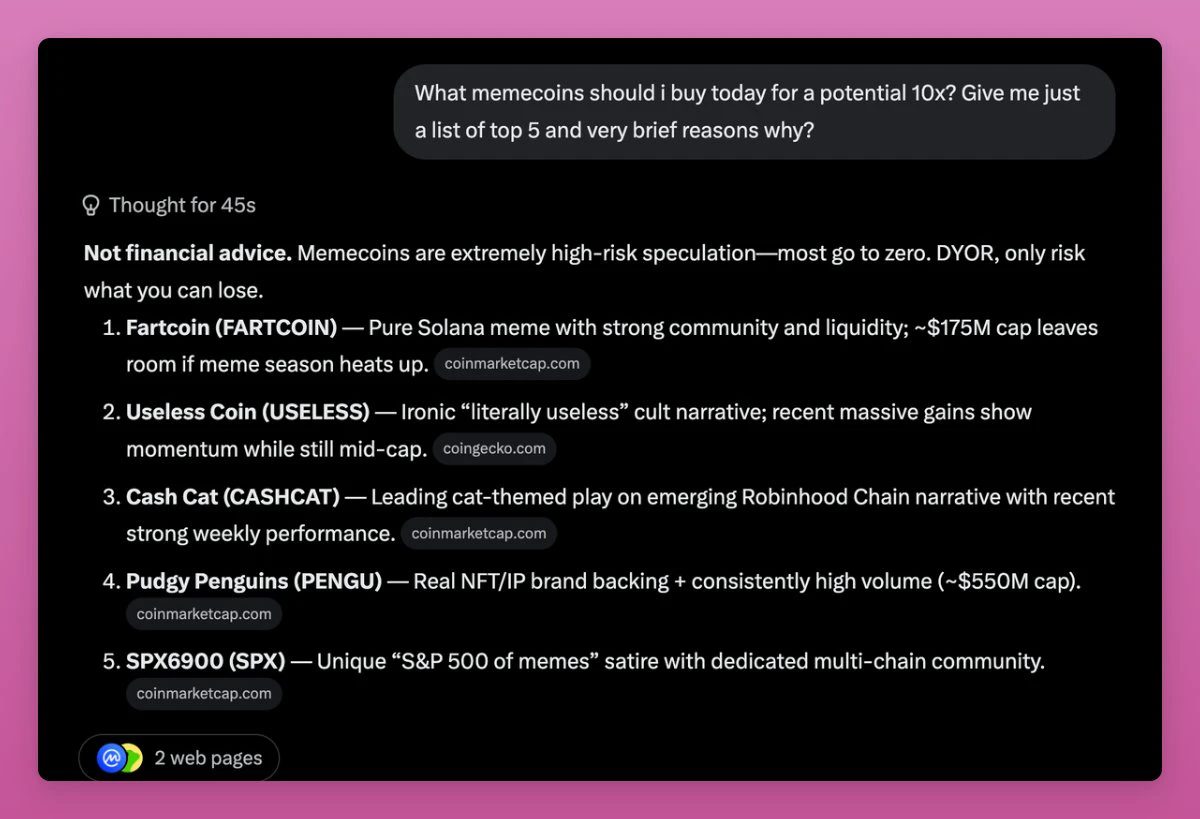
Hunting memecoins in the Age of AI seems... largely unchanged?
If you ask Grok to recommend memecoins to buy it will simply give tickers based on some past criteria (views, volumes, posts on X etc.)
I still believe that (organic) memecoin trading requires this human intuition on what can go viral.
Call it vibes or energy around it. The story that captivates degens. Or KOLs that suddenly to decide to shill it.
Being 24/7 online gives bigger advantage than casually asking AI what to buy once per day.
Or am I wrong and there are degens who print millions with AI but don't post on X not to dilute
post-image
GROK+1.22%
MEME-0.93%
Everyone’s watching BTC, but the quietest 95% confidence LONG on my radar is ONDO right now.

ONDO/USDT - LONG

Trade Plan:
Entry: 0.3781 – 0.3801
SL: 0.3694
TP1: 0.3864
TP2: 0.3912
TP3: 0.3985

Why this setup?
- 4H trend is bullish with 1D confirming—this isn’t a scalp, it’s a momentum stack.
- RSI (15m) at 64.12 shows room to run before overbought, not exhaustion.
- Entry zone 0.3781–0.3801 is tight, with TP1 at 0.3864 (2.2% away) and TP2 at 0.3912. ATR of 0.004 suggests low noise—clean breakout fuel.
- Why now? The 95 confidence score is rare; this is the market giving you a map, n
BTC+0.39%
ONDO+3.03%
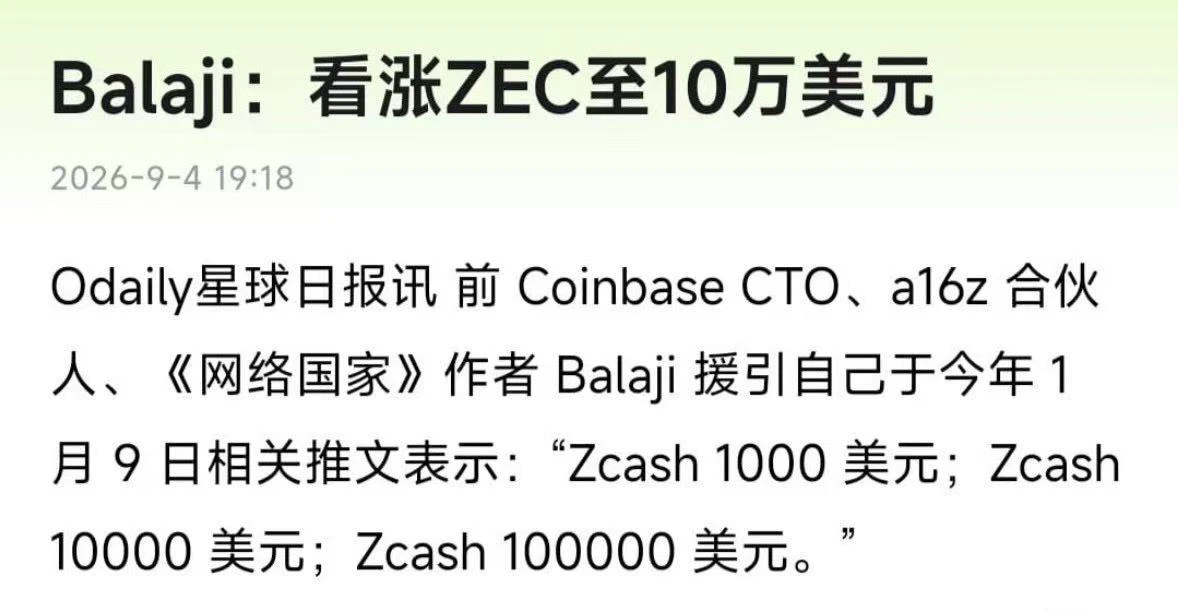
#ZEC What do you think after ZEC broke through $1,200?

First, the most compelling point in the bullish narrative: ZEC's all-time high was actually $5,941 in 2016—at the current $1,193, it is still about 80% below its ATH. Against the backdrop of continued ETF inflows, the market can fully tell the story that "a ten-year high is only the beginning, with a return to the ATH ahead." ZEC's ETF assets under management have surpassed $400 million, SMA-200 around $440 is providing strong trend support, and the daily structure remains healthy.

But in terms of pace, the risk is accumulating rather
ZEC+17.30%
  • 1
morning bath
coffee
a little reading
These are the kind of Sundays I like 🧘🏼‍♂️🍃
Guys, rest assured
I haven't done anything productive or made any money
I haven't gone to work either
I'm out here having fun while in debt hahaha
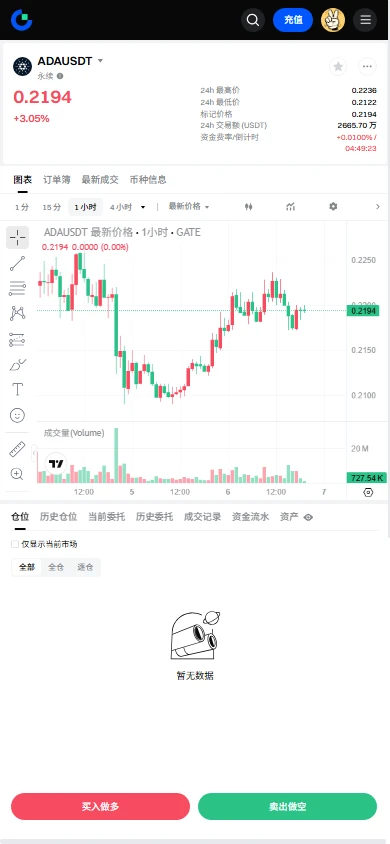
$ADA Signal】Long + 1H buying support/critical turning point
$ADA 1H buying pressure share surged to 0.61, with order book imbalance of 4.91% favoring buyers, while the price moved sideways along the EMA20. 4H MACD bullish momentum is weakening, but the histogram has not turned green. The 1H Bollinger Bands narrowed to 0.2173-0.2223, indicating the turning-point window is approaching. The funding rate is 0.01%, OI is stable, and long-short fees are balanced. The current risk-reward ratio is 1.5, with a stop-loss distance of approximately 1%, keeping the cost of testing the trade controllable.
post-image
ADA+3.53%
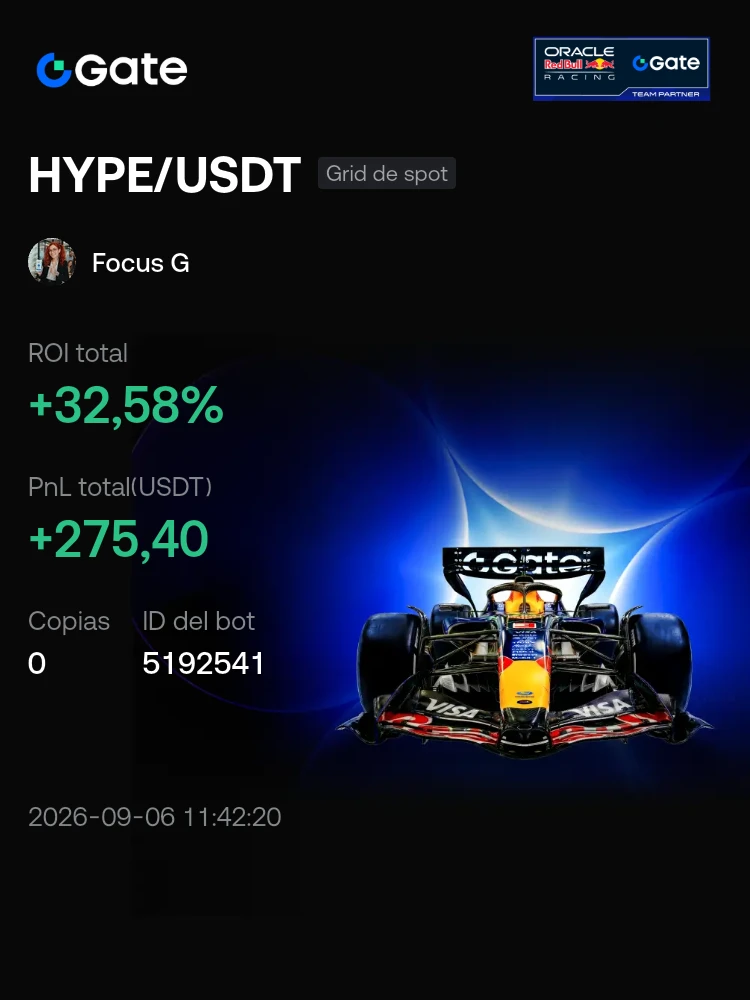
#Bots I am trading HYPE/USDT with Gate's spot Grid bot. Join me!
post-image
HYPE+3.77%
When foreigners brag, I feel like every one of them is crazier than me.
post-image
Everyone’s staring at DASH’s range—but the 4h chart just whispered a secret that most will ignore until it’s too late.

$DASH /USDT - SHORT

Trade Plan:
Entry: 68.55 – 70.27
SL: 77.71
TP1: 63.19
TP2: 59.04
TP3: 52.81

Why this setup?
- Price is hugging 69.41 while RSI (15m) sits at 48.05—no momentum, just a coiled spring.
- ATR (1h) at 3.45 means volatility is about to snap; the range’s middle is the perfect trap zone.
- Why now? The 1D trend says “range,” but the 4h SHORT signal (55.4) is armed—TP1 at 63.19 is a 9% drop before you blink.
- If we lose 68.55, the path to 59.04 (TP2) op
DASH+1.73%
MARKET ALERT - HYPE
Based on the HYPEUSDT chart, the trend is in a strong bullish condition. The EMA 20, 50, and 200 indicators are diverging upward on both timeframes, confirming dominant buying momentum.
​Analysis & Trading Opportunities
​5-Minute Timeframe (TF 5m): The price around 87.853 is very close to the local high of 87.965. Buying directly (buy/long) in this area carries the risk of a pullback due to short-term overbought conditions.
​Strategy: Wait for a healthy correction to the EMA 20 support area (around 87.239) before opening a Long position.
​Target & Stop Loss: Take-profit (TP
HYPE+3.83%
  • 4
  • 2
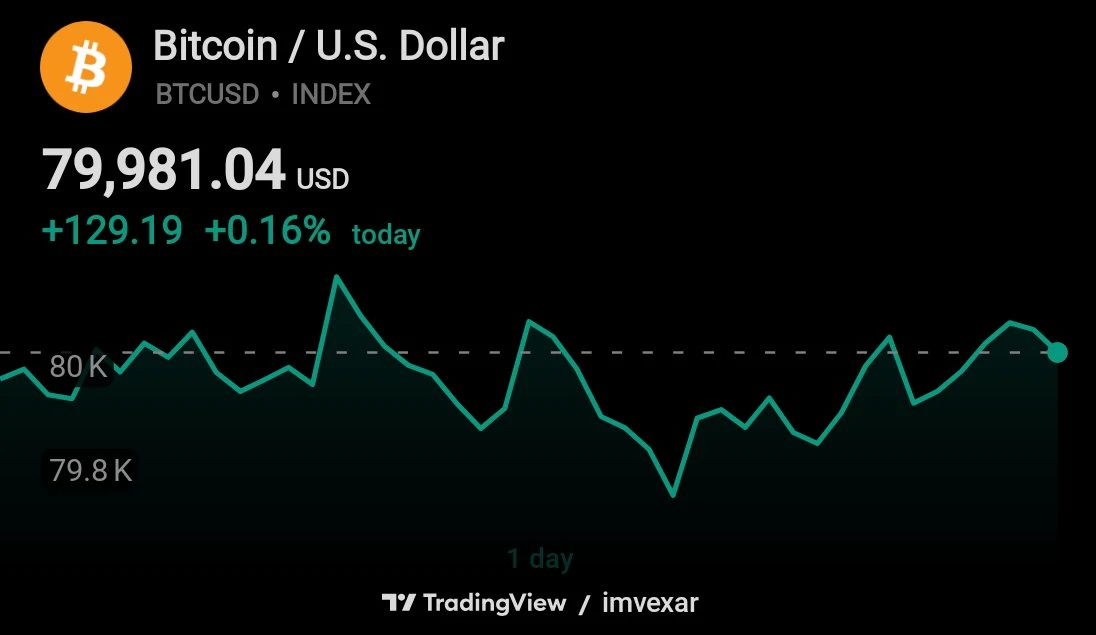
BITCOIN IS BACK AROUND $80,000
post-image
BTC+0.39%
A wallet suspected to be affiliated with a16z has added to its HYPE position again, with total holdi
live-cover
LIVE1,848
This COTI surge has completely caught me off guard—up 25% in 24 hours, ripping from 0.0147 to 0.0190, with $45 million in trading volume. That’s not volume retail traders can generate.
Here’s a reference for bottom-fishing: the Fear and Greed Index is currently at 67, leaning greedy but not yet extreme. Funding rates flipped positive from -0.03% last night to +0.01%, and shorts are being liquidated. The last time COTI saw this kind of simultaneous rise in price and volume was in November last year. Back then, after funding rates turned positive, the price went on to gain another 35% through mo
COTI+19.60%
Bingtang Orange precisely targeted a $51.3 million short position near 79.8K, which happens to be the core resistance zone recently. Daring to place such a huge bet at this critical level most likely means it detected some structural topping signal, or is convinced that the strong resistance at 81–82K cannot be overcome. The logic may not be absolutely correct, but as a reference for reading the market, it is highly worth observing.$BTC
post-image
BTC+0.39%
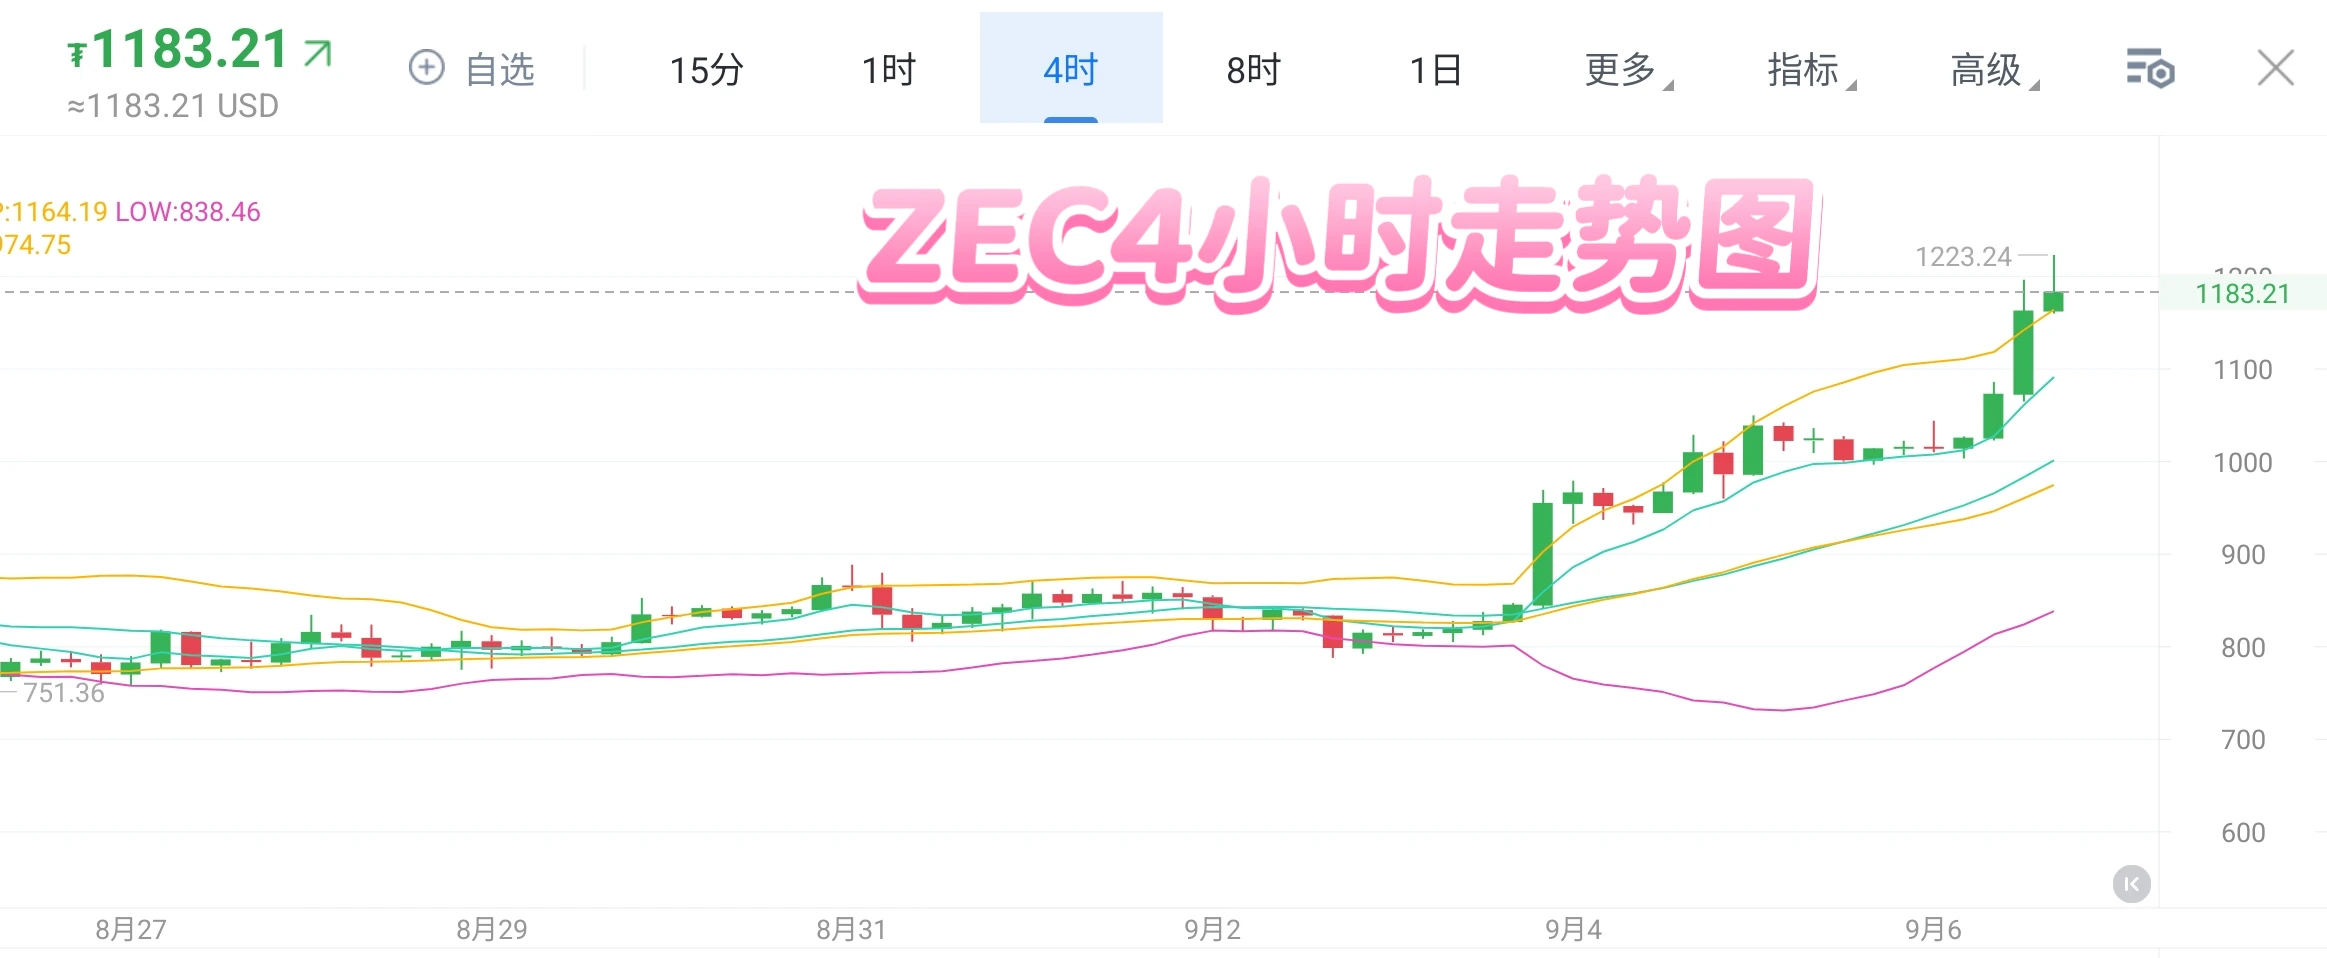
An established privacy coin is surging, with ZEC continuing to hit new highs!
ZEC's price action in this move has been very impressive, starting from around 751 and rising sharply on heavy volume to a high of 1223, with the current price at 1183.
On the 4-hour timeframe, the Bollinger Bands have fully opened upward, with the price running along the upper band. The EMA7 and EMA30 are in a bullish alignment, making the bullish trend structure very clear.
The SKDJ indicator is currently in the high range. Although it has not yet formed a clear death cross, its readings are already in the overboug
post-image
ZEC+17.29%
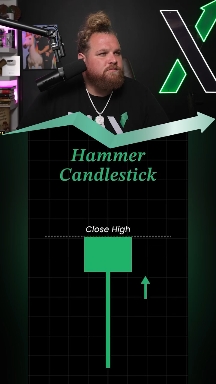
This trader put in the effort to make an amazing candlesticks video.....#trader #trading #smartmoney
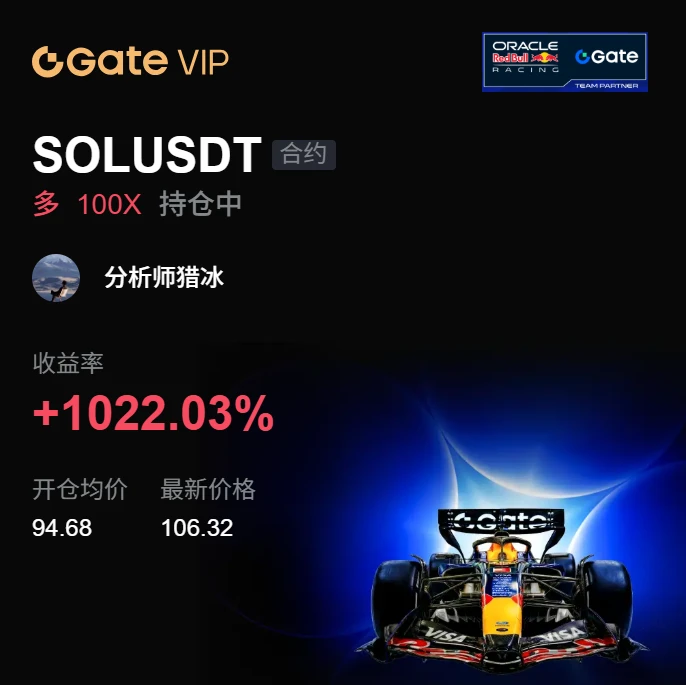
This move doesn’t even require me to think—the account is dancing on its own. A few days ago, I took a quick look at $SOL before bed. It was still lying on the floor, barely alive, so I took a chance, placed my orders, and went to sleep. When I woke up the next morning, it really didn’t disappoint me.

I entered at 94.68. The logic was simple: it was forming a base without breaking down, volume remained orderly, and the supply was being cleaned out more and more. Many people were too scared to act after watching the market repeatedly move sideways, but I knew the downside was limited at this
post-image
SOL+4.19%
LAB-2.48%
ZEC+17.29%
Here’s your next runner 🤑
0x183536D2859641a54Dd9C0405E7676E476c7C4ca
post-image
Load More

Join 40 M users in our growing community

⚡️ Join 40 M users in the crypto craze discussion

💬 Engage with your favorite top creators

👍 See what interests you

View More