Share your thoughts
placeholder
Article
GN CT 🌃
It’s been a good day.
Hope you all have an amazing weekend.
Time to rest and enjoy your night.
post-image
Cardano ($ADA ) — 2017
Cardano: A Research-Driven Blockchain
Cardano launched in September 2017, with a development philosophy heavily focused on academic research, security and long-term scalability.
ADA is the native cryptocurrency of the Cardano network, which was designed to support smart contracts, decentralized applications and blockchain governance.
Cardano became particularly known for its research-driven development approach and emphasis on carefully designed blockchain infrastructure.
Its journey shows how the crypto industry has continued experimenting with different approaches to s
post-image
ADA-3.55%
  • 9
  • 1
✨Those who missed the move will only become more numerous; the Bitcoin bull market has just begun.
Short-term fluctuations do not mean the trend has ended.
The market has repeatedly absorbed known negative factors such as rate hikes and bills, and these factors are unlikely to change the larger cycle.
At worst, there will only be sporadic rate hikes, after which the market will still return to the path of easing.
The monthly and quarterly bullish structures remain intact.
In the remaining three months of this year, there is a chance of pushing into the 90,000–100,000 range.
The real major corr
post-image
BTC-2.43%
ETH-2.42%
$NVDA ‌Nvidia (NVDA) stock is trading at $230.37, up 0.86% in intraday trading. The daily range is between $229.85 and $234.75, having opened at $231.09. The company, which closed at $228.40 yesterday, has a total market capitalization of $5.55 trillion ($5,549.98 billion), with a Price-to-Earnings (P/E) ratio of 29.195 and a year-to-date P/E ratio of 47.13.
On the technical side, the positive alignment of moving averages continues to support the price from below. On the daily chart, the 5-day moving average (MA5) is at $224.31, the 10-day moving average (MA10) is at $219.84, and the 30-day
NVDA+0.81%
  • 1
$USELESS Who could handle such a huge rise in just one day? Luckily, I had already been bullish based on all kinds of news, so I sensed it would really go up!$AKE #BTC收复8万美元
USELESS+31.39%
AKE-22.19%
I was just about to go rant on the forum, but then I checked my balance and thought better of it—the market is always right. Who wouldn’t panic when the screen is full of green? But I saw buying pressure quietly strengthening, with clear signs of funds entering. It’s bottoming out without breaking support, so I’m choosing to wait a little longer.
While everyone was still watching from the sidelines, $CLO quietly climbed from 0.06977 to 0.12023, and the +3477.17% gains are already in the bag. It was truly sluggish at first, but the result feels great.
Close 75% first, move the stop-loss on the
post-image
CLO-14.52%
XRP-4.42%
LAB+0.65%
I didn’t do anything—I just went to the restroom, and when I came back, the K-line had already done the work for me. A few days ago, while watching the market in the early morning, $WLFI was struggling to rebound; no one was taking it when it pushed up, and volume never managed to follow through. At that moment, I knew the key resistance above was no decoration. I reminded everyone not to rush into longs and gave a high-level short setup directly around 0.05841 on the rebound. Looking back now, the timing was truly perfect. The price has now dropped to 0.05685, with unrealized profit at +188.2
post-image
WLFI-2.05%
BNB-0.50%
SOL-3.31%
I was just about to go to the forum and rant, but then I looked at my balance and thought, forget it—the market is always right. During the intraday plunge, a low-volume rebound like $BTR had no one buying into it on the way up. I took one look and decided the rebound couldn’t hold. While others were still fantasizing about a reversal, I placed orders around 0.17647; I wasn’t worried about the bounce, and the harder it surged, the more it looked like a bull trap.

Now it has crashed straight down to 0.05153, handing me +1394.37%. A weak rebound is luck once, but twice makes it the truth. The
post-image
BTR+8.92%
ETH-2.42%
BTC-2.43%
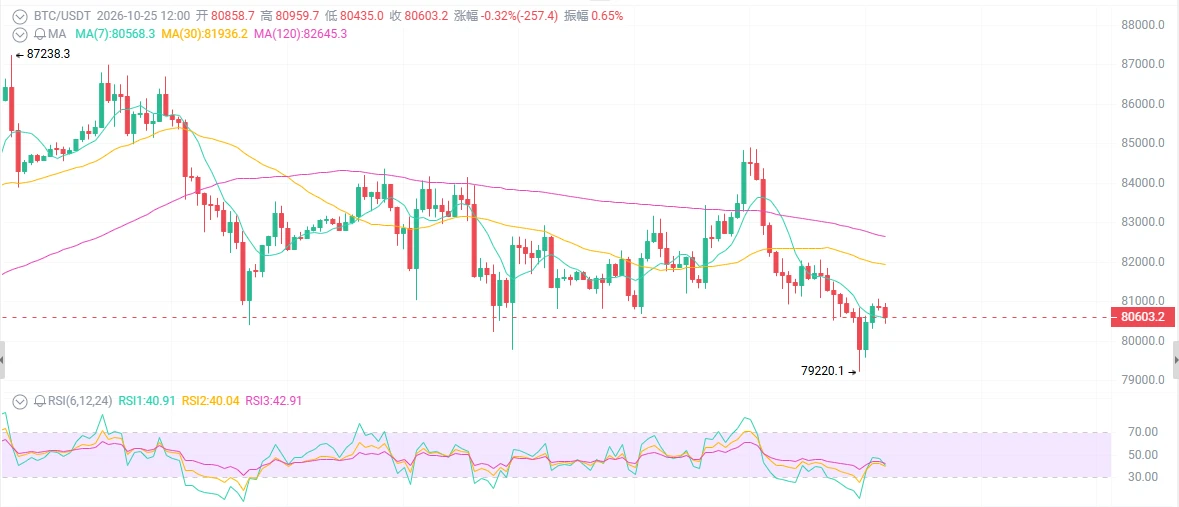
BTC Technical Outlook: Bitcoin Holds Above $79K as Bulls Target $82K+
Bitcoin is trading around $79.7K, maintaining its bullish recovery after breaking above the previous consolidation range. BTC is now approaching a major resistance cluster around $80.6K–$82.9K, where sellers previously stepped in.
📈 EMA Structure
- 20 EMA: $75,678
- 50 EMA: $71,043
- 100 EMA: $69,630
- 200 EMA: $72,491
BTC is trading above all major EMAs, confirming a strong bullish medium-term structure. The 20 EMA at $75.7K is the key dynamic support.
📐 Fibonacci Levels
- 0.236: $75,045.77
- 0.382: $82,919.00
- 0.500: $8
BTC-2.34%
Everyone’s staring at ONDO’s bounce—but the 4h tape just whispered a trap.

$ONDO /USDT - SHORT

Trade Plan:
Entry: 0.3523 – 0.3547
SL: 0.3654
TP1: 0.3446
TP2: 0.3387
TP3: 0.3298

Why this setup?
Why now? The 1D range is the cage, and RSI 15m at 35.69 shows sellers still own the micro-momentum.
- Entry ref 0.3535 sits right under the 0.3595 invalidation—tight risk, asymmetric reward.
- TP1 at 0.3446 is a 2.5% drop, but TP3 at 0.3298 stretches 6.7% if the range breaks.
- ATR 1h (0.0049) means volatility is thin—breakouts here are violent, not gradual.

Debate:
If price fakes above 0.3
ONDO-2.02%
I just casually tapped refresh, and it dropped on its own, putting me in a really passive position. With $OP moving like this, I don't even need to think—the account is dancing by itself.

When it plunged intraday, I kept watching the market and repeatedly confirming around 0.11747. The rebound was weak, the bull trap was obvious, and volume didn't follow—there was simply no one to buy into the rise. With this structure, not shorting it would have been letting this plunge go to waste.

Now at 0.09692, +842.46% is already safely in the bag. Those on the ride should have woken up laughing. Nai
post-image
OP-4.27%
ETH-2.42%
LAB+0.65%
#Gate事件合约晒单挑战
BROADCOM EARNINGS: THE AI NUMBERS ARE HUGE, BUT THE MARKET WANTED EVEN MORE
$AVGO
Broadcom has just delivered its fiscal 2026 third-quarter results, and the report perfectly shows how difficult it has become for AI stocks to simply “beat expectations.” At the current price of around $357.20, AVGO is trading after a sharp post-earnings reaction, with the stock closing around $357.16 on September 3 after falling 2.74%. The interesting part is that the underlying business numbers were exceptionally strong, yet investors initially focused on one number that was slightly below ele
post-image
AVGO+0.09%
#晒出我的持仓收益 Today’s Nonfarm Payrolls were indeed difficult to trade, but not losing is also a gain, right?
post-image
BTC NEWS
live-cover
LIVE1,823
A few days ago, my hand trembled slightly as I set a stop-loss before bed. This morning, I realized that extra act of filial piety had been unnecessary. My last glance before bed showed $BASED had just pulled back to a key level. I repeatedly confirmed that the pullback had held and the footing was solid, with absolutely no sign of a breakdown.

I judged at the time that this bullish move had potential, so I directly opened a long position around 0.05933 as a test. When I opened the chart this morning, I froze for a moment—the price had already touched 0.06868, with +757.86% sitting there. T
post-image
BASED-1.70%
SOL-3.31%
BNB-0.50%
Tether ($USDT ) — 2014
USDT: Bringing Dollar Stability Into Crypto
Tether launched its first USD-pegged token in 2014, creating one of the earliest major stablecoins in the cryptocurrency industry.
Unlike assets such as BTC and ETH, USDT is designed to maintain a value close to the U.S. dollar rather than generate price appreciation.
USDT became extremely important for crypto trading because it allows users to move dollar-denominated value across blockchain networks without leaving the digital-asset ecosystem.
Today, stablecoins are an important bridge between traditional finance and cryptocur
post-image
USDT0.00%
  • 10
  • 2
Live trading - Analysis Crypto market
live-cover
LIVE1,017
Why is everyone fading $ESPORTS /USDT right before the 4h close?

$ESPORTS /USDT - SHORT

Trade Plan:
Entry: 0.01460 – 0.01470
SL: 0.01516
TP1: 0.01426
TP2: 0.01401
TP3: 0.01362

Why this setup?
The 1D trend is bearish, and the 95% confidence SHORT signal aligns with that. RSI on the 15m is overheated at 71.37—buyers are exhausted. Entry zone 0.01465 with TP1 at 0.01426 and TP2 at 0.01401 offers a 4.4% drop potential. The ATR (0.000214) shows volatility is tight, so the move down could be swift if 0.01460 breaks.

Debate:
Are you shorting the breakdown to 0.01401 or waiting for a retest of
ESPORTS-1.01%
$USELESS Signal】Multi-timeframe divergence, short-term long setup
$USELESS RSI 4H surged to 77.58, entering a cooling phase after buying pressure. 1H MACD momentum is contracting, with price changing hands within a narrow range around 0.2380. Order book depth imbalance is -25.63%, and the active buy ratio is 0.59, making the short-term cost of chasing highs relatively high.
🎯 Direction: Long
⚡ Entry/Limit Order: 0.2373458 - 0.2380600
🛑 Stop Loss: 0.2356794
🚀 Target 1: 0.2416309
🚀 Target 2: 0.2434164
🛡️Trade Management:
- Execution Strategy: After reaching Target 1, reduce the position
post-image
USELESS+31.39%
BTC-2.34%
ETH-2.31%
SOL-3.15%
Load More

Join 40 M users in our growing community

⚡️ Join 40 M users in the crypto craze discussion

💬 Engage with your favorite top creators

👍 See what interests you

View More