








Square
Following
Hot
News
Profile
Share your thoughts
placeholder
Article
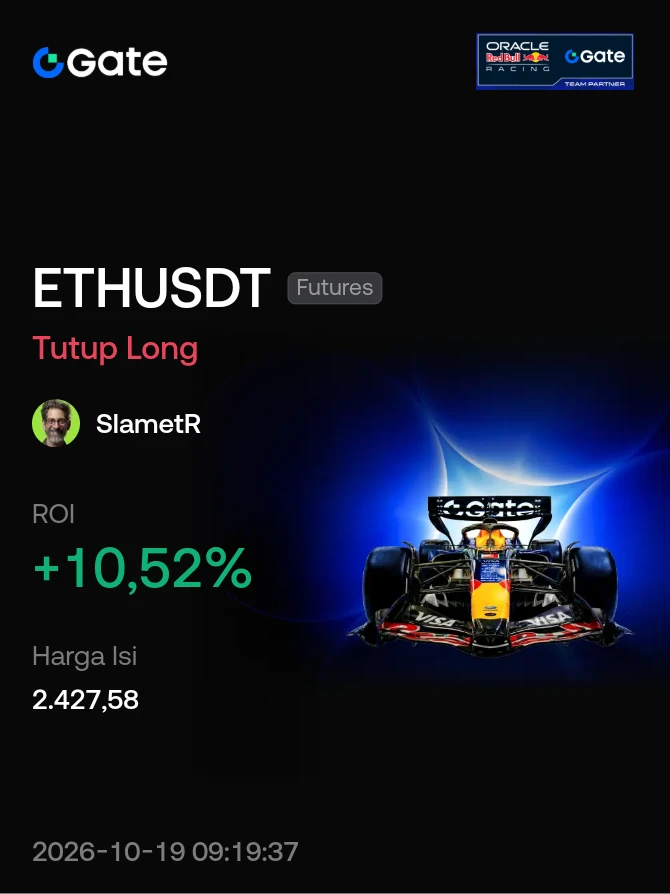
#Share My Futures Return#
Average 3 x akhirnya profit jg.
post-image
10.19 When trading contracts, don't be fixated; adapt as the trend shifts and go with the flow.
Today's ETH early-morning rebound to the 2410-2420 range could be considered an “oversold bounce,” but once it moved above 2420 at midday and held, that signaled a shift from bearish to bullish—the short-term trend had reversed!
ETH+0.27%
Trenches
CNPY
C
bade
b
CNPY
0xc6...ddd2
Market Cap
$.
Change
.
24h Vol
$.
Holders
.
TSI
T
bade
b
TSI
0xa8...1c1e
Market Cap
$.
Change
.
24h Vol
$.
Holders
.
AGT
A
bade
b
AGT
0x5d...e274
Market Cap
$.
Change
.
24h Vol
$.
Holders
.
BOOMER
B
bade
b
BOOMER
0x5a...5c00
Market Cap
$.
Change
.
24h Vol
$.
Holders
.
PIERRE
P
bade
b
PIERRE
D3S6...pump
Market Cap
$.
Change
.
24h Vol
$.
Holders
.
First trade of the morning
Long at 4171 → exited at 4178, profit secured, ➕7 points➕656 U.
Choppy market; capture short-term swings and don't get greedy. $XAU
XAU+0.44%
Major cryptocurrencies are showing typical short-term bullish confluence. The KDJ indicator’s J value is generally elevated and even severely overbought, but the daily moving averages have yet to turn upward, reflecting a “battle between a short-term oversold rebound and a daily downtrend.”
High-volatility altcoins have the strongest bullish momentum. Prices have quickly moved above short-term moving averages and broken through the Bollinger Bands middle line. The KDJ is showing a bullish crossover and diverging upward, leaving room for further short-term upside.
Among macro safe-haven assets,
post-image
NAS100+1.36%
HK50-0.71%
NVDA-1.42%
UK100+0.34%
  • 7
#GateBTCAndETHFuturesVolumeRanking
Bitcoin and Ethereum futures trading activity remains a key market indicator.
🔍 What traders should monitor: • BTC and ETH futures volume • Open interest (OI) • Funding rates • Liquidation levels • Spot buying and selling pressure
High futures volume can indicate strong participation, but it does not guarantee that the market will move upward. Rising open interest with aggressive leverage can also increase liquidation risk.
post-image
BTC+0.95%
ETH+0.27%
$WLD
Longs are retreating faster than anyone else, and the 0.4835 support is hanging by a thread 😤 4h open interest surged 7 points, with shorts pushing the price down. A breakdown is imminent—don’t wait until it crashes through to remember to get out.
post-image
WLD-0.44%
October 19, Monday — Zhongling BTC/ETH Trading Strategy
BTC is currently around 82440. Resistance above is clear after the rebound, and moving average pressure remains in effect. The rebound momentum is gradually weakening, with selling pressure emerging on each attempt to move higher.
Today’s strategy is to prioritize shorting after a rebound rather than rushing to chase the decline. Wait for the price to rebound to the resistance zone and show signs of stalling before entering short positions, aiming to capture further downside.
Trading plan
BTC: Short around 82600-83500, target around 80700
post-image
BTC+0.95%
ETH+0.27%
South Korea's KOSPI stock index is trending after a reported 3.3% jump.
A strong stock-market session can indicate improving risk appetite, but the reason behind the rally matters. Investors should examine semiconductor performance, foreign investment flows, currency movements, and broader economic sentiment before drawing conclusions about crypto.
⛽ Baker Hughes and Venezuelan gas: What’s at stake for the dollar, USDT, and your P2P trades
The government met with Baker Hughes (its CEO, Lorenzo Simonelli), Lindsayca, and New Stratus Energy to get gas projects moving. Beyond the energy headline, this move directly affects three things you care about: the flow of foreign currency, the parallel exchange rate, and the price of USDT in the P2P market.
Why gas moves your exchange rate:
The P2P market runs on the supply and demand for digital dollars, and that demand responds in real time to perceptions about the country’s foreign currency inflo
post-image
#ShareWeekly #WarshIMFSpeech Warsh said nothing, and the market loved it: what Bangkok really told us about rates and BTC
Sometimes the loudest message from a central banker is the one he refuses to send. In Bangkok, Fed Chair Kevin Warsh sat down with IMF chief Kristalina Georgieva and gave traders no hint about the next rate move. The result was a relief bounce across dollars, stocks and crypto. Here is my read on the two questions everyone is asking.
Hawkish or dovish? Neither, and that is the story
Warsh stuck to price stability and refused to prejudge upcoming meetings. He also skipped fo
Falcon_Official
#ShareWeekly #WarshIMFSpeech Warsh said nothing, and the market loved it: what Bangkok really told us about rates and BTC
Sometimes the loudest message from a central banker is the one he refuses to send. In Bangkok, Fed Chair Kevin Warsh sat down with IMF chief Kristalina Georgieva and gave traders no hint about the next rate move. The result was a relief bounce across dollars, stocks and crypto. Here is my read on the two questions everyone is asking.
Hawkish or dovish? Neither, and that is the story
Warsh stuck to price stability and refused to prejudge upcoming meetings. He also skipped forward guidance and pointed to central banks tightening in sync around the world, which tells us inflation is a global fight, not just an American one. He called the surge in investment the biggest upside force in the global economy. Sounds upbeat, but it also leaves the door open to keeping rates high if prices stay stubborn.
Why did silence feel like a gift? Look at what came before it. September CPI hit 3.7% against 3.6% expected. Producer prices jumped 1.3% on the month and 6.3% on the year, with energy up 10.8%, and core PPI rose 0.7% against a 0.3% forecast. With numbers that hot, one hawkish sentence could have shaken every market. It never came. Traders took the absence of a warning as relief, not as a dovish turn.
Is another October hike still on the table?
It is, but the market sees it as a long shot. The implied chance of a hike in two weeks dropped from around 27% to 15% after he spoke, and rate futures showed a similar move, from 28% to 14.9%. Still, do not write the hawks off. New York Fed President John Williams has said one more hike this year is appropriate. The next policy meeting is October 27-28, and between now and then, inflation prints, energy prices and any change in Fed language will decide the odds. One more hot reading could push them back up fast.
How the rest of the market answered
The reaction was a clean risk-on whisper:
- The dollar slid to a fresh 10-day low near 101.80, with the euro up and the Australian dollar near 0.6950.
- The 10-year Treasury yield held near 5.08%.
- S&P 500 futures traded near 7,800 and Nasdaq 100 futures near 30,150.
- Korea's KOSPI, which crashed 7.57% a day earlier, rose 2.05% to close at 5,668.05, its first higher close in eight sessions.
- Gold dipped toward $4,073 on hike bets, then recovered as the dollar and yields eased.
What it means for Bitcoin
BTC got a relief bounce, not a new trend. It jumped more than 2% in 24 hours to about $82,300 and sits near $81,650 now. The logic is simple: a softer dollar and calmer rate fears take pressure off risk assets.
The contrast with August is striking. When Warsh sounded clearly hawkish at Jackson Hole, Bitcoin slid below $77,000. This time the tone was neutral, and the market moved the other way. The message for traders is that Bitcoin reacts less to what the Fed does and more to what the Fed makes people fear.
There is a catch. One analysis rated the effect on BTC as mixed, because high rates could linger. And Bitcoin is still healing from this week's flush, when it dipped under $80,000 and liquidations approached $1 billion.
The levels I am watching
Support: the 50-day EMA at $80,443, then the 100-day EMA at $76,824 and the 200-day EMA at $75,751.
Resistance: a daily close above $82,538 would open the way toward $84,049 to $84,250.
Danger line: a close below $80,443 puts $80,206 and the recent low near $79,694 back in play.
Three paths into the Fed meeting
The rally path: inflation cools or hike odds drop further, and BTC pushes through $82,538 toward $84,250.
The range path: no catalyst, and BTC chops between $80,400 and $83,000.
The pullback path: hot data lifts hike odds above 30%, the dollar firms up and BTC retests $80,000.
My take
Warsh did not hand the market a script, so traders are writing their own, and expectations can flip quickly. I lean toward a modest relief move, with the Fed meeting and the next inflation reports as the real tests. I am keeping leverage low, treating $80,000 as the line in the sand and calling any rally conditional until the data agrees.
Now it is your turn, Gate Square. Are you seeing Warsh's silence as quietly hawkish or quietly dovish, and where do you think BTC goes before the October 27-28 meeting? Drop your call and your key level in the comments.

repost-content-media
BTC+0.95%
SPX500+0.99%
US500+0.87%
NAS100+1.70%
XAU+0.44%
#NEARJumpsNearly10%
NEAR Protocol Rally: Is This the Start of the Next Leg or a Pause Before a Pullback?
NEAR has been one of the strongest large-cap Layer 1 tokens over the past few months, and today's move toward the 10 percent range has pulled it back into the center of trader attention. Trading around $5.19 to $5.25 at the time of writing, the token has now climbed from below $2 in early August to above $5 in September, and it has spent the weeks since then testing the $5.00 to $6.00 zone. Before deciding what to do, it helps to understand what is driving the move, what the chart is sayin
Sakura_3434
#NEARJumpsNearly10%
NEAR Protocol Rally: Is This the Start of the Next Leg or a Pause Before a Pullback?
NEAR has been one of the strongest large-cap Layer 1 tokens over the past few months, and today's move toward the 10 percent range has pulled it back into the center of trader attention. Trading around $5.19 to $5.25 at the time of writing, the token has now climbed from below $2 in early August to above $5 in September, and it has spent the weeks since then testing the $5.00 to $6.00 zone. Before deciding what to do, it helps to understand what is driving the move, what the chart is saying, and where the risks sit.
Start with the flow story. Bitwise launched a US spot exchange-traded fund for NEAR under the ticker NRR on NYSE Arca. The fund has been recording steady inflows, including a second consecutive weekly inflow of more than $13 million. ETF inflows matter for a token like NEAR because they represent regulated, institutional demand that does not rely purely on retail speculation. They do not guarantee price appreciation, but they tend to add a floor under the market during consolidation periods and can extend rallies when they accelerate.
The second driver is product activity. NEAR Intents, the protocol's cross-chain intent-based transaction layer, has seen its confidential total value locked rise to roughly $167 million. Intents are the kind of fundamental development that bulls point to when arguing the rally is backed by usage rather than hype. Usage metrics support that argument. Daily active users on the NEAR network reportedly rose from about 110,000 in September to nearly 257,000 more recently, reversing much of the decline seen earlier in the 90-day window. Rising users, rising TVL and rising ETF demand are a combination that gives the bull case real substance.
Now the price structure. The daily chart shows NEAR completing a powerful rally from below $2 in August into the $5 to $5.50 band in September. Price then consolidated in that range for several weeks, tested the upper boundary repeatedly, and pulled back to around $4.65 before recovering. The more recent push carried the token to a rejection near $5.97 to $6.00, which has been the key ceiling on the weekly chart. A weekly candle later closed back near $5.09 after dropping about 13 percent over that period, which is a reminder that the zone above $5.90 is still a supply area.
On the one-hour chart, the trend structure is bullish. Price is holding above the 30-period, 120-period and 200-period exponential moving averages, which sit near $5.16, $5.12 and $5.14 respectively on the one-hour timeframe. The relative strength index is in neutral territory near 56, which means momentum is constructive without being overbought. That matters: an overheated RSI after a fast move usually precedes a pullback, and today's reading does not yet show that stress.
The four-hour chart is more mixed. Price remains above the four-hour 50-period moving average, which sits around $5.19, while the 200-period average is much lower near $4.29. That gap is useful: it suggests the longer-term trend is up, but the short-term structure is still digesting the last impulse. A four-hour close back below $5.10 would weaken the near-term setup and shift attention to lower supports.
Derivatives data adds another layer. Open interest has increased by roughly 20 percent over the past 24 hours, to around $1.58 billion. Funding rates are slightly positive at about 0.005 percent, which indicates longs are paying shorts but not aggressively. The long-short ratio is above one, showing more traders positioned for upside, and roughly $43 million in liquidations were recorded over the last 24 hours, split between longs and shorts. Rising open interest during a rally generally means new money is entering, which supports trend continuation. It also means the market becomes more fragile if price breaks down, because leveraged longs can be forced to sell into weakness.
Turning to levels, the most important support sits between $5.10 and $5.13, where the one-hour moving averages cluster and where recent intraday buyers have defended the price. Below that, $5.00 is a psychological level and a prior consolidation floor. Beneath that is the $4.65 pullback low, which marks the most recent swing low on the weekly-scale pullback. The four-hour 200 EMA near $4.29 is the deeper line that bulls need to protect for the medium-term structure to remain intact.
On the upside, $5.44 is the 24-hour high and the first near-term resistance. The more significant barrier is the $5.97 to $6.00 zone, which has produced rejections and now sits at the top of a multi-week range. A confirmed daily close above $6.00, ideally on rising volume, would be a meaningful breakout and would open the path toward the $7 to $8 area that some analysts have cited as the next major target. Longer-term price targets circulating in the market are considerably more aggressive, but those are speculative forecasts rather than technical conclusions, and they should be treated with caution.
Let us think about the trade rather than the narrative. The entry quality matters more than the direction alone. Buying near $5.40 to $5.50 after a fast 10 percent move places a trader close to the 24-hour high and well above the one-hour moving averages. The stop loss in that case would need to be wide, and the reward to the $6.00 resistance is modest relative to the risk. That is a chasing entry, and it tends to produce poor outcomes in volatile markets.
A cleaner approach for a swing trader is to wait for a pullback into the $5.10 to $5.15 zone, which overlaps the one-hour moving averages and the short-term support. A stop placed below $4.95 keeps the invalidation clear: if price closes below that level, the short-term structure has broken and the setup is no longer valid. A target near $5.90 to $6.00 offers a reasonable reward-to-risk profile, while a break above $6.00 on volume could justify holding for a larger move.
For breakout traders, the signal is a daily close above $6.00 with volume confirmation. Waiting for that close avoids the common trap of buying an intraday spike that fails within hours. A retest of the $6.00 level as new support after a breakout would strengthen the case further. Breakout traders should also be prepared for a fast retracement, since the last rejection at that level was sharp.
Risk management deserves emphasis. NEAR has already risen roughly 150 percent in a matter of weeks, and crypto assets with that kind of run commonly retrace 20 percent or more before the next leg, even within a healthy uptrend. Position sizing should assume that a sharp pullback is normal rather than exceptional. Using a fixed percentage of portfolio risk per trade, rather than a fixed dollar amount, helps keep losses manageable regardless of how volatile the market becomes. Avoid putting a large share of capital into a single leveraged position, especially with open interest elevated.
There are also several risks to the bullish thesis that are worth monitoring. A slowdown in ETF inflows would remove one of the key institutional supports. A broader crypto market correction would likely drag NEAR lower regardless of its fundamentals, since altcoins tend to amplify Bitcoin moves in both directions. A failure of Intents TVL to keep growing, or a decline in daily active users, would weaken the adoption argument that underpins the rally. Finally, the rejection at $5.97 to $6.00 has shown that sellers remain active at that level, and any repeated failure there could trigger profit-taking from earlier buyers who entered during the August and September run.
What would change the outlook? A bullish reversal of the current view would require NEAR to reclaim and hold above $6.00 on a daily close, supported by continued ETF inflows and rising network activity. A bearish reversal would be signaled by a close below $5.00 followed by a failure to recover the $5.10 to $5.15 zone, which would open the door to a retest of $4.65. A deeper breakdown below $4.65 would challenge the medium-term trend and would likely be accompanied by a cascade of liquidations given the current leverage.
The honest conclusion is that NEAR has a constructive setup. Trend structure, fund inflows, improving network usage and a neutral momentum reading all point to a market that still has room to run. At the same time, the rally has been fast, the key resistance at $6.00 has rejected price before, and open interest is building. That combination favors patience and discipline over chasing. For most traders, the highest-quality opportunity is likely to come from a controlled pullback rather than from buying strength at the top of a short-term move.
This is market analysis for educational purposes and is not financial advice. Prices, flows and data points can change quickly, and every trader should set their own risk limits, verify information independently, and only commit capital they can afford to lose.
  • 1
  • 1
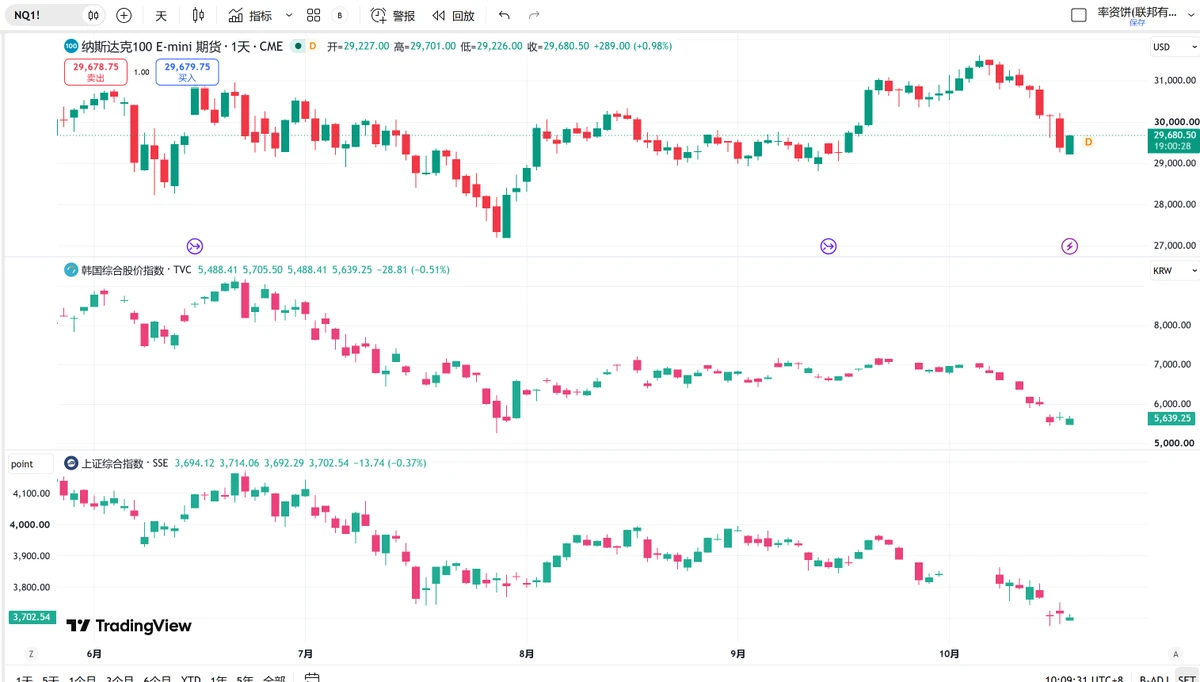
US Nasdaq 100 futures, South Korea’s KOSPI index, and the A-share Shanghai Composite Index all opened lower on Monday.
However, Nasdaq 100 futures rebounded above Friday’s closing price, while the KOSPI and Shanghai Composite indexes have not.
Of course, Nasdaq 100 futures are just a futures contract with too small a market; we still need to see the market open tonight.
post-image
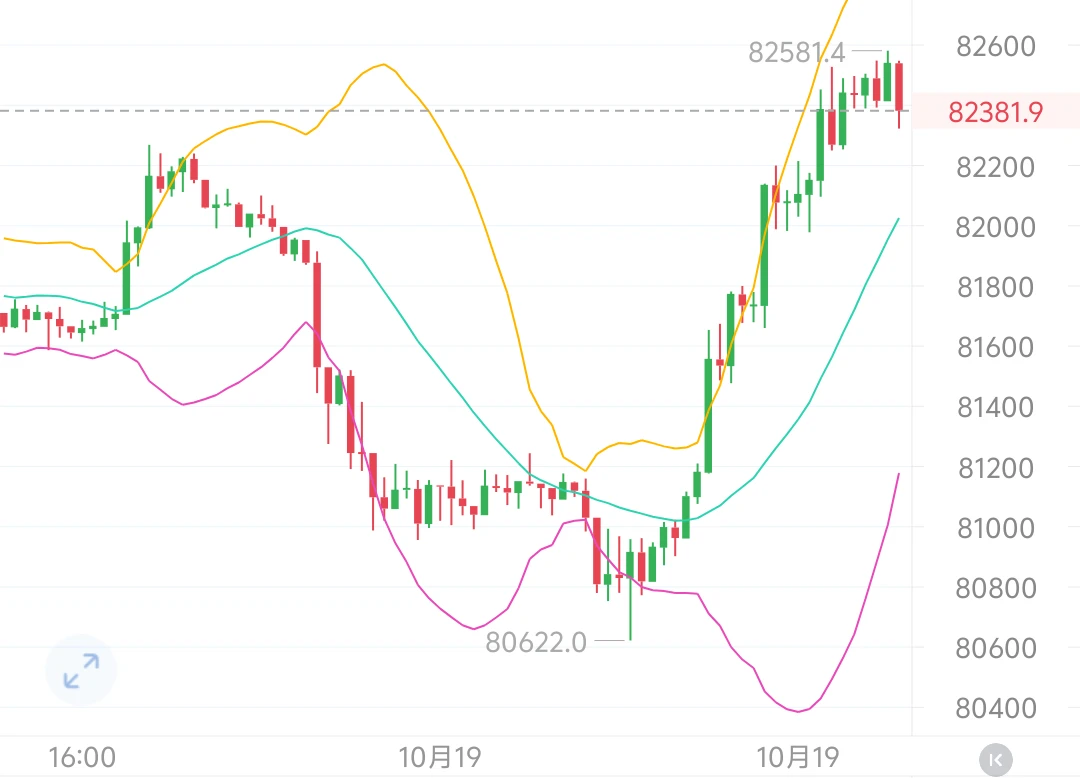
Yesterday, Bitcoin first dipped to a low of 80622, then staged a recovery bounce, climbing all the way to around 82581.
This rebound is only a technical recovery within the broader downtrend; the bearish trend on the daily timeframe has not reversed. On the 4-hour chart, the price rebounded to the upper Bollinger Band. The 1-hour chart has posted consecutive bullish candles, and the KDJ has entered the overbought zone. Short-term rebound momentum has been fully exhausted, while overhead selling pressure remains. The overall trading strategy remains unchanged: favor short positions on rebounds.
post-image
BTC+0.95%
FIP-30 rewards are live, and the Fractal ecosystem is steadily moving forward.
As a core supporter, UniSat directly integrates related DApps into its wallet, allowing retail users to participate without any hassle. It also continues to buy back FB and invest in long-term Index Mining & Staking. These practical steps give ordinary users more confidence to participate.
The focus on experience upgrades like one-step transfers and asset management lowers the barrier to entry, making it feel like they’re seriously building tools rather than just making promises.$FB #美国9月PPI大超预期
FB-0.87%
BTC MARKET OVERVIEW
live-cover
LIVE1,428
This has to be the most impressive person in the system! He’s only 31—what kind of person could possibly be worthy of him!
post-image
$XAU
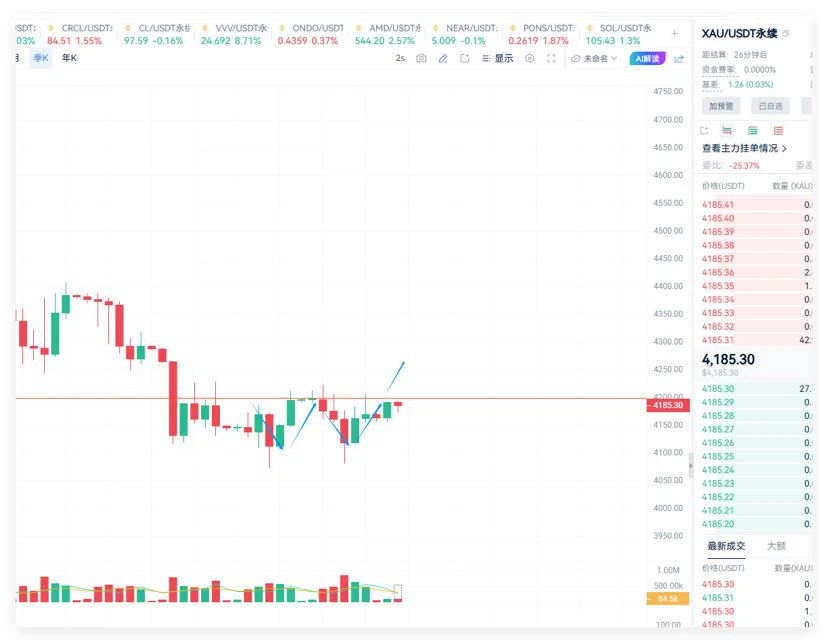
Gold has been range-bound for a long time; the key question is whether it can break above 4200!
The daily chart has formed a setup worth taking a bet on. #比特币短线站上8.2万美元
post-image
XAU+0.44%
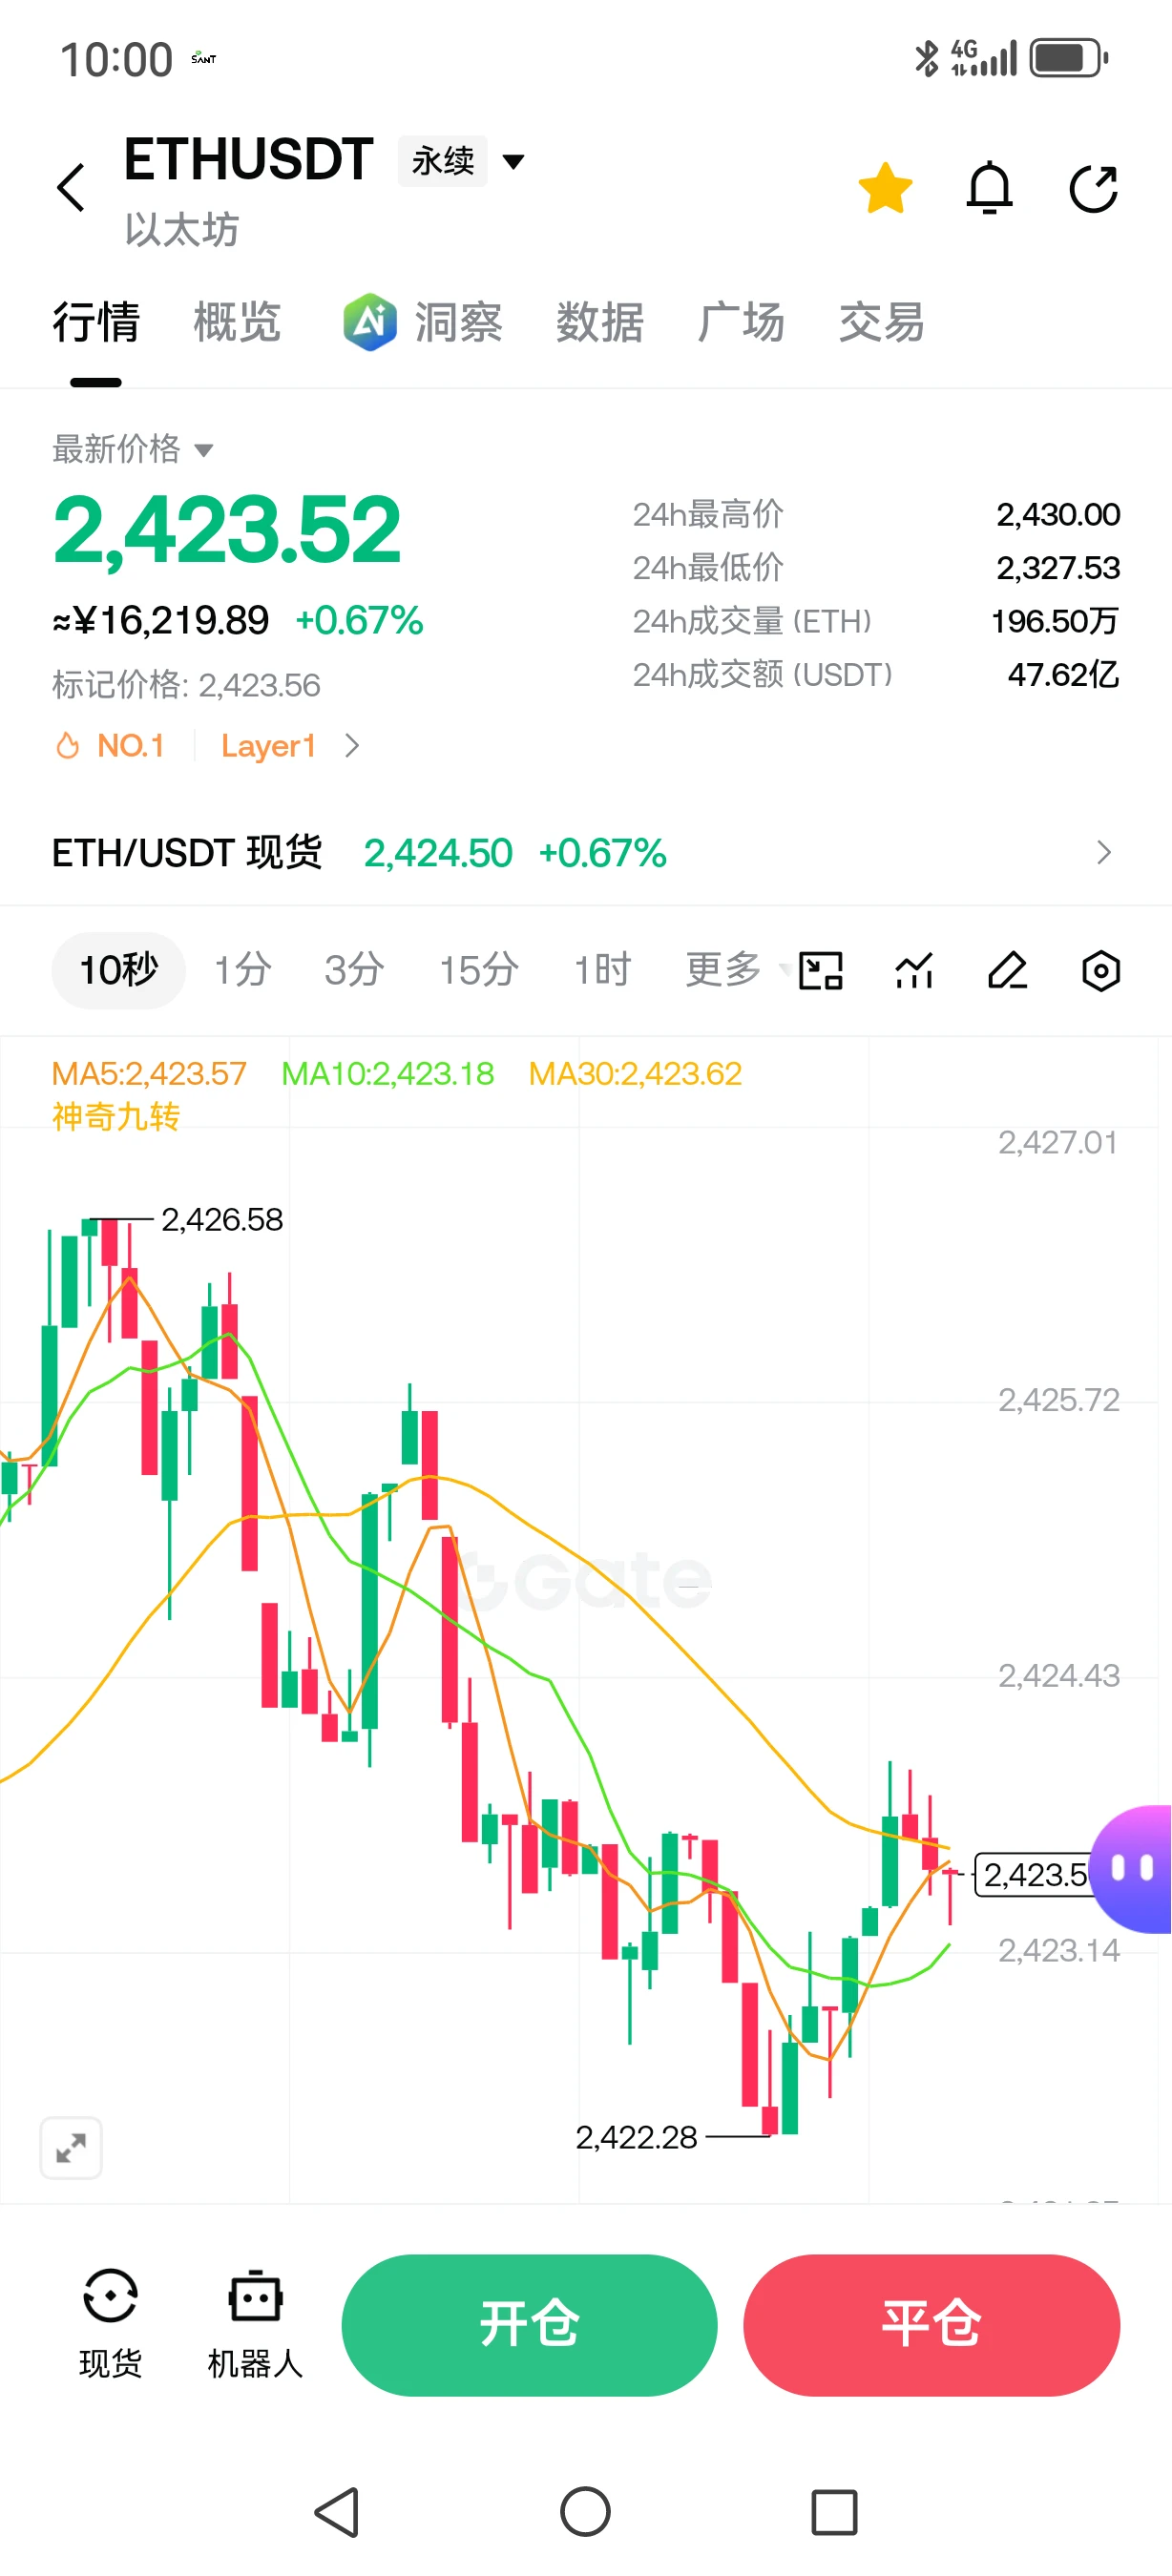
$ETH Short around 2430, take profit at 2405-2385, stop-loss at 2445. Follow me for precise strategies every day—those who follow along make profits. Join my livestream every night at 8:30 to share strategies and place trades
post-image
ETH+0.29%
🌈 Gate Live Livestream Ideas - October 19
Trending Topics:
🔹 A blockbuster earnings week is here! Jensen Huang appears at GTC, while Meta and Tesla report results—is the U.S. stock market in for a major move?
🔹 Why is BTC struggling to rise in October? Galaxy Research identifies two main culprits: corporate buying has dried up and ETF funds are flowing out. Who will step in to buy?
🔹 BTC is back to $82k, but altcoins aren’t gaining ground! The broader market continues to trade sideways—how much longer until a genuine breakout?
🔹 Another wave of altcoin unlocks is coming! Large amounts of
GateLiveChinese
🌈 Gate Live Livestream Ideas - October 19
Trending Topics:
🔹 A blockbuster earnings week is here! Jensen Huang appears at GTC, while Meta and Tesla report results—is the U.S. stock market in for a major move?
🔹 Why is BTC struggling to rise in October? Galaxy Research identifies two main culprits: corporate buying has dried up and ETF funds are flowing out. Who will step in to buy?
🔹 BTC is back to $82k, but altcoins aren’t gaining ground! The broader market continues to trade sideways—how much longer until a genuine breakout?
🔹 Another wave of altcoin unlocks is coming! Large amounts of ZRO, XPL, and H are about to be released—which is most vulnerable to a sell-off?
🔹 Anthropic is setting aside 5% of its shares to establish a public-benefit fund! The higher the AI giant’s valuation climbs, the more it donates—what’s the strategy behind this?
🔹 South Korea’s stock market has crashed again! KOSPI falls more than 3%, and SK Hynix drops 4%—why are AI chip stocks repeatedly facing sell-offs?
🔹 U.S. stock futures, gold, and silver are all rising! Nasdaq futures are up 0.76%—why are risk assets and safe havens strengthening at the same time?
🔹 CFTC unveils a new crypto regulatory proposal! Platforms can voluntarily submit to unified federal oversight—is an industry shake-up about to begin?
Go live on any topic for a chance to be featured on the official website homepage!
🔥 More topic ideas and tips: https://www.gate.com/help/community-center/live_chat/49345
repost-content-media
TSLA-2.17%
SK Hynix-0.78%
BTC-0.96%
ZRO+0.38%
XPL-0.31%
Load More

Join 40 M users in our growing community

⚡️ Join 40 M users in the crypto craze discussion

💬 Engage with your favorite top creators

👍 See what interests you

Trending Topics

StakeLaunchPoolToShare2.8M$DNA

36.47k Views651 Discussing

Gate LaunchPool’s DNA debut campaign is now live with a total reward pool of 2.8M $DNA. Stake $BTC, $ETH, or $DNA to participate, with rewards distributed hourly. If you’re looking for a simple way to join a new-token opportunity. [👉 Join Now](https://www.gate.com/launchpool/554)

GateWCTCS9GlobalTradingCompetition

37.93k Views6.86k Discussing

BitcoinTops$82K

41.17k Views39.71k Discussing

View More