






Square
Following
Hot
News
Profile
Share your thoughts
placeholder
Article
$DOGE Dogecoin H1 Breakout: Pullback Could Confirm the Next Move
DOGE
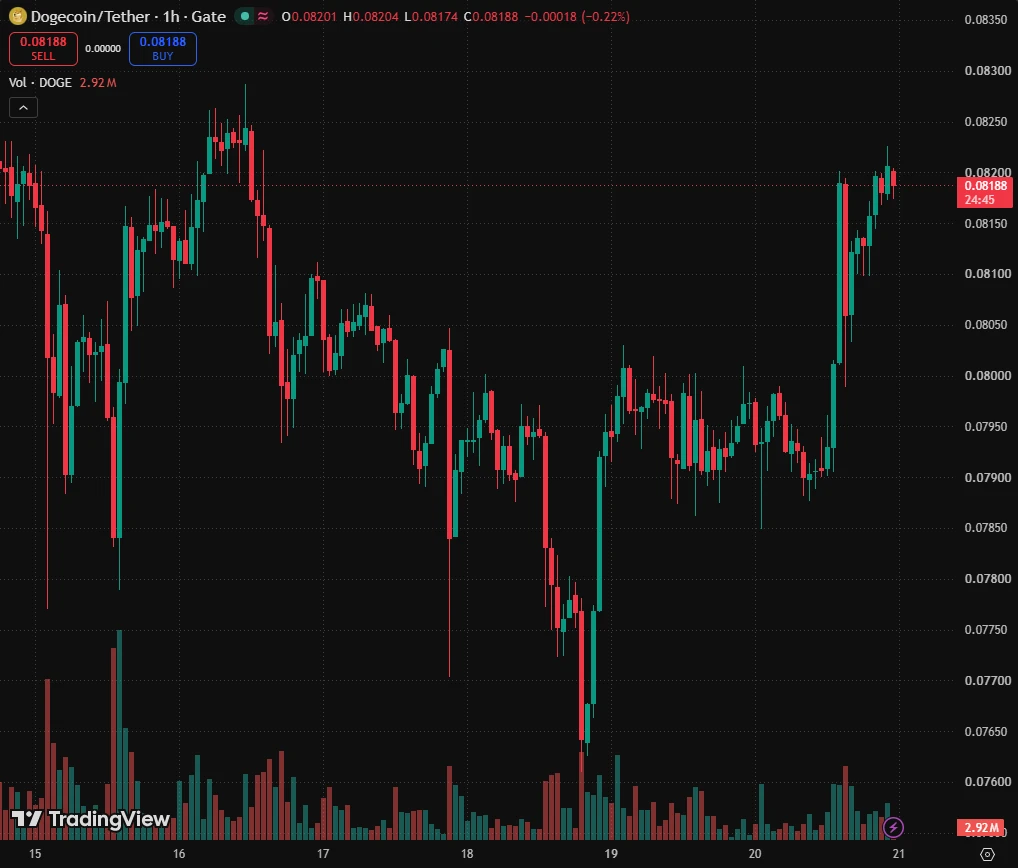
DOGE is showing bullish signs on the H1 chart after breaking its broader descending trendline and moving above a short consolidation structure.
The next step is to see whether the breakout can hold and whether the marked support zone attracts buyers.
Following our previous Daily analysis, the H1 chart is now providing a closer look at the short-term structure.
Price broke the descending trendline, consolidated within a narrow range, and has now pushed above that range with a strong bullish move.
This is a constructive develo
post-image
DOGE+3.72%
180k LINK moved out in 24 hours—where did the coins go from the exchange wallet? Looking through on-chain records, one transaction stands out: Onchain Lens detected a whale address that gradually withdrew 246.8k LINK from an exchange over just 4 days, worth about $3.01 million. In the latest 24 hours alone, it moved 182.16k LINK, worth around $2.18 million, with the last transaction withdrawing 67.56k LINK on its own. The coins were transferred from the exchange to the holder’s own wallet. On-chain withdrawal amounts, timestamps, and destination addresses are all publicly verifiable. This is s
post-image
ICP+4.00%
ALGO+3.82%
LINK+3.95%
Trenches
Kimchi
K
bade
b
Kimchi
CSoc...pump
Market Cap
$.
Change
.
24h Vol
$.
Holders
.
Pokémon
P
bade
b
Pokémon
D42T...Xvb1
Market Cap
$.
Change
.
24h Vol
$.
Holders
.
AGT
A
bade
b
AGT
0x5d...e274
Market Cap
$.
Change
.
24h Vol
$.
Holders
.
Dacity
D
bade
b
Dacity
nxPq...pump
Market Cap
$.
Change
.
24h Vol
$.
Holders
.
STONK
S
bade
b
STONK
6GmA...UNgx
Market Cap
$.
Change
.
24h Vol
$.
Holders
.
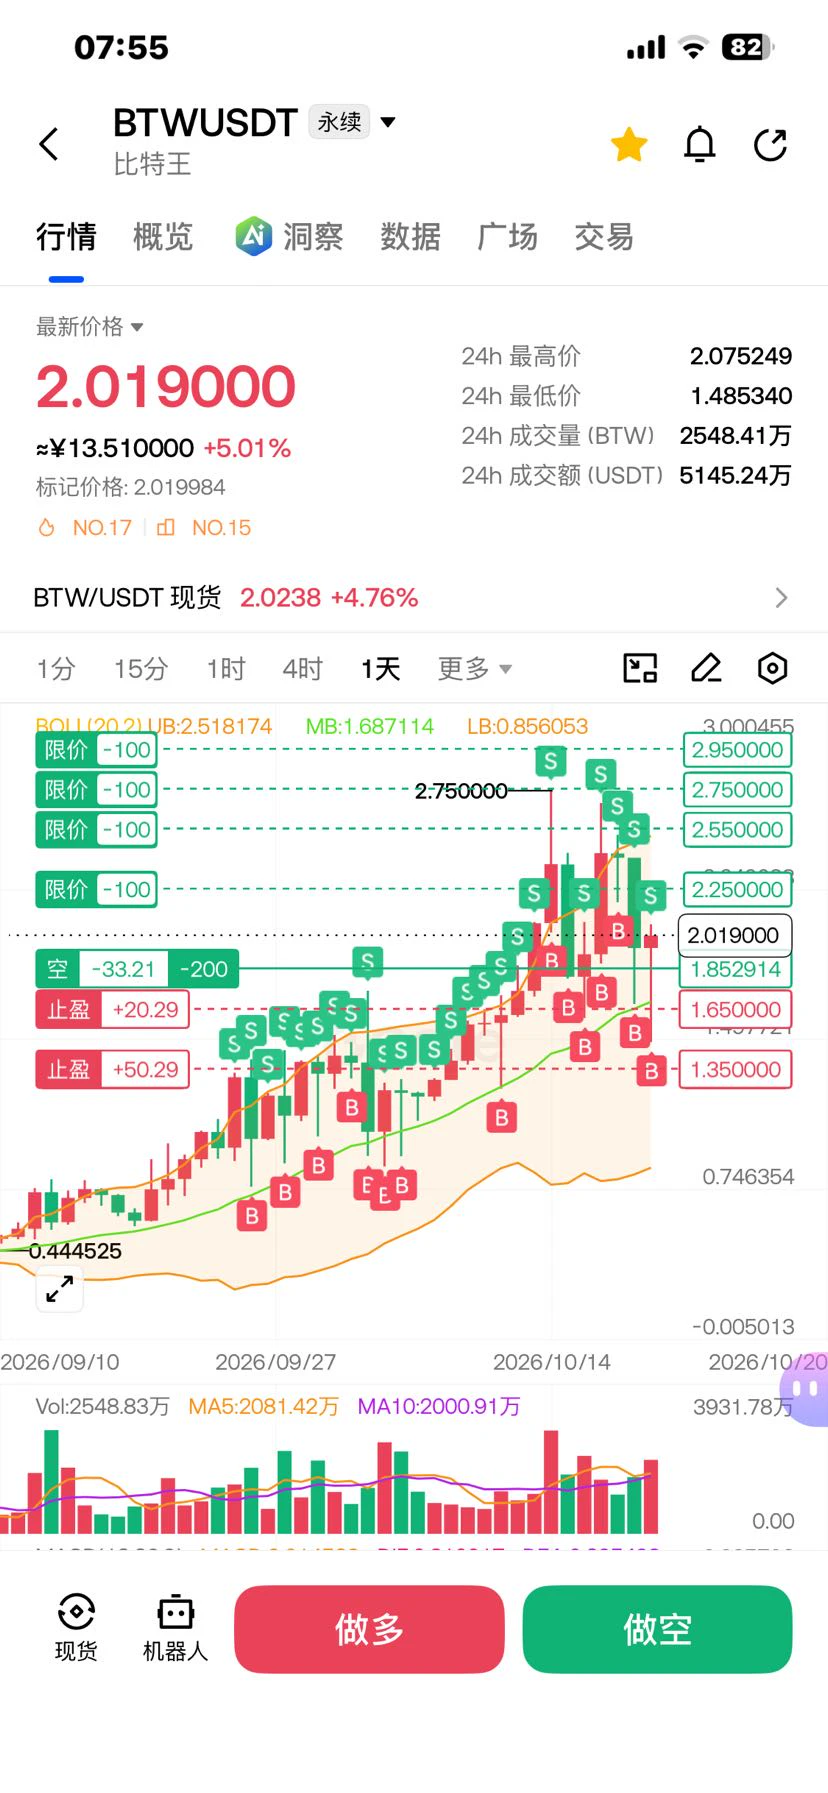
$BTW I've shown my hand; bulls, keep it up
post-image
BTW+3.33%
  • 1
261021 Bitcoin is following the weekly chart, with smaller timeframes crossing upward on the 4/6-hour charts; ETH is crossing upward on the 3/4-hour charts. Use stop losses for short-term trades! BTC resistance levels: 84523/86017/87179; BTC support levels: 81533/80039/78877; ETH resistance levels: 2493/2537/2571; ETH support levels: 2405/2361/2327. Place your stop loss slightly beyond the third price level. Intraday trades should not exceed 5% of your position. Live streams are held in the afternoon and evening; follow my profile to find me. #特斯拉Q3财报
post-image
BTC+1.86%
Even if Ash came to Pump, he’d still say, “Damn, I was so close😅”
post-image
  • 1
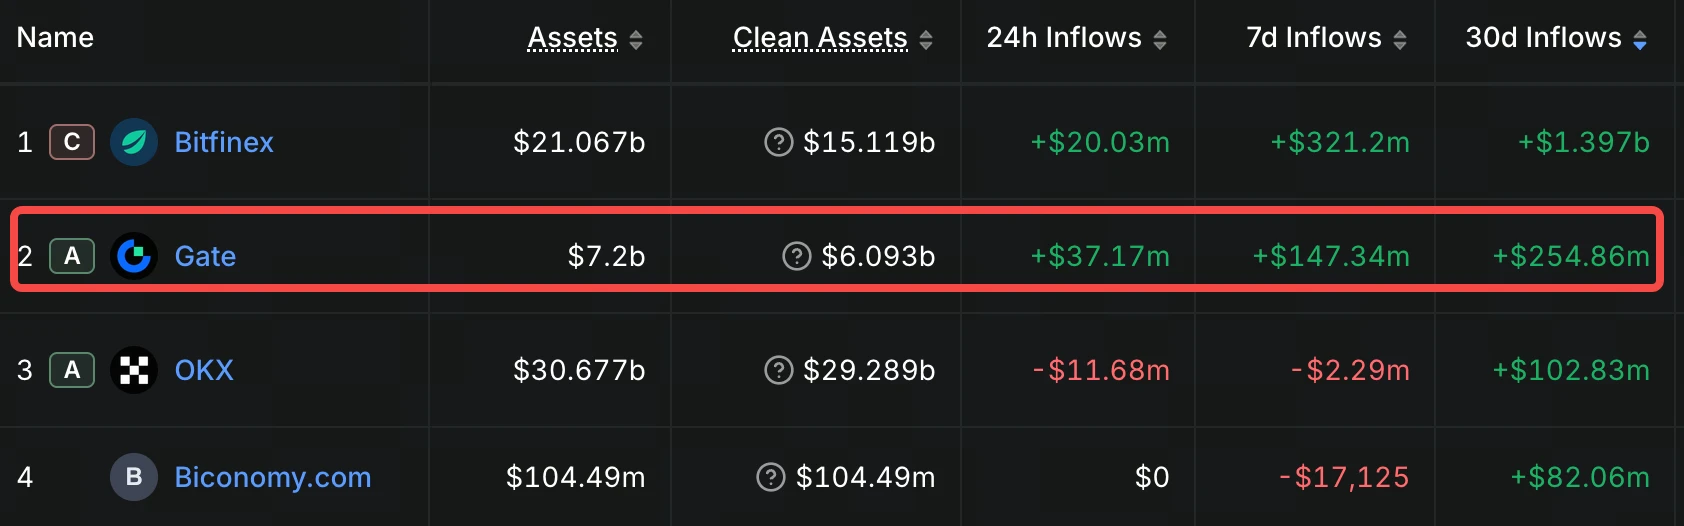
💰 Don’t just look at one day: Gate ranks second globally in net inflows over the past 30 days
Markets change every day, but when you look at a 30-day period, fund flows are more noteworthy.
According to Odaily, citing DefiLlama data, Gate saw net inflows of over $199 million in the past 30 days, ranking second among centralized exchanges globally. 🏆
From short-term inflows to ranking among the top exchanges for monthly net inflows, Gate’s active performance in global trading markets continues to draw attention.
Fund flows are one set of data; the trading demand and market choices behind them
GateSquare
💰 Don’t just look at one day: Gate ranks second globally in net inflows over the past 30 days
Markets change every day, but when you look at a 30-day period, fund flows are more noteworthy.
According to Odaily, citing DefiLlama data, Gate saw net inflows of over $199 million in the past 30 days, ranking second among centralized exchanges globally. 🏆
From short-term inflows to ranking among the top exchanges for monthly net inflows, Gate’s active performance in global trading markets continues to draw attention.
Fund flows are one set of data; the trading demand and market choices behind them are even more worth discussing.
💬 What do you think is key to driving sustained inflows to an exchange? Liquidity, trading opportunities, or an ever-expanding product ecosystem?
Bring #Gate30日净流入全球第二 to Gate Square to share your market observations, fund allocation ideas, and trading experience.
📖 Odaily reports:
https://www.odaily.news/zh-CN/newsflash/525820
repost-content-media
Yesterday, the INTC long position entered at 90.5 moved above the second target price of 95.5. $INTC ‌
post-image
INTC+5.10%
$BTC BTC/USDT 4-hour, 1-hour, 15-minute and 5-minute candlestick charts; the current price is near 83,000 USDT. Overall, the price has broken above the previous downtrend line (see the orange trendline) and is facing short-term resistance near 83,400.
Based on Bollinger Bands (BOLL) and support/resistance levels across different timeframes, here are key reference levels for long positions (buying dips in the direction of the trend) and short positions (selling high to play a pullback):
I. Key Support and Resistance Levels
* Strong resistance (overhead pressure): 83,400 - 83,500 USDT (recent
BTC+1.86%
🔍 Market conditions change in an instant. What really matters is understanding what the market is trading!
Hot sectors rotate, capital flows shift, macro news breaks... Behind every market move is market logic worth paying attention to.
📊 Gate Live’s professional analysts provide real-time market analysis, from market trends to popular narratives, breaking down key trading signals to help you make sense of the market faster.
Chase rallies less and avoid panic-selling; trust your own judgment more!
👉 Tune in to Gate Live: https://www.gate.com/live
post-image
  • 2
I've never seen anyone look for a job like this before.
post-image
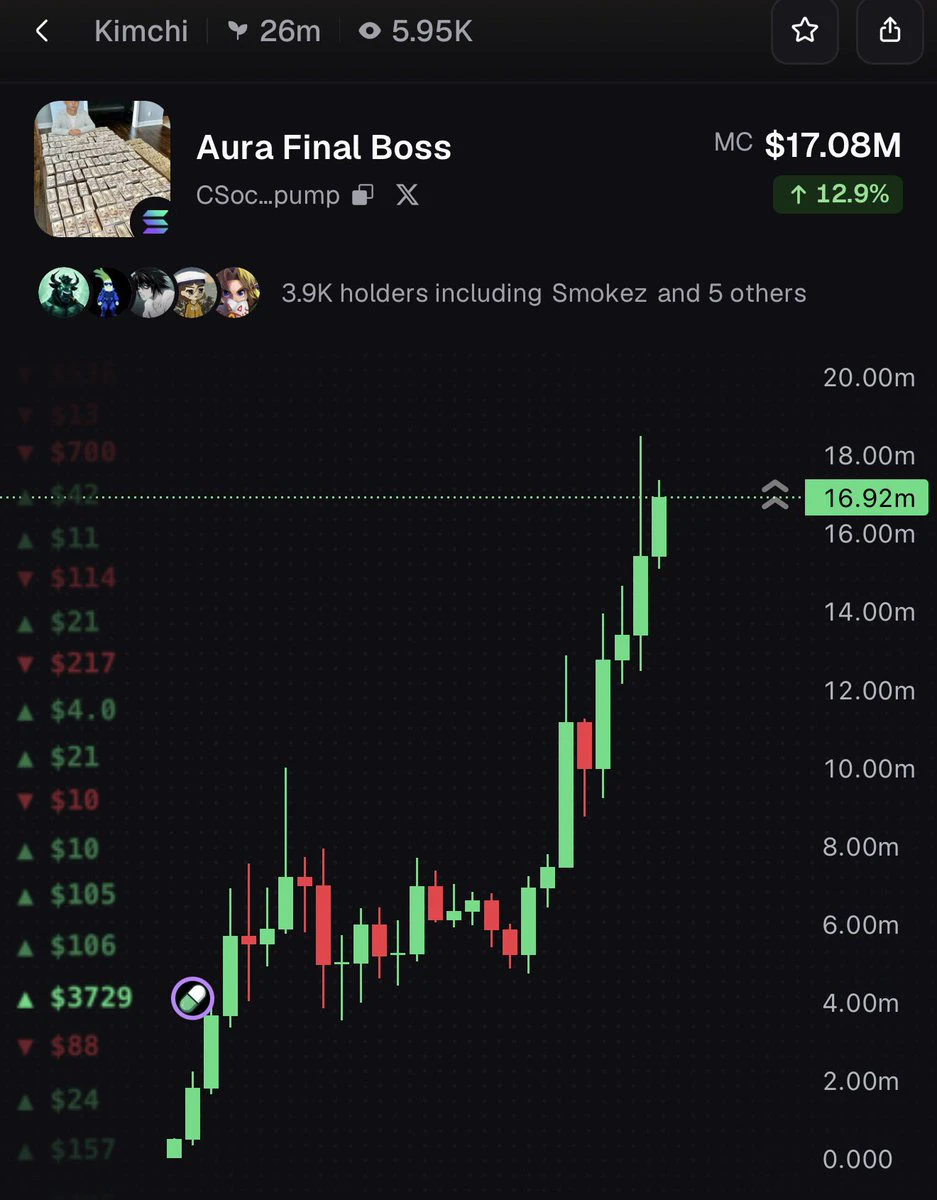
A @kimchi1x coin just spawned and is currently at $17m
Crazy work.
post-image
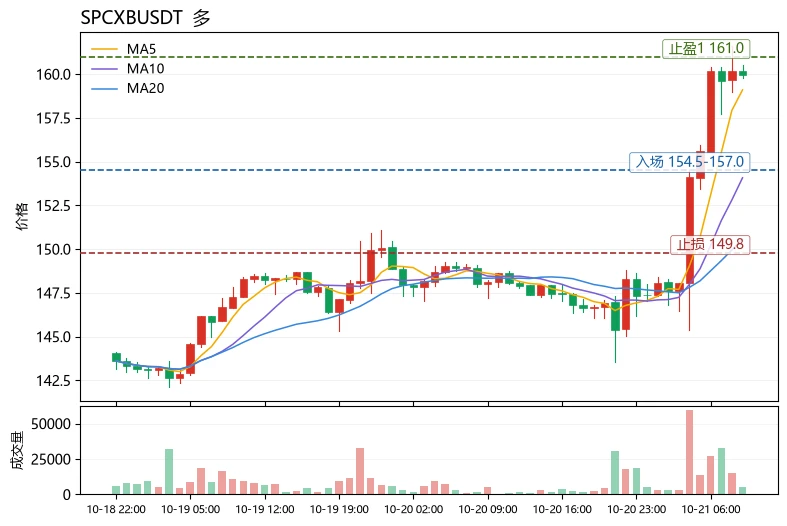
$SPCXB Key levels: resistance above at 161.07 (upper Bollinger Band), support below at 150.58 (MA20); the current price of 159.95 is close to the upper band and about 6% above support.
Structurally, MA5 has crossed above MA20 and the MACD histogram remains bullish at +1.423, but RSI at 79.1 is in overbought territory. The range across 30 candles is about 11.3%, indicating elevated volatility, while the Fear and Greed Index at 63 (Greed) signals overheated sentiment. Chasing longs at this level offers poor risk-reward. A more sensible approach is to wait for a pullback and manage position size,
post-image
#TeslaQ3Earnings #ShareWeekly
Tesla Q3 Earnings: The Real Test for $TSLA Is Profitability, Cash Flow and Robotaxi Execution
Tesla's Q3 2026 earnings report arrives on October 21, and I believe the biggest question is not simply whether the company beats expectations. The real question is whether Tesla can convert vehicle deliveries, energy growth and AI ambitions into sustainable profitability.
My view is cautiously neutral before the results. Strong deliveries offer encouragement, but margins, cash flow and management guidance will determine whether the next move in $TSLA is sustainable.
1.
TSLA+1.55%
  • 1
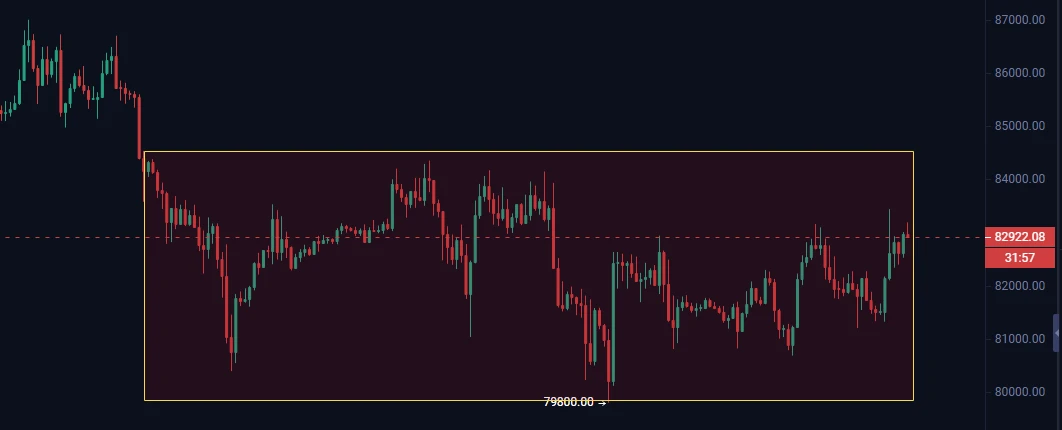
Starting at 6, I’ve been watching the price action. Bitcoin is moving in a very indecisive way—that’s exactly what a choppy market feels like, and it’s normal.
Recently, I haven’t been able to tell whether Bitcoin will plunge. It held 798, but I also can’t tell whether it’ll surge to 930, since it has been unable to break 845. I correctly predicted the previous few directional moves and made a little pocket money. Now I can only trade the range, taking small short-term swings to cover living expenses.
We’re now in a wait-and-see phase: either a big drop to around 750 or a rise to around 930. T
post-image
BTC+1.68%
🔥 $CVX is breaking out strongly, with a powerful bullish candlestick and a noticeable increase in trading volume. Buyers are actively entering the market, pushing the price above the upper boundary of the recent consolidation range. If bullish momentum continues and the breakout holds, CVX may continue to rise and test the next resistance level. 🚀Take profit: 3.528 Stop loss: 2.119 Long $CVX 👇
post-image
CVX+17.02%
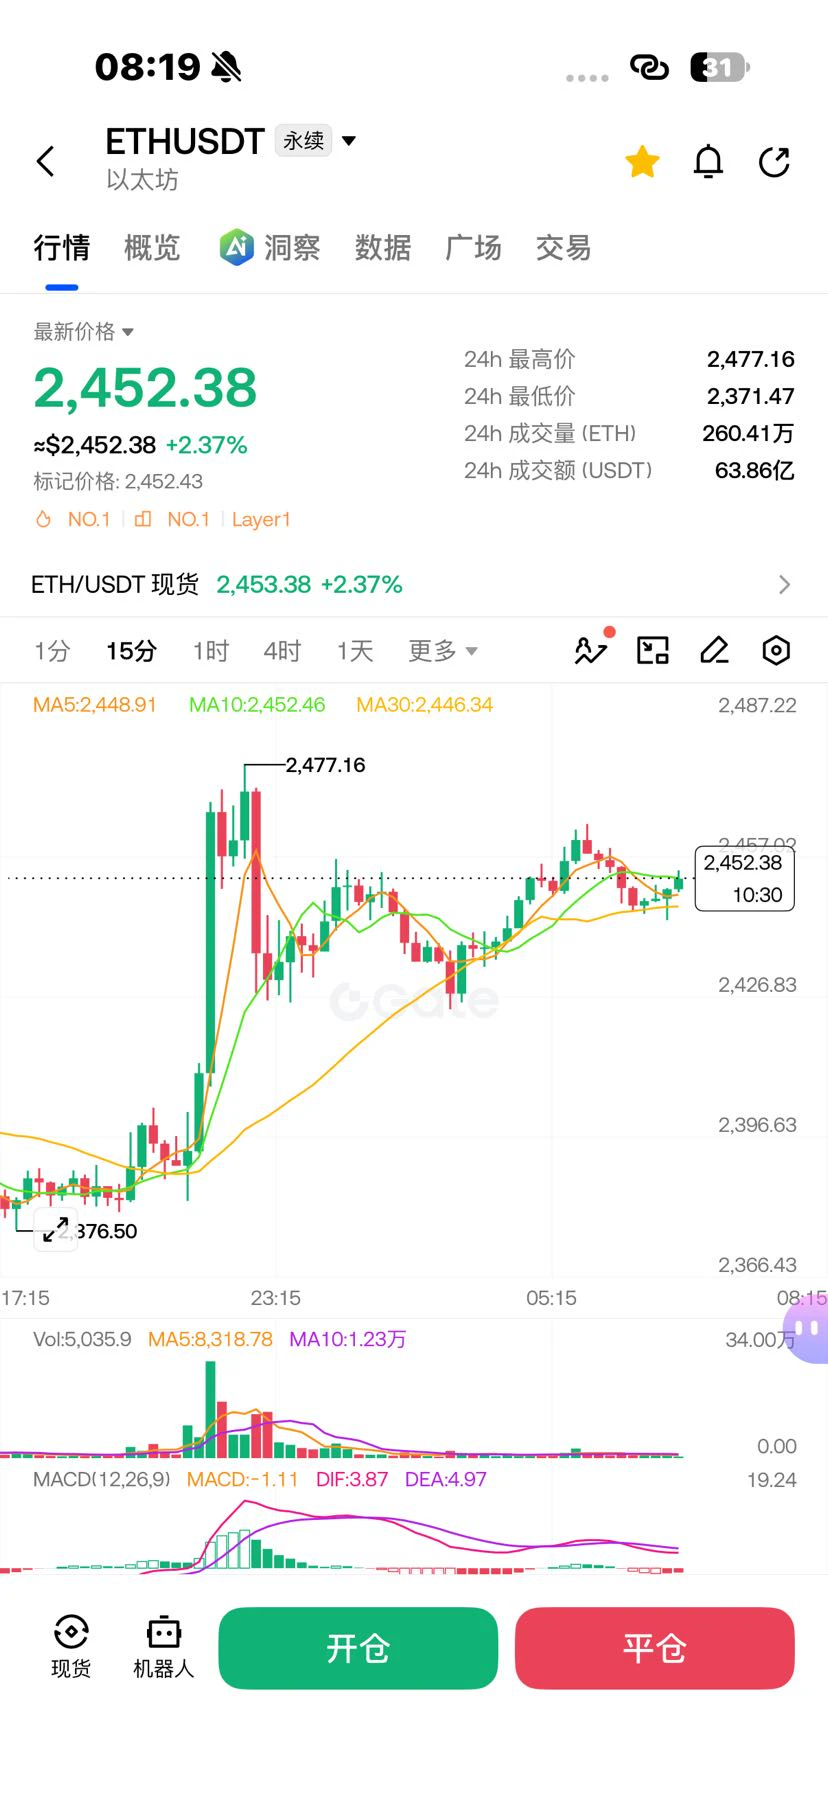
Ethereum is currently seeing low-volume, narrow-range fluctuations. A genuine trend still needs catalysts from U.S. stocks and news, so simply sell the highs and buy the lows intraday
post-image
ETH+2.65%
Layout: Bitcoin, Ethereum, Dogecoin
live-cover
LIVE1,464
  • 1
$Q Brother Zhuang, I'm not greedy; just let me make enough for a meal
post-image
Q-4.31%
  • 3
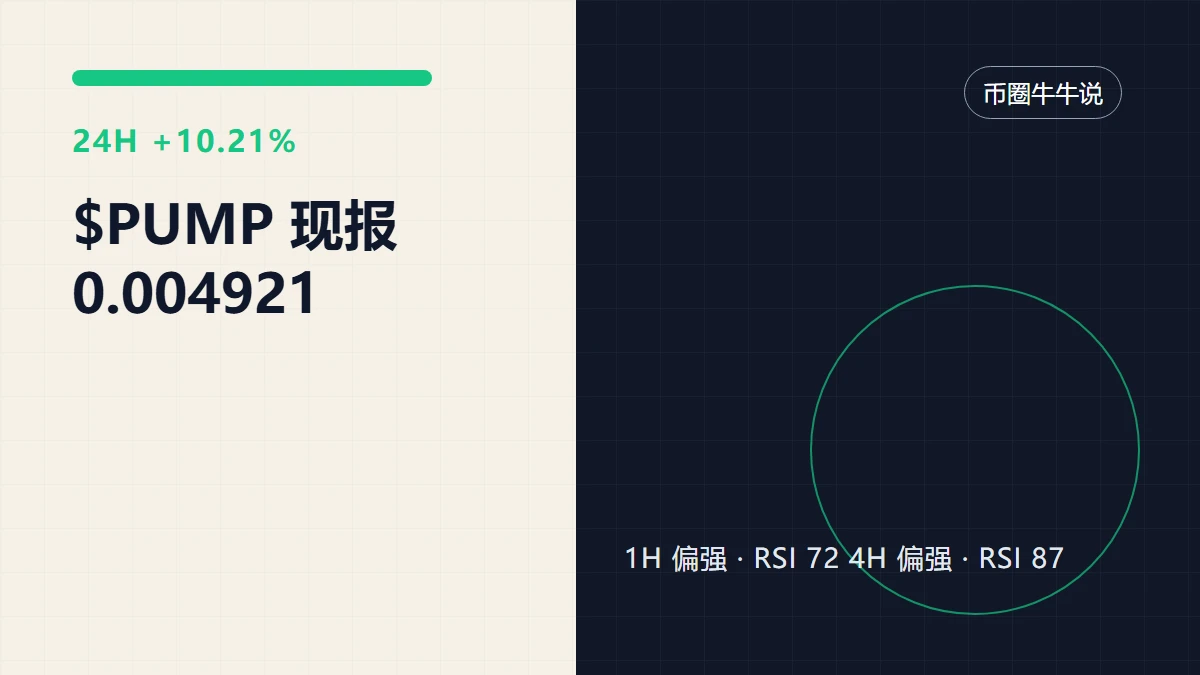
$PUMP rose from 0.004329 to 0.004921, a gain of 10.21%. The 1-hour chart shows price strength, but trading participation is only 1.11x. This makes me more inclined to believe this breakout may be just a short-lived technical rebound rather than a trend-driven rally. On the 1-hour chart, the price is already approaching resistance at 0.004976, but trading volume has not picked up noticeably, meaning this move could quickly lose momentum.
The opportunity really worth watching is either a hold above 0.004976 with continued buying support, or a quick recovery after a pullback to 0.004329.
Do you h
post-image
PUMP+9.97%
Load More

Join 40 M users in our growing community

⚡️ Join 40 M users in the crypto craze discussion

💬 Engage with your favorite top creators

👍 See what interests you

Trending Topics

GateRanks2ndIn30DayNetInflows

6.18k Views791 Discussing

According to DefiLlama, Gate recorded over $199 million in net inflow over the past 30 days, ranking second among global centralized exchanges. Capital keeps flowing in — what's your strategy? [👉 Read more](https://www.odaily.news/en/newsflash/525820)

GateIdleFundsSurpass$300M

9.36k Views1.49k Discussing

TeslaQ3EarningsPreview

3.8k Views239 Discussing

View More