





Share your thoughts
placeholder
Article
Many people see “waiting on the sidelines” as passive, as if doing nothing means wasting time. But if you think about it carefully, when you have some idle stablecoins, your goal should be threefold: maintain liquidity, remain patient, and keep your funds working while you wait.
My own approach is to divide my stablecoins into two parts. One part remains readily available at all times as reserve funds for entering positions and emergencies; the other goes into simple and flexible yield-earning products that can be redeemed quickly when needed, so waiting is no longer a zero-yield decision.
Gat
post-image
USDC-0.05%
GUSD+0.01%
  • 13
$HYPE and $PURR in price discovery is quite the barbell
HYPE+10.05%
PURR+6.38%
Where are the long-term bullish holders!
Since the end of August, we have remained firmly bullish on the market outlook, holding all the way until today. Our positions have stayed firmly in place and were not shaken out during the interim volatility.
The long-term logic behind this move is actually very clear: during the pullback at the end of August, after the price retested a key support level, there were clear signs of funds accumulating at the bottom. Trading volume gradually increased, forming a solid base structure. We judged that this was a phased bottoming area and decisively opened lo
post-image
BLSH+9.56%
  • 1
$BTC Signal】Go long + 1H volume expansion breaks through the upper Bollinger Band
$BTC The 1H price broke through the upper Bollinger Band at 80481, with the current price at 80883 hovering outside the band. 1H RSI is 86.25 and 4H RSI is 77.82, showing flattening in the overbought zone as buyers continue pushing prices higher.
The 4H MACD histogram expanded to 431.6, with the fast and slow lines moving upward in sync. The order book bid-ask depth ratio is 10.06, with an 81.91% imbalance. Buy orders below are extremely dense, and selling pressure is being quickly absorbed.
The funding rate is
post-image
BTC+5.13%
Placing limit orders to precisely target the low and enter at the lowest point—this is the power of SMC😄#XAU
XAU+0.81%
【$G Signal】Long + 1H/4H momentum expansion
$G 4H RSI 95, 1H RSI 82, current price 0.009405 is hugging the 1H Bollinger upper band at 0.0094. The MACD 4H/1H histogram continues to expand, with bullish capital actively pushing the price higher. Order book depth imbalance is 5.54%, Bid/Ask is 1.12, and bids continue to stack below. Funding rate is 0.0817%, OI is stable, and the short-squeeze impetus is limited. The risk-reward ratio at the current price is 1.5, while the stop-loss distance is relatively large. Take a small position for a targeted entry and do not hold through losses.
🎯Direction:
post-image
$AKE To put it bluntly, you can only pray that when you're short, there are people going long—and that you can survive to the end.
post-image
AKE+53.34%
  • 1
Why Did Tech Rally While the Fed Raised Rates?
The Fed raised rates, and tech stocks still rallied.
Every textbook says the opposite should happen.
The explanation comes down to one thing: the gap between what the market had priced in and what it actually got.
On 16 September, the Fed raised its policy rate by 25 basis points to 3.75–4.00%. The decision was unanimous at 12–0 and marked the first hike since 2023. Projections point to one more increase before year-end. August CPI came in at 3.4% year on year with core inflation at 2.4%, and nonfarm payrolls beat expectations at +162,000. The mac
post-image
xxx40xxx
One Day, +14.9%: Is This a Turn, or Just a Bounce?
One stock jumped 14.9% in a single session.
Most of the market read it as the return of the AI rally.
But the central bank raised rates the same week — so where did the buying really come from?
On Thursday, 17 September 2026, all three major US indices closed higher. The Nasdaq Composite gained 1.7% to 26,418.30, the S&P 500 added 1.1% to 7,637.76, and the Dow Jones rose 0.6% to 51,778.04. The day belonged to AI names: Tempus AI (TEM) climbed 14.9%, Super Micro Computer (SMCI) 9.5%, Astera Labs (ALAB) 9.0% and Arm Holdings (ARM) 8.5%. The semiconductor index added 3.1%.
Step back, though, and the numbers tell a different story. Over the full week the Nasdaq was up just 0.3%, while the Dow was down 1.5%. What we have is not a trend change but a powerful one-day surge.
The reason is that each of the four stocks carried its own company news: a growth message from Tempus AI management at a healthcare conference, record order intake at Super Micro, a new memory controller from Astera Labs, and a data-centre chip target at Arm.
The takeaway is blunt: headlines amplify moves, data supplies context. In Web3, analysts who read on-chain liquidity before the headline apply exactly the same discipline here.
So are these four really part of one story? The answer is more uncomfortable than it looks — Article 2 goes straight at it.
This content is not investment advice. Always perform your own research before making financial decisions.
$BTC $GT $ETH
#Gate广场中秋团圆局 #美股AI概念股全线反弹 #USAIConceptStocksRally #JapanRealEstatePowerChipStocksRise #GateSquareMidAutumnReunion
repost-content-media
UBS-0.21%
  • 1
AI Stocks Face New Rate Pressure, Could Nvidia Demand Keep Technology Markets Supported?
live-cover
LIVE1,174
🔥 Bitcoin is back above $81K, and the interesting part isn’t just the number.
Nearly $150B has been added to the total crypto market during the move, but I think the bigger story is what’s happening around U.S. crypto regulation.
The CFTC has now sent its crypto market-structure rulemaking to the White House for review. That doesn’t mean new rules are already in effect, but it does show regulators are continuing to move forward even after the broader crypto bill stalled in the Senate.
And the market clearly noticed. $BTC pushed above $80K today, reaching around $80.6K in morning trading, whi
post-image
BTC+5.14%
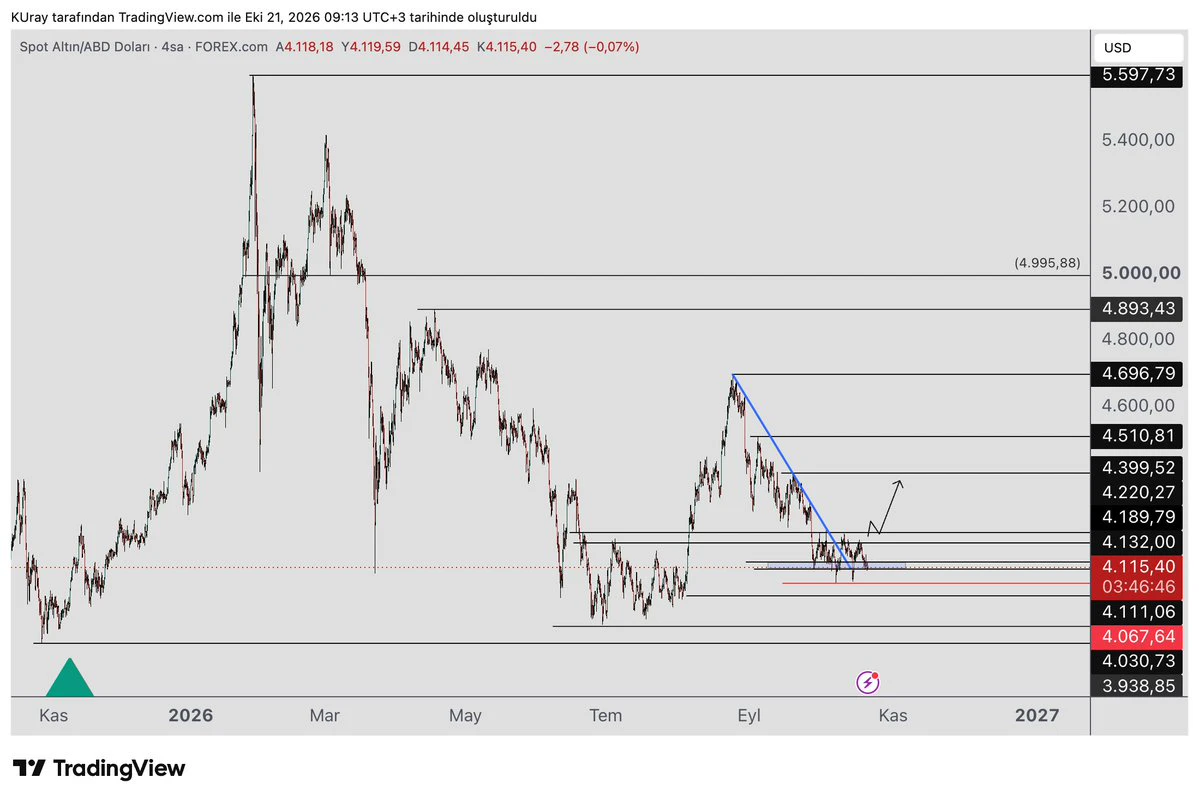
my Bias for $XAU for the coming week
4hr candle rejection at 4420..30.levels sells are valid ,Target 4260..4220
Body close above 4430 buys continue, target 4560..4580 fvg on the 4hr Timeframe
Nfa
XAU+0.81%
$BTC Taking off🛫🛫🛫🛫🛫🛫🛫🛫🛫🛫🛫🛫🛫🛫🛫🛫🛫🛫🛫🛫🛫🛫🛫🛫🛫🛫🛫🛫🛫🛫🛫🛫🛫🛫🛫🛫🛫🛫🛫🛫🛫🛫🛫🛫🛫🛫🛫🛫🛫🛫🛫🛫🛫🛫🛫🛫🛫🛫🛫🛫🛫🛫🛫🛫🛫🛫🛫🛫🛫🛫🛫🛫
BTC+5.14%
What was once a feast for the bears on Black Friday has dealt them a heavy blow today. The day session rose from 762 to an evening high of 812, giving the bears no chance to catch their breath.
From a technical perspective, BTC and ETH still have further room to rise this evening. After such a substantial rally, signs of a pullback remain relatively weak. On the daily chart, a large bullish candle has firmly held the middle Bollinger Band, changing the previous overall trend. On the short-term four-hour and 15-minute charts, the Bollinger Bands have all opened upward, with both the upper and l
post-image
BTC+5.14%
ETH+4.97%
$SOL is showing strong 4H momentum after a clean reaction from the $96–$99 demand zone. 👀
Price has reclaimed $106 and pushed through the previous $110 resistance, confirming a strong short-term structure shift.
Key levels I’m watching: • Hold above $110 → $114–$116 comes into focus
• Lose $106 → momentum starts to weaken
• $96–$99 remains the major support zone
After such a sharp move, I’d rather watch for a successful retest than chase the candle.
Bullish: while $110 holds.
$SOL #Solana #SOL #Crypto #SOLAnalysis
SOL+10.36%
  • 3
  • 1
$SHIB Current price 5.46e-06, 24h +5.61%, with trading volume of only 6.6M USDT. MA5 has crossed above MA20, RSI 68.1 is nearing overbought, the MACD histogram at +1.349e-09 remains bullish, and the Bollinger upper band at 5.54622e-06 is within reach. The 30-candle price range is 8.79%. The Fear and Greed Index is 56, in the greed zone. Assessment: Short-term bias is bullish, but the risk of chasing highs is high. Volume is insufficient to support an effective breakout, so consolidation after resistance at the upper band is more likely.
In terms of position management, entering with a full po
post-image
SHIB+5.40%
DOT+6.12%
Smart money is fading the daily breakout on $UNI /USDT right now.

$UNI /USDT - SHORT

Trade Plan:
Entry: 8.859 – 9.007
SL: 9.855
TP1: 8.242
TP2: 7.781
TP3: 7.089

Why this setup?
Why now? The 1h price is holding at 8.934 while the 15m RSI reads 57.46, showing momentum is neutral enough to let the short breathe. With the 1h ATR at 0.295512, the 8.859 to 9.007 entry zone gives a clean trigger for a move toward TP1 at 8.242. If that breaks, TP2 at 7.781 becomes the next target, but the daily trend remains bullish, making this a fading play against the higher-timeframe structure. The invalidat
UNI+14.97%
Market prediction
live-cover
LIVE1,749
LEVERAGE
(I'm not talking about futures lol)
post-image
$ZK easy 3-4x... probably more.
post-image
ZK+12.81%
#每周来晒 #Where to Put Idle Funds When the Market Direction Is Unclear
Bull or bear market uncertain, I had some stablecoins on hand but never knew where to put them, so they just sat there. Later, I saw people in the community sharing their allocation ideas, and decided to organize my own plan as well.
First, my situation: I have around 5,000 USDT—not a lot, but I don't want it sitting idle. A 10,000 USDT allocation plan was widely discussed in the community, with the core idea being to “give every dollar a clear purpose”—some funds ready for immediate use, some earning steady returns, and some
post-image
GUSD+0.01%
BTC+5.14%
  • 6
Load More

Join 40 M users in our growing community

⚡️ Join 40 M users in the crypto craze discussion

💬 Engage with your favorite top creators

👍 See what interests you

Trending Topics

JapanRealEstatePowerChipStocksRise

58.46k Views3.49k Discussing

Japan's Nikkei extended gains on Sept 18, with real estate, power, and semiconductor sectors leading. Gate covers over 12,800 global stocks and ETFs, offering one-stop USDT trading across US, HK, Korean, and Japanese markets. [👉 Read more](https://www.odaily.news/en/newsflash/518749)

USAIConceptStocksRally

33.34k Views449 Discussing

GateTopsStockPerpetualCoverage

37.51k Views2.3k Discussing

View More