
Share crypto content and earn up to 60% commissions through content mining.
placeholder
gatefun
9.3 ETH Analysis
ETH's one-hour chart saw a strong bullish rebound, with the price moving upward to test above the Bollinger middle band and short-term bullish sentiment quickly recovering. The upper Bollinger band at 2410 is strong short-term resistance, while the middle band at 2389 provides the first support and the lower band at 2368 is an important defensive level. RSI has rapidly surged close to the overbought zone, indicating that short-term upward momentum has been released quickly and that a pullback may be needed. The MACD has formed a low-level golden cross, with the red bars expand
BTC0.43%
GT1.76%
View Original
post-image
  • Reward
  • Comment
  • Repost
  • Share
applied to the snarklist.
record 7838 · shielded by default
@zksnarks_
post-image
  • Reward
  • Comment
  • Repost
  • Share
#NvidiaMarketCapBackAbove5.4T Here’s a more natural, human-style closing:
#NvidiaMarketCapBackAbove5.4T is putting NVIDIA back in the spotlight as the company’s market value climbs above the $5.4 trillion mark. This move highlights the continued strength of investor interest in artificial intelligence, advanced computing, and the growing demand for high-performance technology.
NVIDIA has become one of the most closely watched names in the technology market, with its chips and platforms playing an important role in the development of modern AI systems. As businesses continue investing in data c
NVDA3.15%
post-image
post-image
  • Reward
  • Comment
  • Repost
  • Share
BTC spot ETFs saw a $101M net inflow yesterday, led by BlackRock’s IBIT; Ethereum ETFs meanwhile net outflowed $48.2M with ETHB guiding the tilt. $BTC $ETH
post-image
  • Reward
  • Comment
  • Repost
  • Share
The U.S. stock market does not have a single index that covers all listed companies; instead, the “three major U.S. stock indexes” or “four major indexes” are used together to represent overall market performance. The main representative indexes of the U.S. stock market are the S&P 500 Index: covering the 500 largest publicly listed U.S. companies and accounting for approximately 80% of the total U.S. stock market capitalization, it is most commonly used as the true benchmark for the U.S. stock market. The Dow Jones Industrial Average (Dow Jones): composed of 30 large U.S. blue-chip companies,
SPX5000.69%
US20000.37%
View Original
post-image
  • Reward
  • Comment
  • Repost
  • Share
btc faces key resistence can btc break higher?
gate liveLIVE
1,082
live-coin
  • Reward
  • 8
  • Repost
  • Share
GateUser-fc1a8b18:
Ape In 🚀
View More
🏅Every Monday through Friday at 8 PM: VIP subscription exclusive trade signals during the U.S. market session. If you don’t profit from copy trading, your full subscription fee will be refunded. Proven track record—trust me and prosper!
View Original
post-image
post-image
post-image
  • Reward
  • Comment
  • Repost
  • Share
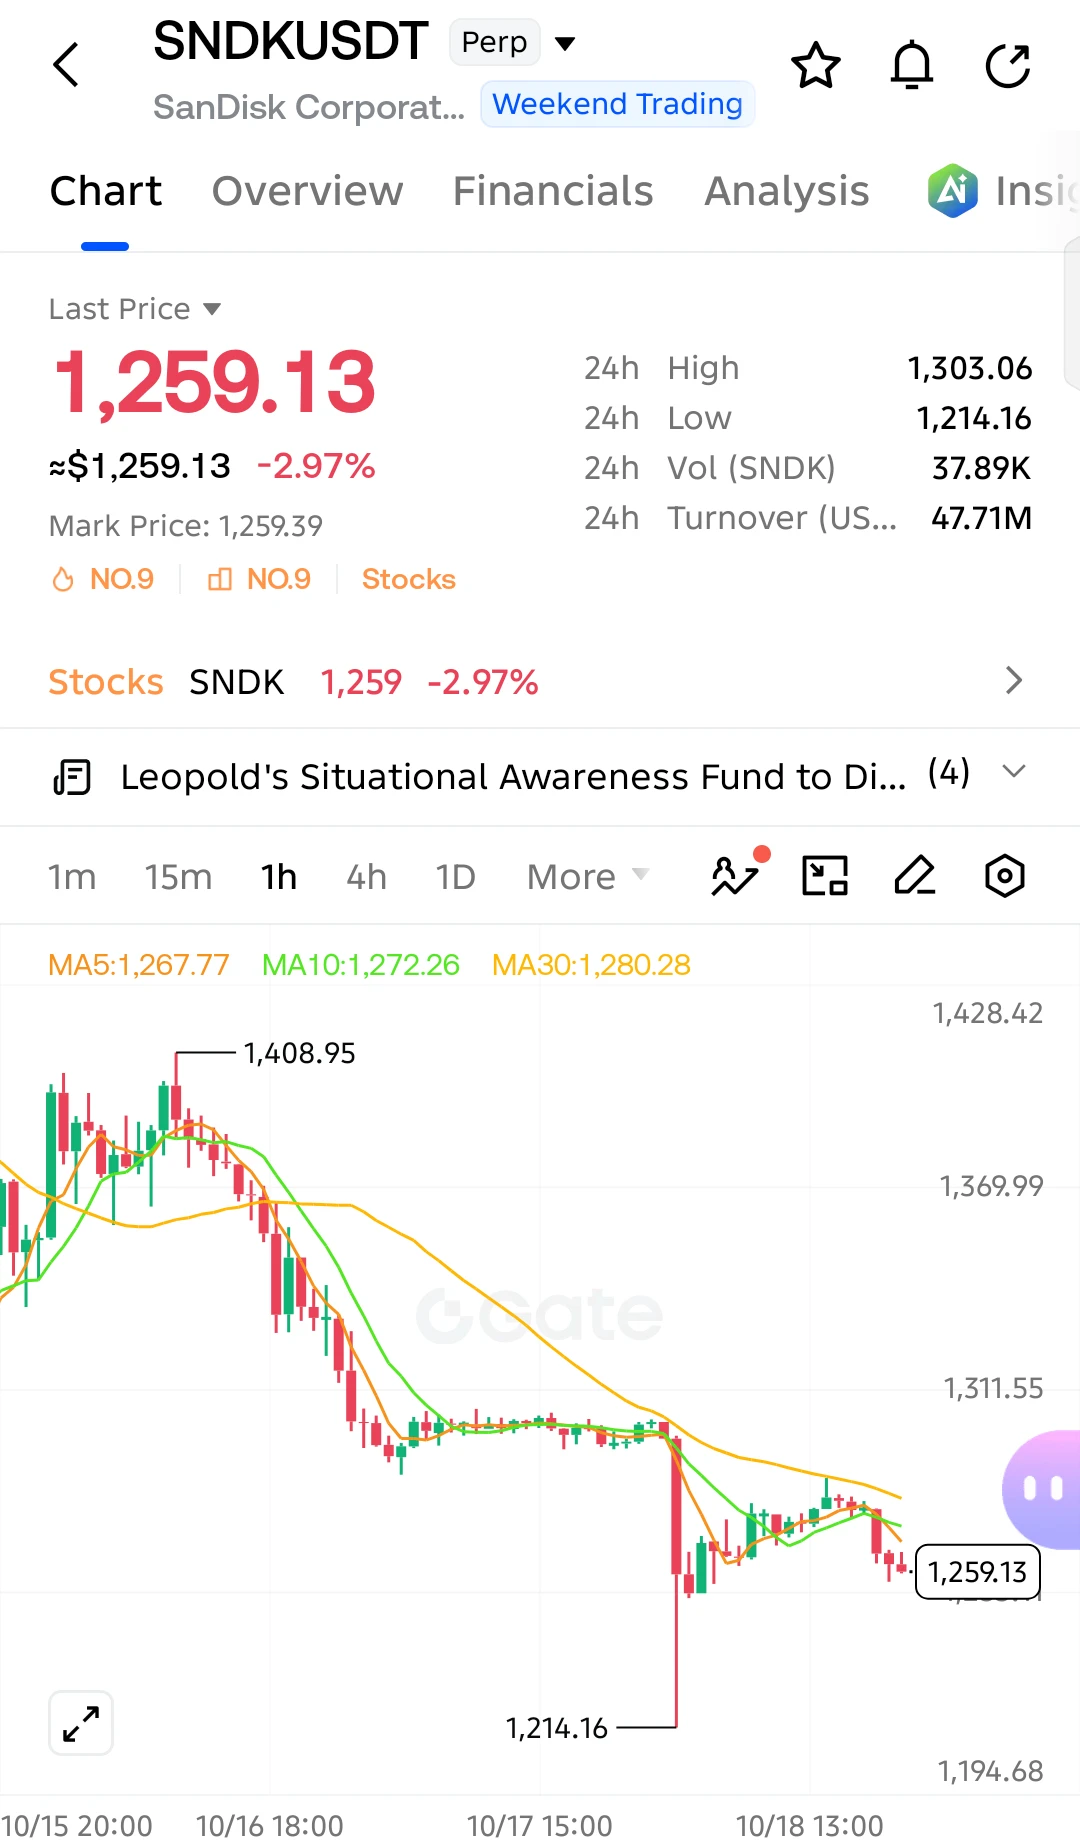
I originally wanted to cut my losses as an offering to the heavens, but the ritual never happened—the meat roasted itself. When I opened the chart this morning and saw $CYS still stubbornly holding on, I knew it was time to act. The rebound was weak, resistance above was obvious, and volume never managed to keep up. This kind of situation cannot last too long.

I decisively placed a short at 0.4651. Just took another look: 0.3222, +304.51%. Enough for a good meal. I’m almost tempted to praise myself for timing this move so well.

As for the position, 70% has already been taken off for profit
CYS-14.08%
BTC0.44%
SNDK1.42%
View Original
post-image
  • Reward
  • Comment
  • Repost
  • Share
☀️ GM! BTC and ETH have both made it to the crossroads,
but the traffic light still can’t decide who gets to go.
Bulls: 🟢?
Bears: 🔴?
Market: 🟡 Maybe wait a little longer.
Friday’s data is still on the way — let’s see which direction the market picks today.
👇 Are you jumping in, staying on the sidelines, or going back to sleep with ETH?
BTC0.43%
ETH-0.24%
post-image
post-image
Gate_Square
☀️ GM! BTC and ETH have both made it to the crossroads,
but the traffic light still can’t decide who gets to go.
Bulls: 🟢?
Bears: 🔴?
Market: 🟡 Maybe wait a little longer.
Friday’s data is still on the way — let’s see which direction the market picks today.
👇 Are you jumping in, staying on the sidelines, or going back to sleep with ETH?
repost-content-media
  • Reward
  • 2
  • Repost
  • Share
User_any:
GM ☀️🙋
View More
#NvidiaMarketCapBackAbove5.4T
Nvidia, the leader in AI chips, has once again surpassed the $5.4 trillion mark in market capitalization following record-breaking financial results in the second quarter of fiscal year 2027. The company increased its total revenue by 106% year-over-year to $96.2 billion, exceeding expectations once again with $89.0 billion in revenue from its data center segment. Company Founder and CEO Jensen Huang highlighted the transformation of computing capacity into a direct revenue stream, referring to the commercialization of generative AI applications. Continuing its g
NVDA3.15%
post-image
post-image
User_any
#NvidiaMarketCapBackAbove5.4T
Nvidia Is Back Above $5.4 Trillion: This Is No Longer a Stock, It's the Gravity of the S&P 500
One company is now 8% of the S&P 500. Nvidia touched $5.52 trillion intraday yesterday, becoming the first company in history to breach the $5.5T mark.
While everyone was watching Dell on Tuesday, the real show came at the close.
Nvidia shares rose 1.2% to $223.50, pushing its market capitalization back above $5.4 trillion. At its session high, it hit $5.52 trillion — the first time any public company has ever traded above $5.5 trillion. This is not just a record. It is a distortion in the math of the entire market.
Just a day before, with a $5.2 trillion market cap, Nvidia already accounted for roughly 8% of the entire S&P 500 valuation.
The 3 Thresholds That Explain $5.4 Trillion
This is not driven by a single earnings beat. It is driven by three psychological barriers breaking at once:
1. The $5 Trillion Ghost Is Gone. On October 29, Nvidia became the first company ever to cross $5 trillion. It then lost over $300 billion in value in a two-day chip selloff, dropping 6%. This week it reclaimed its 50-day moving average and erased that entire loss, closing above $5 trillion for the 33rd time this year.
2. It Added $441.5 Billion in a Single Day. Last Thursday, Nvidia surged 8.7% in one session, adding $441.5 billion to its market cap — the largest one-day gain in its own history and the second-largest for any company ever. That one-day addition is larger than the total value of 90% of S&P 500 companies.
3. It Re-took the Crown from Apple. On Monday, Apple briefly reclaimed the title of most valuable U.S. company with a $4.95 trillion market cap while Nvidia fell to $4.77 trillion. 24 hours later the tables turned again. Apple fell to $4.62 trillion, Nvidia jumped back to $5.09 trillion and then $5.4 trillion. The crown keeps switching, but the trend is clear.
What Is Fueling This Rally This Time?
Dell's story was "we can't deliver fast enough." Nvidia's story is "everyone has to buy from us."
Yesterday Dell reported it booked $60.9 billion in new AI server orders in a single quarter and ended with a record $95 billion backlog. Over 90% of those servers run on Nvidia Blackwell and Hopper GPUs. In other words, Dell's $95 billion delivery queue is actually a pre-payment for Nvidia's revenue for the next 3 quarters.
Nvidia itself is in a different league now. In Q2 it blew past Wall Street estimates, with the stock approaching its all-time high of $225. It is up 14% in 2026, but up 6% just this month while the SOX semiconductor index fell 11%. It is decoupling from its own sector.
Why China Plays a Different Game
In the U.S., the game is Blackwell. In China, due to export controls, it is a downgraded H20 and Huawei's Ascend 910B. Chinese cloud giants like Alibaba and Tencent have to buy more chips with lower performance density to build the same cluster.
This is not bad news for Nvidia. It sells more units, keeps its margin, and creates a parallel market where demand is even more desperate.
The Hidden Risk Behind $5.4 Trillion
When one company becomes 8% of the index, it stops being a stock and becomes the index itself.
Two risks no one talks about:
1. Concentration Risk: Passive funds that track the S&P 500 are forced to buy more Nvidia as it gets bigger. This creates a feedback loop. When it goes up, everything goes up. When it falls, it drags the market down.
2. The Expectation Gap: At $5.4 trillion, there is no room for a miss. A single weak quarter can erase $1 trillion, as we saw last week. The SOX dropping 11% while Nvidia rises 6% is a divergence that history says never lasts long.
Nvidia's return above $5.4 trillion is the clearest answer to those who thought AI infrastructure spending was cooling. It is not cooling. It is accelerating, and Nvidia is the toll booth for the entire buildout.
The first company to reach $10 trillion could arrive as early as 2028. Do you think it will be Nvidia? Let's discuss in the comments. $NVDA $NVDA ‌
  • Reward
  • 7
  • Repost
  • Share
YamahaBlue:
1000x VIbes 🤑
View More
【$T Signal】Bullish ambush: negative funding short squeeze + 4H momentum continuation
$T Funding rate -0.3528%, with selling pressure dominating the order book. The 4H long lower wick reclaimed 0.00498, with buying emerging at the lows. 1H MACD momentum is contracting, while the price has not broken below 0.0049. OI has shown no significant change, and short positions remain.
🎯Direction: Long
⚡Entry/limit order: 0.00496406 - 0.00497900
🛑Stop-loss: 0.00492921
🚀Target 1: 0.00505369
🚀Target 2: 0.00509103
🛡️Trade management:
- Execution strategy: After reaching Target 1, reduce the position by
DELL15.92%
SPYX0.60%
BTC0.43%
ETH-0.24%
SOL0.69%
View Original
post-image
  • Reward
  • Comment
  • Repost
  • Share
Thursday, September 3, 2026 BTC‑USDT Perpetual Contract Technical Analysis Strategy
Key Levels
Resistance: R1‑78500, R2‑79800, R3‑81200
Support: S1‑76800, S2‑76000, S3‑74800
Market Structure
The daily chart is consolidating within a high-level range, with the medium- to long-term bullish structure intact; the MACD red bars continue to contract, bullish momentum is weakening, and pullback pressure is rising. The 4-hour Bollinger Bands are narrowing amid choppy trading; the 1-hour range is 76800‑78500, awaiting a high-volume breakout to determine direction.
Plan A: Long on Breakout
Entry: After
BTC0.44%
View Original
post-image
  • Reward
  • Comment
  • Repost
  • Share
New trainee's Fan Cabin, Day 4, No. 1 Dan this week
4407-4417, 10-point range, Luodai 2916🔪
Don't cling to the tail end of a market move; exit decisively when the target is reached. Only by being content can one remain profitable.
#黄金
GLDX1.78%
PAXG2.81%
View Original
post-image
post-image
post-image
  • Reward
  • Comment
  • Repost
  • Share
Ethereum’s price pulled back from its previous high and saw a clear decline, dropping as low as 2355 before quickly rebounding and recovering the price through consecutive bullish candles
It is currently in a key resistance-testing phase following the rebound recovery, with the high approaching around 2420
Key levels:
Strong resistance above: 2420-2429-previous high
Secondary resistance: 2410-2415, recent rebound high
First support below: 2385-2390
Strong support: 2355-2360-previous low
This round is a technical rebound following clear panic selling, with the structure reclaiming the middle ba
ETH-0.25%
View Original
post-image
  • Reward
  • Comment
  • Repost
  • Share
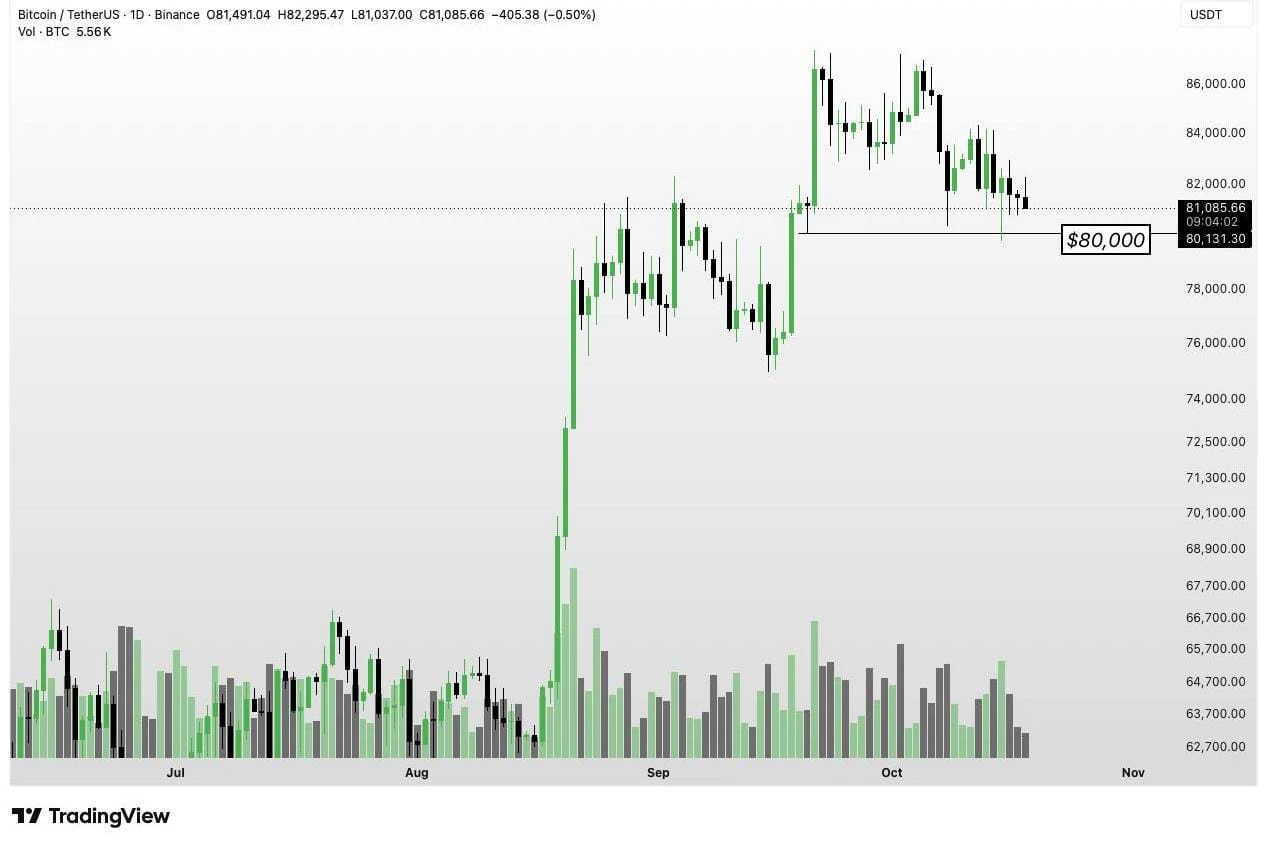
The September market is most widely expected to reach the 75,000 level; there are still considerable expectations of challenging 80,000; meanwhile, the probability of falling below 72,500 is over 50%, so the risk of a pullback cannot be ignored, with room for both bulls and bears to maneuver.
View Original
post-image
  • Reward
  • Comment
  • Repost
  • Share
Hey,
Good morning legend ☀️
Daily reminder:
Take care of your health, stay consistent with your work, and don’t forget to enjoy the small moments.
A productive day doesn’t need to be perfect. Just keep moving forward, one step at a time.
post-image
  • Reward
  • Comment
  • Repost
  • Share
#GateFuturesRegistersWithCFTCJoinsNFA
Gate Futures Takes Another Major Step Into the U.S. Regulated Markets
The evolution of crypto is entering a new phase — one where innovation, market access, and regulatory compliance increasingly need to move together.
On September 1, 2026, Gate Futures LLC, a wholly owned subsidiary of Gate US, completed its registration with the U.S. Commodity Futures Trading Commission (CFTC) as an Independent Introducing Broker (IB) and officially became a member of the National Futures Association (NFA).
This is a significant development for Gate’s U.S. expansion str
post-image
post-image
  • Reward
  • 2
  • Repost
  • Share
User_any:
To The Moon 🌕
View More
This move doesn’t even require me to think—the account is dancing on its own. While everyone was still waiting and watching, I already felt something was off. It had been ranging at the highs for so long, selling pressure was growing, yet trading volume kept shrinking. That wasn’t a good sign.

The intraday bottoming process made it even clearer: insufficient support, with no one buying when it moved up. This kind of price-volume divergence can’t hold for long. So I directly laid out a short setup around 0.009799, focusing on going with the trend.

Now look at 0.002953—isn’t this satisfying,
ADA4.68%
XRP1.60%
View Original
post-image
  • Reward
  • Comment
  • Repost
  • Share
JUST IN: US media reports Trump weighing an announcement to end the Iran war after private deliberations with senior aides. If true, the timing could shift geopolitical risk sentiment and impact crypto markets sensitive to energy/security headlines. $BTC $ETH
post-image
  • Reward
  • Comment
  • Repost
  • Share
Load More

Join 40 M users in our growing community

⚡️ Join 40 M users in the crypto craze discussion
💬 Engage with your favorite top creators
👍 See what interests you
  • Pinned