Square
Following
Hot
News
Notifications
Profile
Share your thoughts
placeholder
Article
THE MARKET MAY NOT HAVE A BITCOIN PROBLEM. IT MAY HAVE A LIQUIDITY PROBLEM.
Something bigger could be unfolding beneath the surface, and crypto might just be one of the first places where we're seeing it.
Think about it.
Bitcoin is breaking down. Altcoins are bleeding. Gold is under pressure. Tech stocks are struggling.
Different assets. Different narratives. Yet, they're all facing selling pressure.
I wouldn't dismiss this as just another crypto correction.
Look at what's happening beneath the surface:
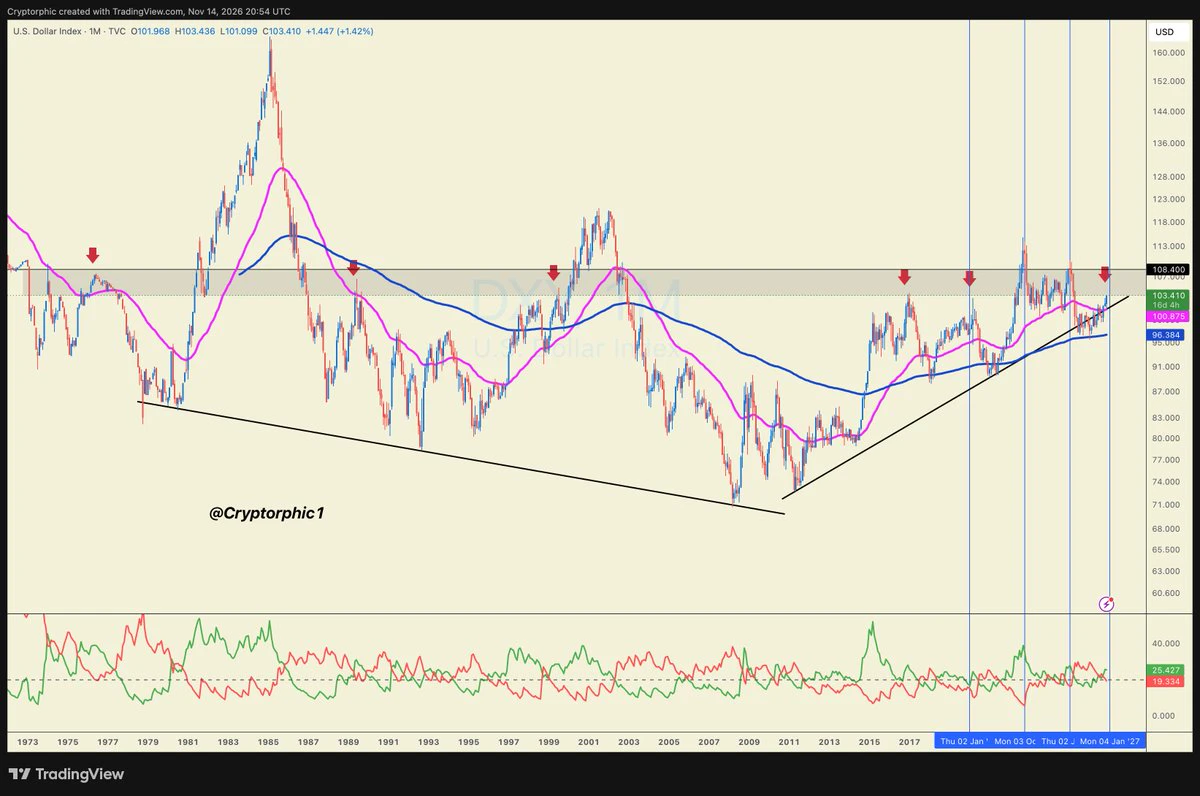
→ A stronger US Dollar is draining liquidity from risk assets.
→ Rising Treasury yields are
post-image
BTC-0.67%
XAU+0.38%
NDAQ-0.15%
What if $SOL next green candle liquidates more shorts than the drop liquidated longs?

RSI 21.6, everyone short, stop 6% away.
That's a squeeze waiting for a reason.

Team Trend or Team Squeeze? 👇
$SOL ‌$BTC ‌
SOL-0.74%
BTC-0.65%
Trenches
mihao
m
bade
b
mihao
4Cxj...pump
Market Cap
$.
Change
.
24h Vol
$.
Holders
.
Snoopy
S
bade
b
Snoopy
7mEh...47Cn
Market Cap
$.
Change
.
24h Vol
$.
Holders
.
NIO
N
bade
b
NIO
7SL2...pump
Market Cap
$.
Change
.
24h Vol
$.
Holders
.
AGT
A
bade
b
AGT
0x5d...e274
Market Cap
$.
Change
.
24h Vol
$.
Holders
.
SWJ
S
bade
b
SWJ
BDDd...pump
Market Cap
$.
Change
.
24h Vol
$.
Holders
.
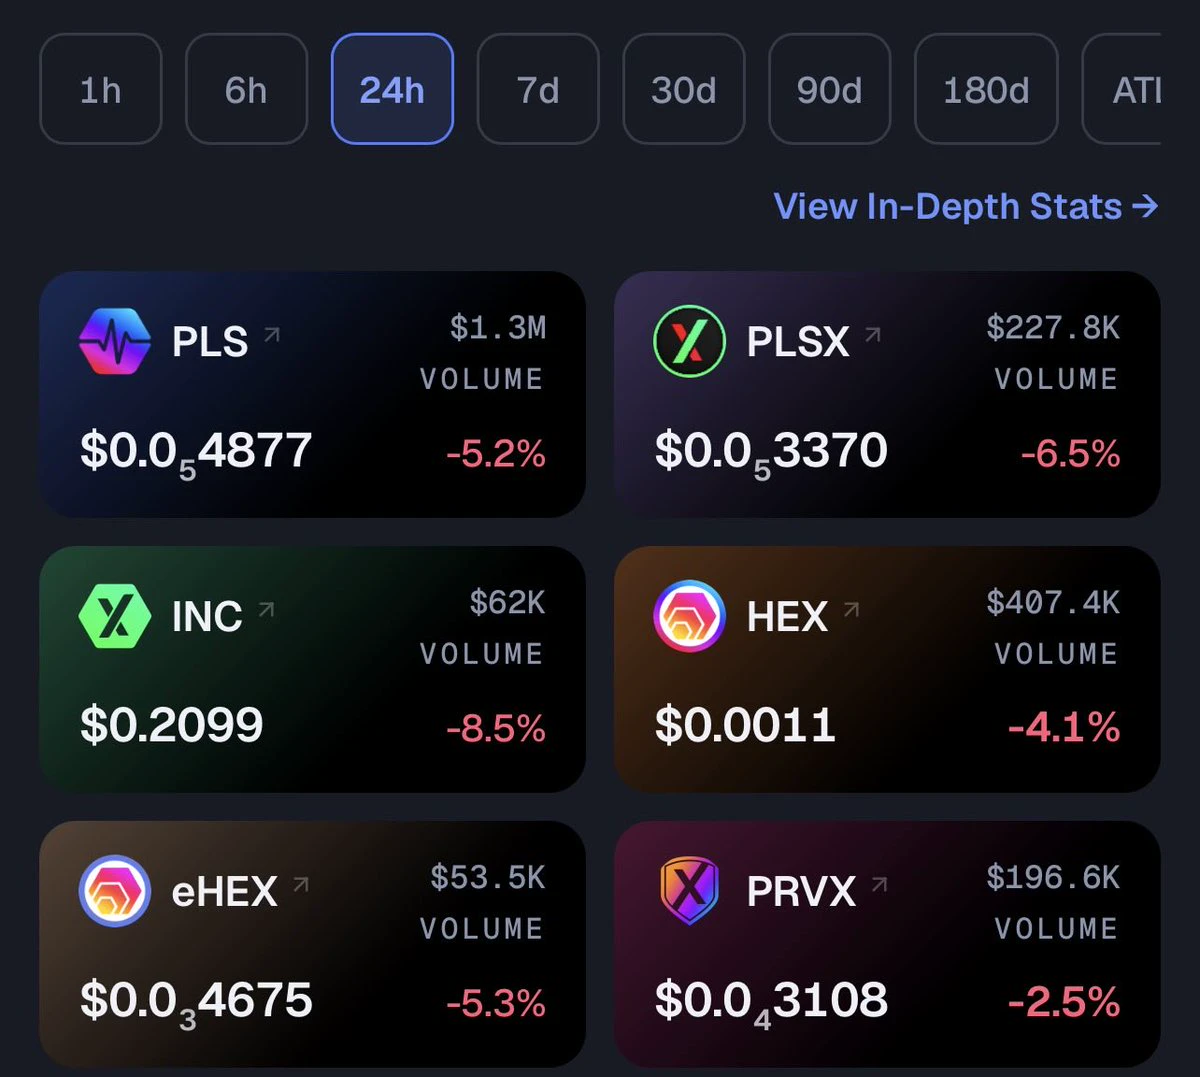
This confirmed my point that Richardheart has been a cancer and sole price manipulator
If he was a free man, he would dump his coins -40% today to mimic the general market
-Good news = no more new lows
-Bad news = nobody is rich to pump the prices.
Pulsechain = GHOST TOWN ❌
post-image
ETH Technical Outlook: Ethereum Breaks Below $1,900 as Bearish Momentum Intensifies

Ethereum is currently trading around $1,825.65, facing significant selling pressure after breaking below the $1,860–$1,888 support region. The latest daily price action shows a sharp decline from the September–October recovery highs, with ETH now testing an important demand zone around $1,825.

The broader market structure has weakened considerably. ETH is trading below all four major EMAs, while RSI has dropped to 20.73, indicating deeply oversold conditions. Buyers need to defend the $1,825–$1,835 area to pr
ETH-1.26%
  • 3
  • 2
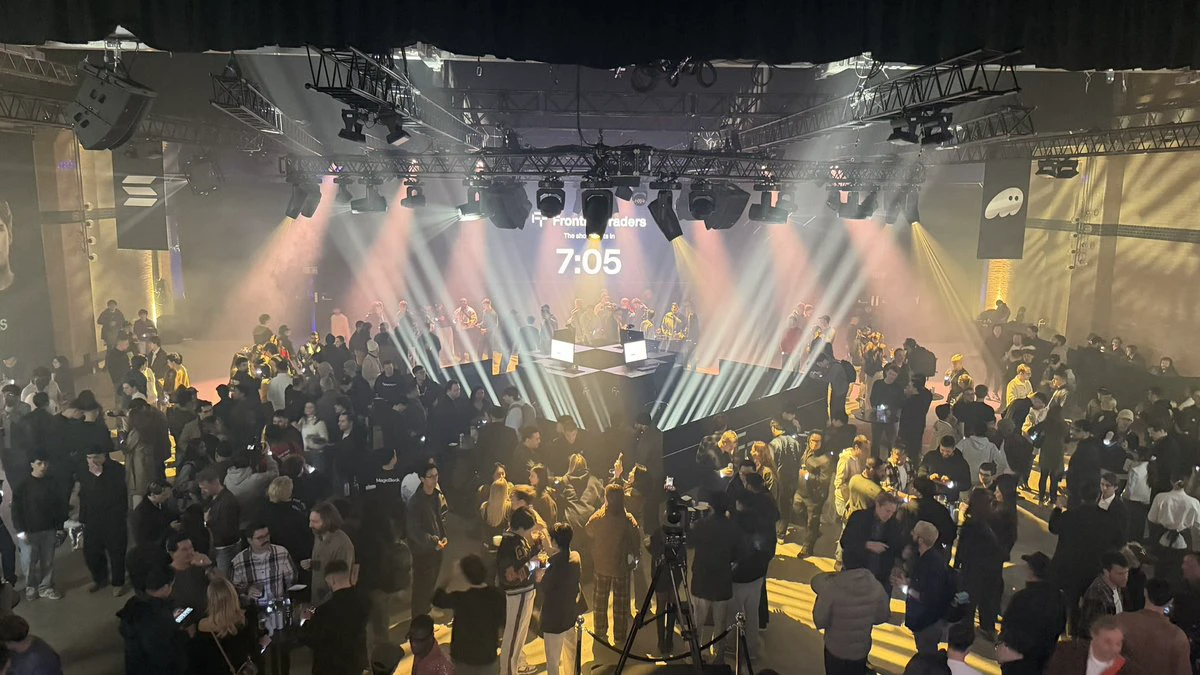
history begins in 7 minutes
post-image
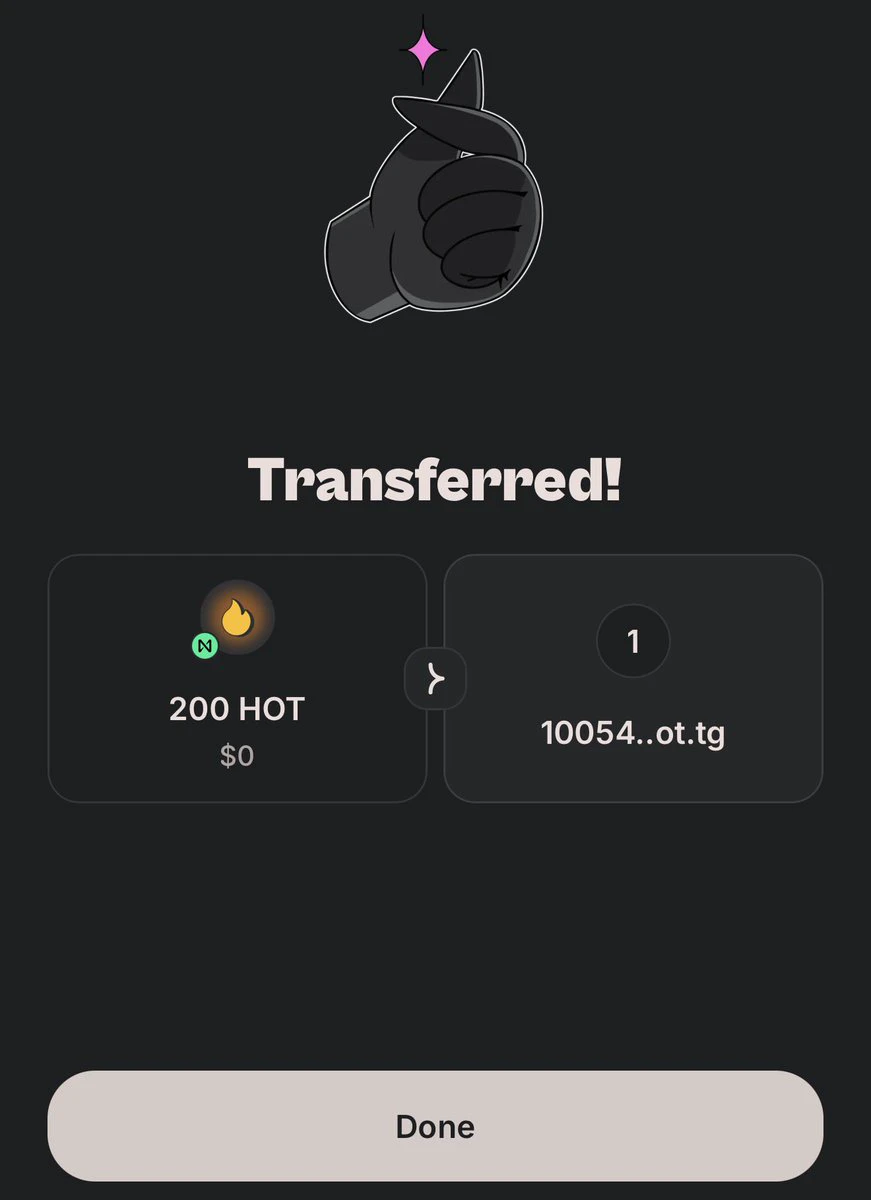
You can now transfer $HOT tokens?
How many $HOT tokens do you have and how much are you willing to sell yours? 🫵
post-image
Sunday at 5 a.m.

A Wall Street Journal article woke me right up ☕

Nvidia NVDA was revealed to have provided financing guarantees under Jensen Huang

to small cloud providers and data center developers that couldn’t afford GPUs

The amounts were in the billions of dollars

Customers borrowed money, then turned around
post-image
NVDA-1.92%
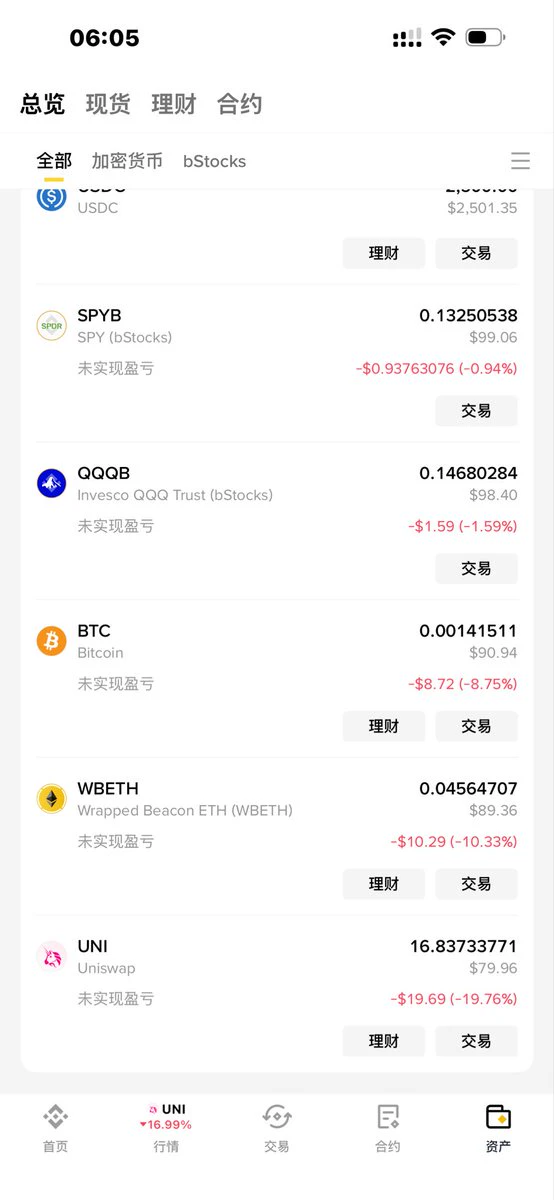
DCA Diary
Day 5
Blood in the streets😭
Invested 100u each in btc, eth, uni, q, and spy in total
uni is currently down 20%
eth is down 10%
btc is down 9%
q is down 1.6%
spy is down 1%
U.S. stocks are still holding up better
post-image
BTC-0.67%
ETH-1.26%
UNI+3.05%
🔹South Korean Chip Stocks Rebound Against the Trend! KOSPI Gains Over 2, While SK Hynix and Samsung
live-cover
LIVE30
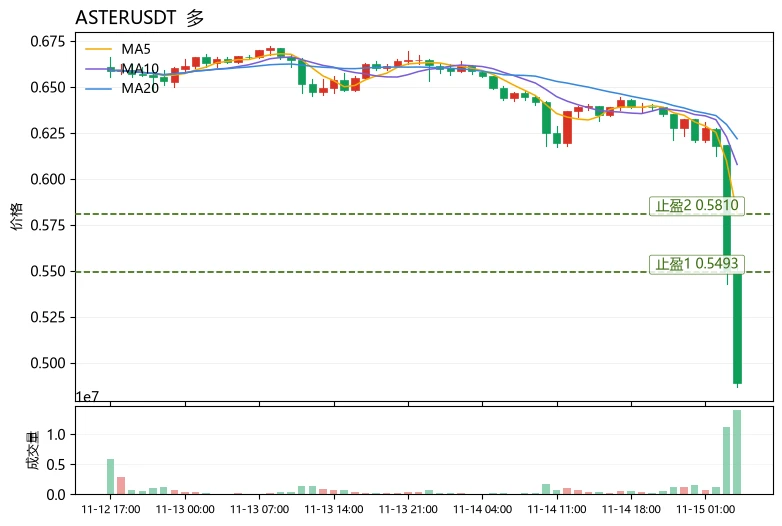
$ASTER Current price: 0.4884, below the lower Bollinger Band at 0.5493. The first resistance on a rebound is 0.5493, with support around 0.45 below. These two levels are highlighted because the current price is trading outside the Bollinger Bands, an extremely deviated state. Chasing shorts offers poor risk-reward, while longs require structural confirmation.
As a reusable chart-reading method, first assess whether the trend is healthy by checking the moving-average alignment: MA5=0.58104 is below MA20=0.621785, the moving averages are bearishly aligned, and the price is far below MA5. This i
post-image
ASTER-0.07%
HYPE+0.24%
ENA+8.04%
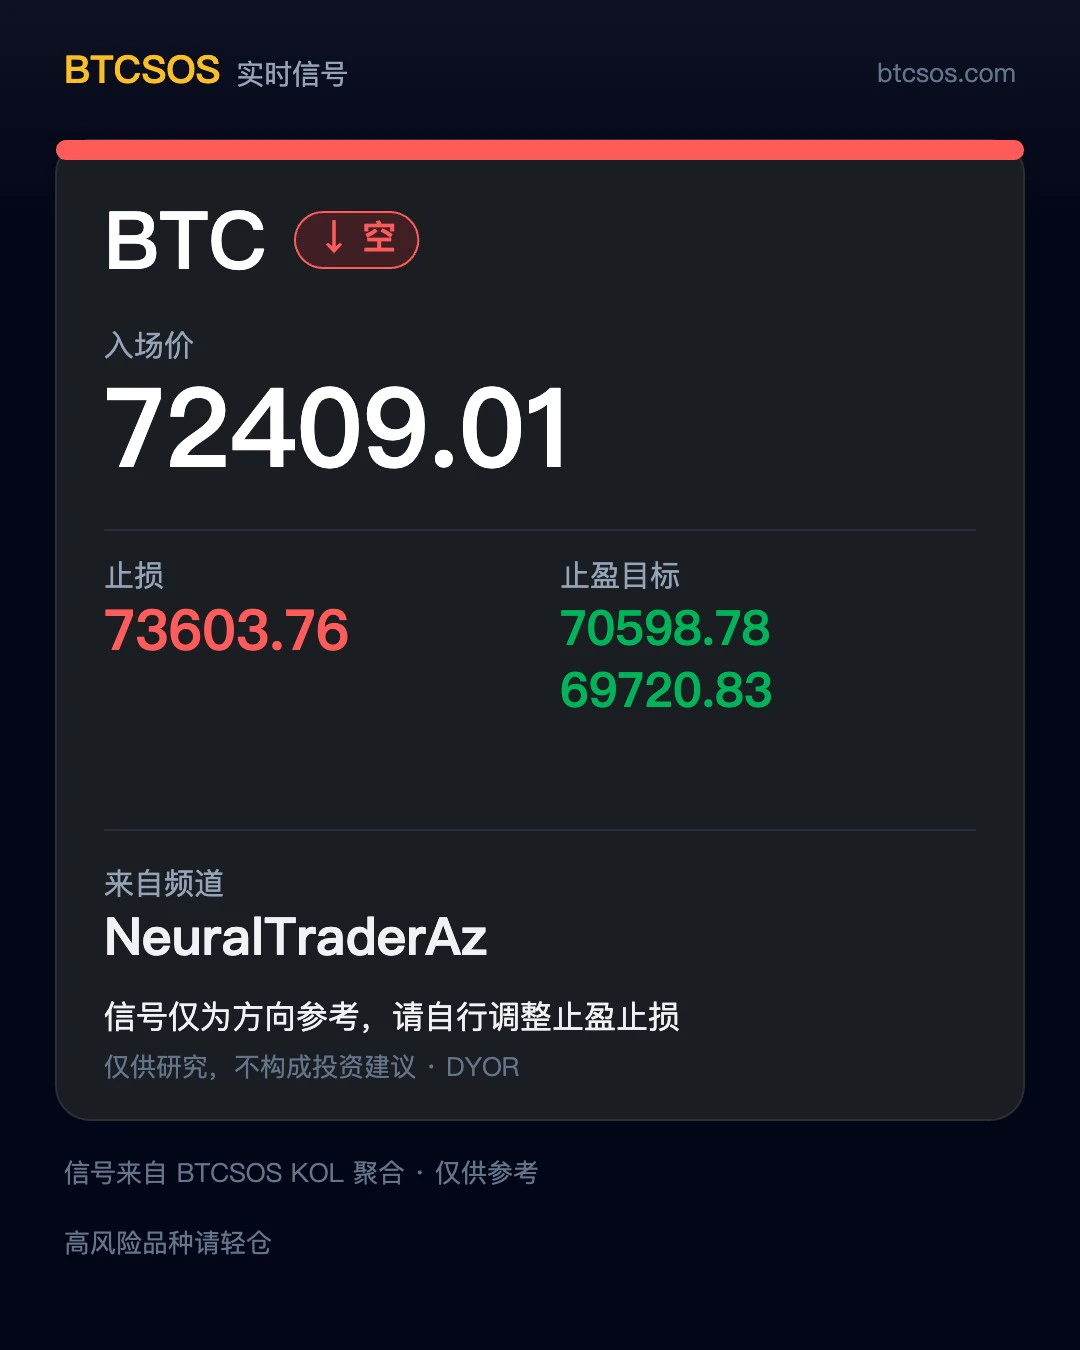
📡 Signal Card · Repost Mode
The NeuralTraderAz channel just posted an $BTC short:
Entry: 72409.01 Stop loss: 73603.76 Targets: 70598.78 / 69720.83
Speaking of which, I reposted his $ZEC long earlier today, and here he is again—pretty productive 😂
As always, a disclaimer: I only repost and share it as-is, without edits. Whether to follow and how much to put in is up to you—manage your own risk.
For personal records and sharing only; not investment advice. #Treasury strategy divergence: 14 listed companies have sold over 100,000 BTC this year
post-image
BTC-0.65%
ZEC+1.16%
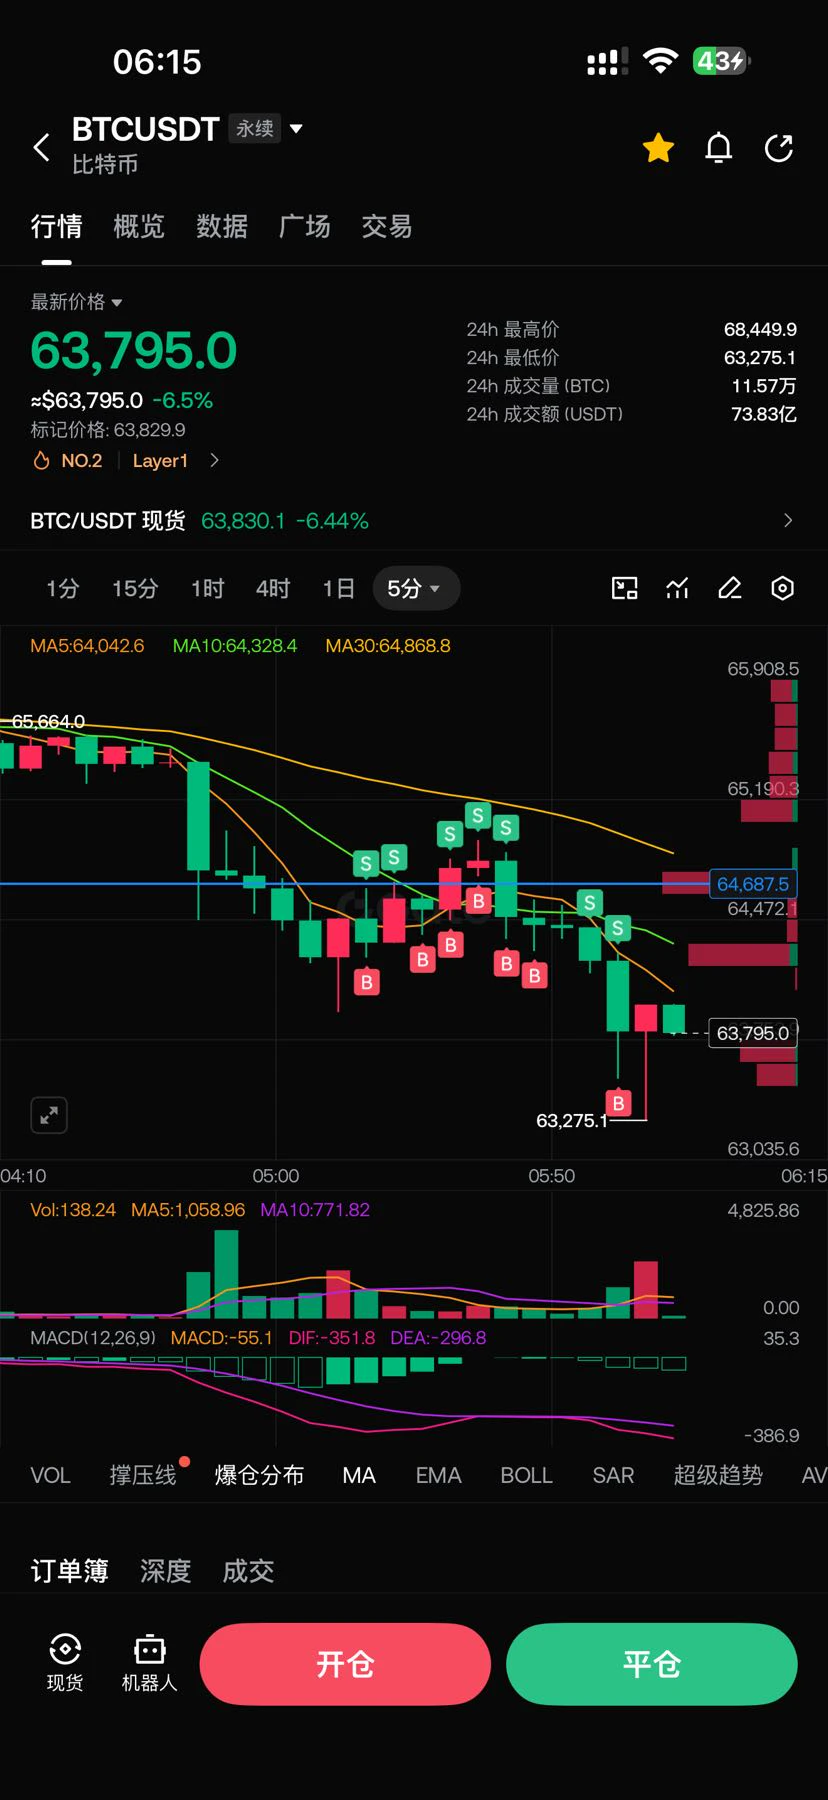
#btc Still not buying the dip?
Still waiting for the right
Opportunity waits for no one
A bottom at 63000
Take profit at 68000
post-image
BTC-0.67%
  • 1
🚨 OPENAI IS BRINGING AI-POWERED SHOPPING TO CHATGPT.
AI AGENTS CAN SHOP FOR YOU — NO CRYPTO REQUIRED. 🤖🛒
post-image
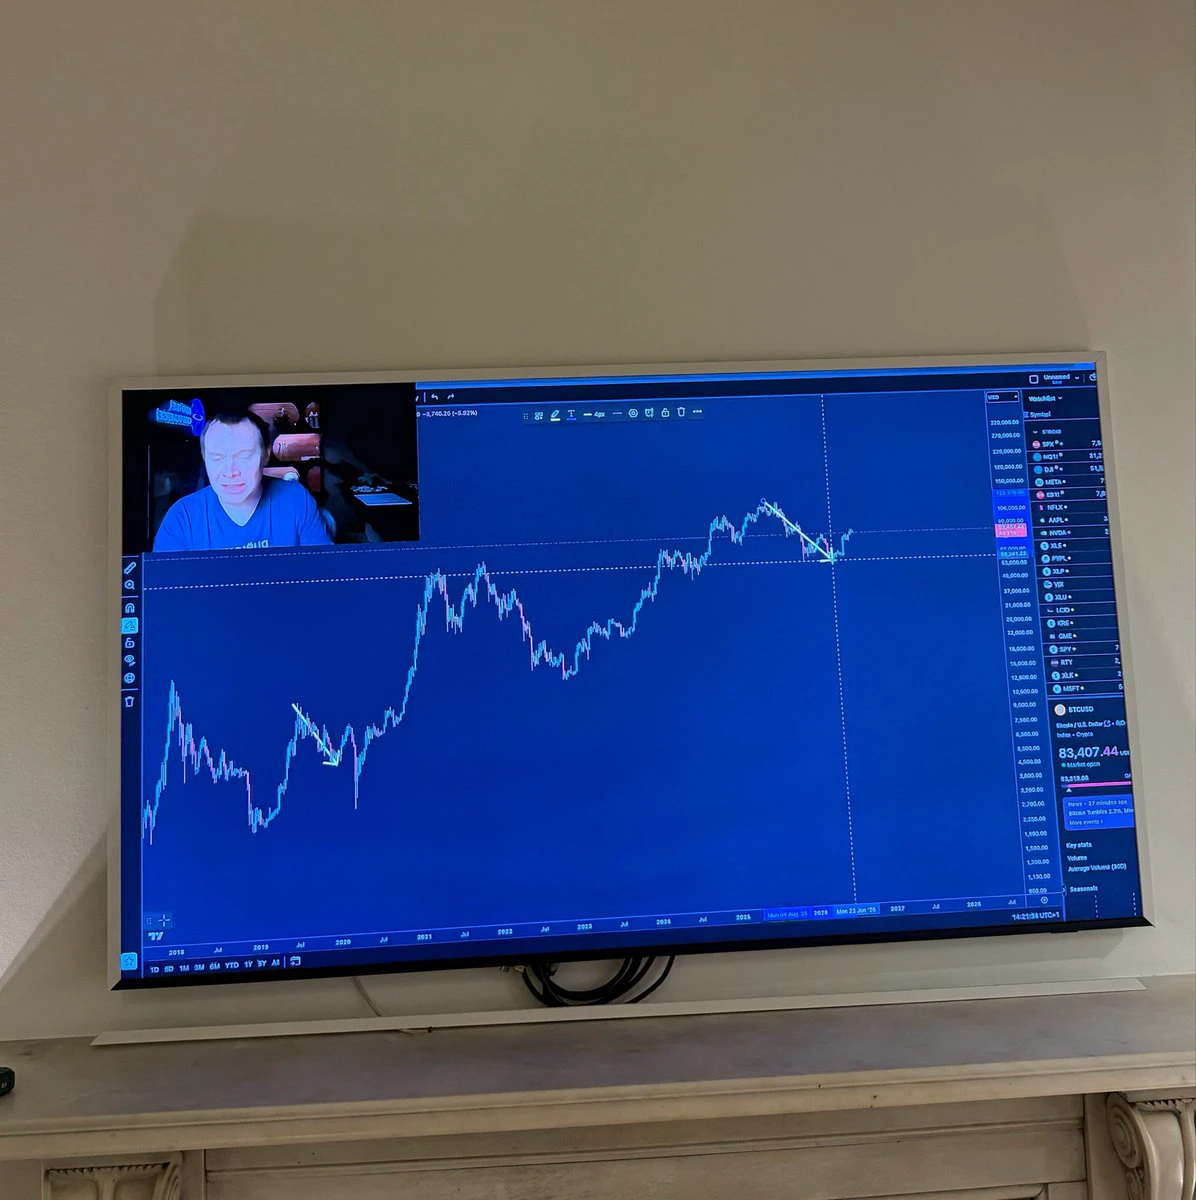
Benjamin Cowen on a Saturday night in London dawg we rlly down bad💀
post-image
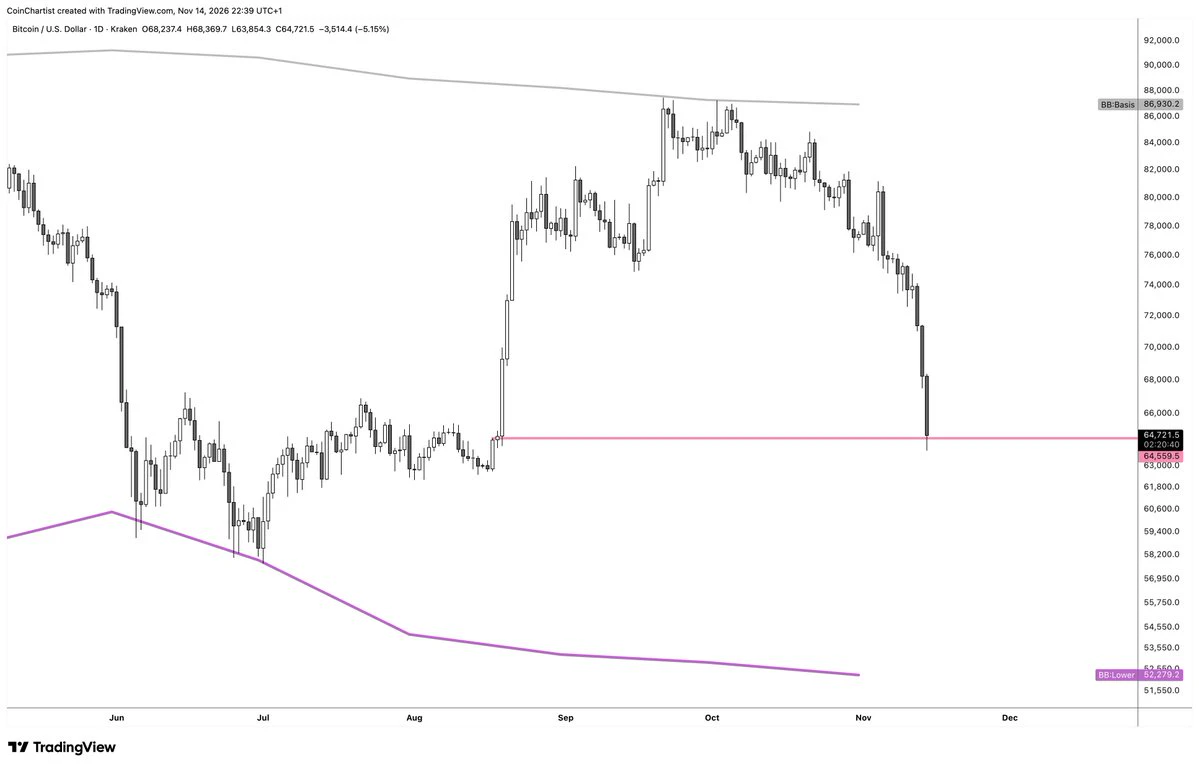
#BTC has retraced the entire August 7 September bull from my "head fake" long call from lower that I rode all the way to my target at the Bollinger Band basis, flipped short, and rode it right back down
post-image
BTC-0.65%
Kindly send me followers red packet arrange a time 60 minute in my live streaming i am starting th
live-cover
LIVE30
XRP Technical Outlook – Bears Maintain Strong Control Below $1

XRP is trading around $0.939, extending its bearish move after breaking below the important $0.9919 support level. Price is trading significantly below all four major EMAs, while RSI has fallen into deeply oversold territory, highlighting strong selling pressure.

EMA Structure

- 20 EMA: $1.1521

- 50 EMA: $1.2509

- 100 EMA: $1.2804

- 200 EMA: $1.3368

- XRP is trading below all major EMAs, confirming a strong bearish trend structure.

- The 20 EMA is below the 50, 100 and 200 EMAs, showing continued weakness.

- The entire EMA
XRP-1.12%
  • 1
  • 2
$PENGU Down 23% in 24 hours, currently at 0.0047, with a low of 0.0046 already hit—just 0.0001 above the 24-hour low. This isn't a pullback; it's a panic-driven sell-off. 83M in trading volume shows panic selling changing hands at higher volume. Nearly a quarter of the market cap has vanished from the 24-hour high of 0.0061. Every wick you see now is someone selling at a loss—and someone else catching a falling knife.
Time anchor: We’re now in the first 4-hour window after the crash for watching a potential stabilization signal. The next 6–12 hours will determine whether this is a “stop-hunt w
PENGU+0.40%
  • 2
  • 1
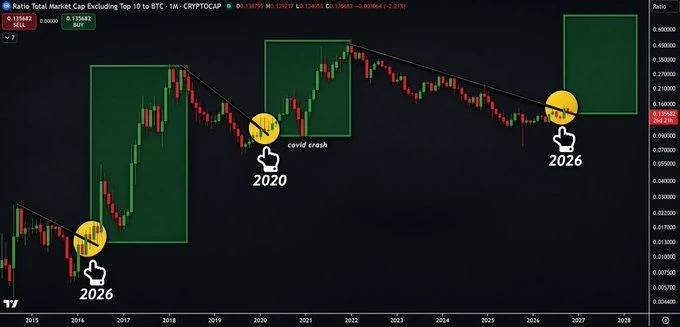
🤑🤑 I'VE SAID IT BEFORE, AND I'LL SAY IT AGAIN!
ALTSEASON IS COMING! 🚀
2026 could be a massive year for #Altcoins.
Stay patient, stay prepared, and don't miss the opportunity. 📈💰🔥
WHO'S READY FOR ALTSEASON 3.0? 👀
post-image
What if $BNB 's second short is a completely different trade?

First one: entry 694.548–694.932, TP3 685.226. Price is 578.9 now. It paid.

This one: 16.6% lower, 4h RSI 18.1 — the most oversold chart I've posted.
My own note says "washed out, bounces are common."

Both timeframes still bearish-stacked, sellers in control.
So: short, but small. Moderate conviction, light size.

Entry 577.667–580.133 · SL 605.374 (+4.6%)
TP1 −3.4% (~0.75R) · TP2 −5.7% (~1.25R) · TP3 −9.1% (~2R)

First short sold strength. This one sells exhaustion.

Bounce or continuation? 👇
$BNB ‌$KAVA ‌$AKE ‌
BNB-0.72%
KAVA-0.47%
AKE+6.07%
Load More

Join 40 M users in our growing community

⚡️ Join 40 M users in the crypto craze discussion

💬 Engage with your favorite top creators

👍 See what interests you

Trending Topics

GateIPOAccessAnthropic

329.7K Views2.9K Discussing

Gate IPO Access Phase 3 features Anthropic (ANT), with USDT subscription interest starting from 100 USDT. Successful allocations will be delivered as real shares to Gate Stock Accounts. Indicative price: $70–$78/share Subscription: Nov 12–17 (UTC+8) Allocation is not guaranteed. Please manage risk accordingly.

Dr.HanOxfordUnionSpeech

149.2K Views663 Discussing

USOctoberPPIBelowExpectations

471.9K Views1.6K Discussing

View More