Share your thoughts
placeholder
Article
#GateSquareMidAutumnReunion
₿ BTC Reclaims $81K — But Macro Is Getting Interesting
BTC is back above the $81K area, reaching around $81,034 during Friday's move.
What makes this move interesting to me is the macro environment behind it.
Oil prices have been highly volatile as the market continues to deal with supply disruptions and uncertainty around Middle East energy flows.
WTI briefly moved down toward the mid-$90s before rebounding toward the upper-$90s, while broader crude prices remained around elevated levels. The IEA also warned that continued supply constraints could create further
BTC-0.97%
JUST IN: Arthur Hayes reportedly opened a large ENA stake ~1 month ago, now showing ~146% unrealized gain (~$3.28M) on ~25.33M ENA at ~$0.09 avg. Could signal notable insider/flow interest in ENA. $ENA
post-image
ENA+7.32%
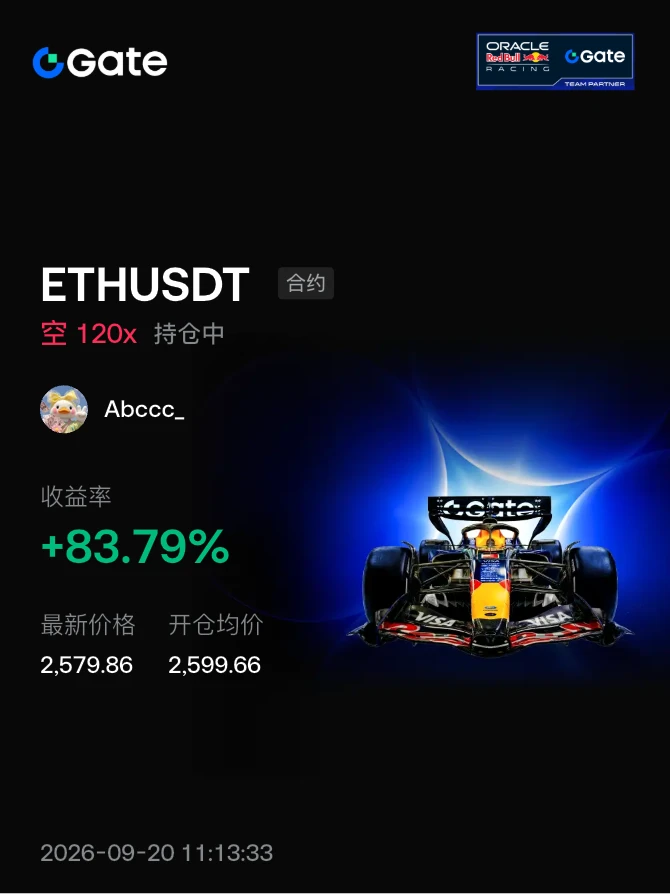
I don't believe it; it's my last bit of stubbornness.
post-image
#晒出我的持仓收益 's position isn't ideal, and it has been holding on all along, but it still believes in #空军必胜 .
post-image
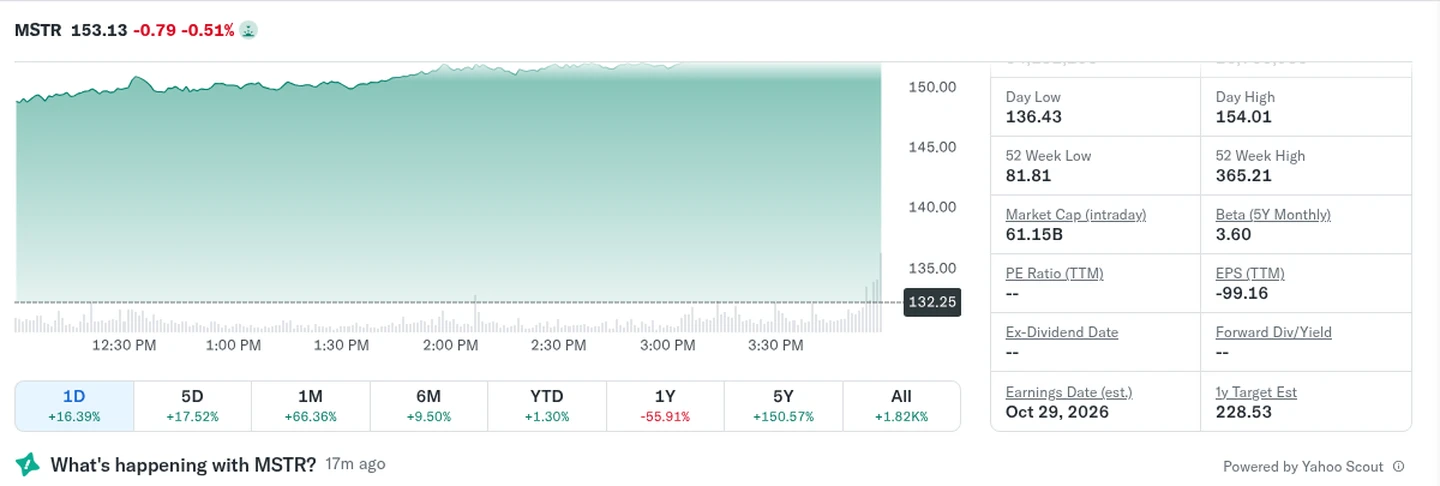
MSTR gained approximately +16% in a single day, while BTC rose only about 6%.
It closed Friday at approximately 153.92, rising from around 137. During the same period, BTC climbed back above approximately $81,000; Strategy holds approximately 845,000 BTC on its balance sheet.
Simply put: U.S. stocks amplified BTC’s volatility by approximately 2.5–3x. Combined with the Senate Finance Committee advancing the Strategic Bitcoin Reserve bill by 28–21, sentiment is running hotter.
My view: this is a resonance of leveraged beta and the policy narrative—not a sign that the “strategic company” fundamen
post-image
MSTR+16.35%
BTC-0.97%
  • 2
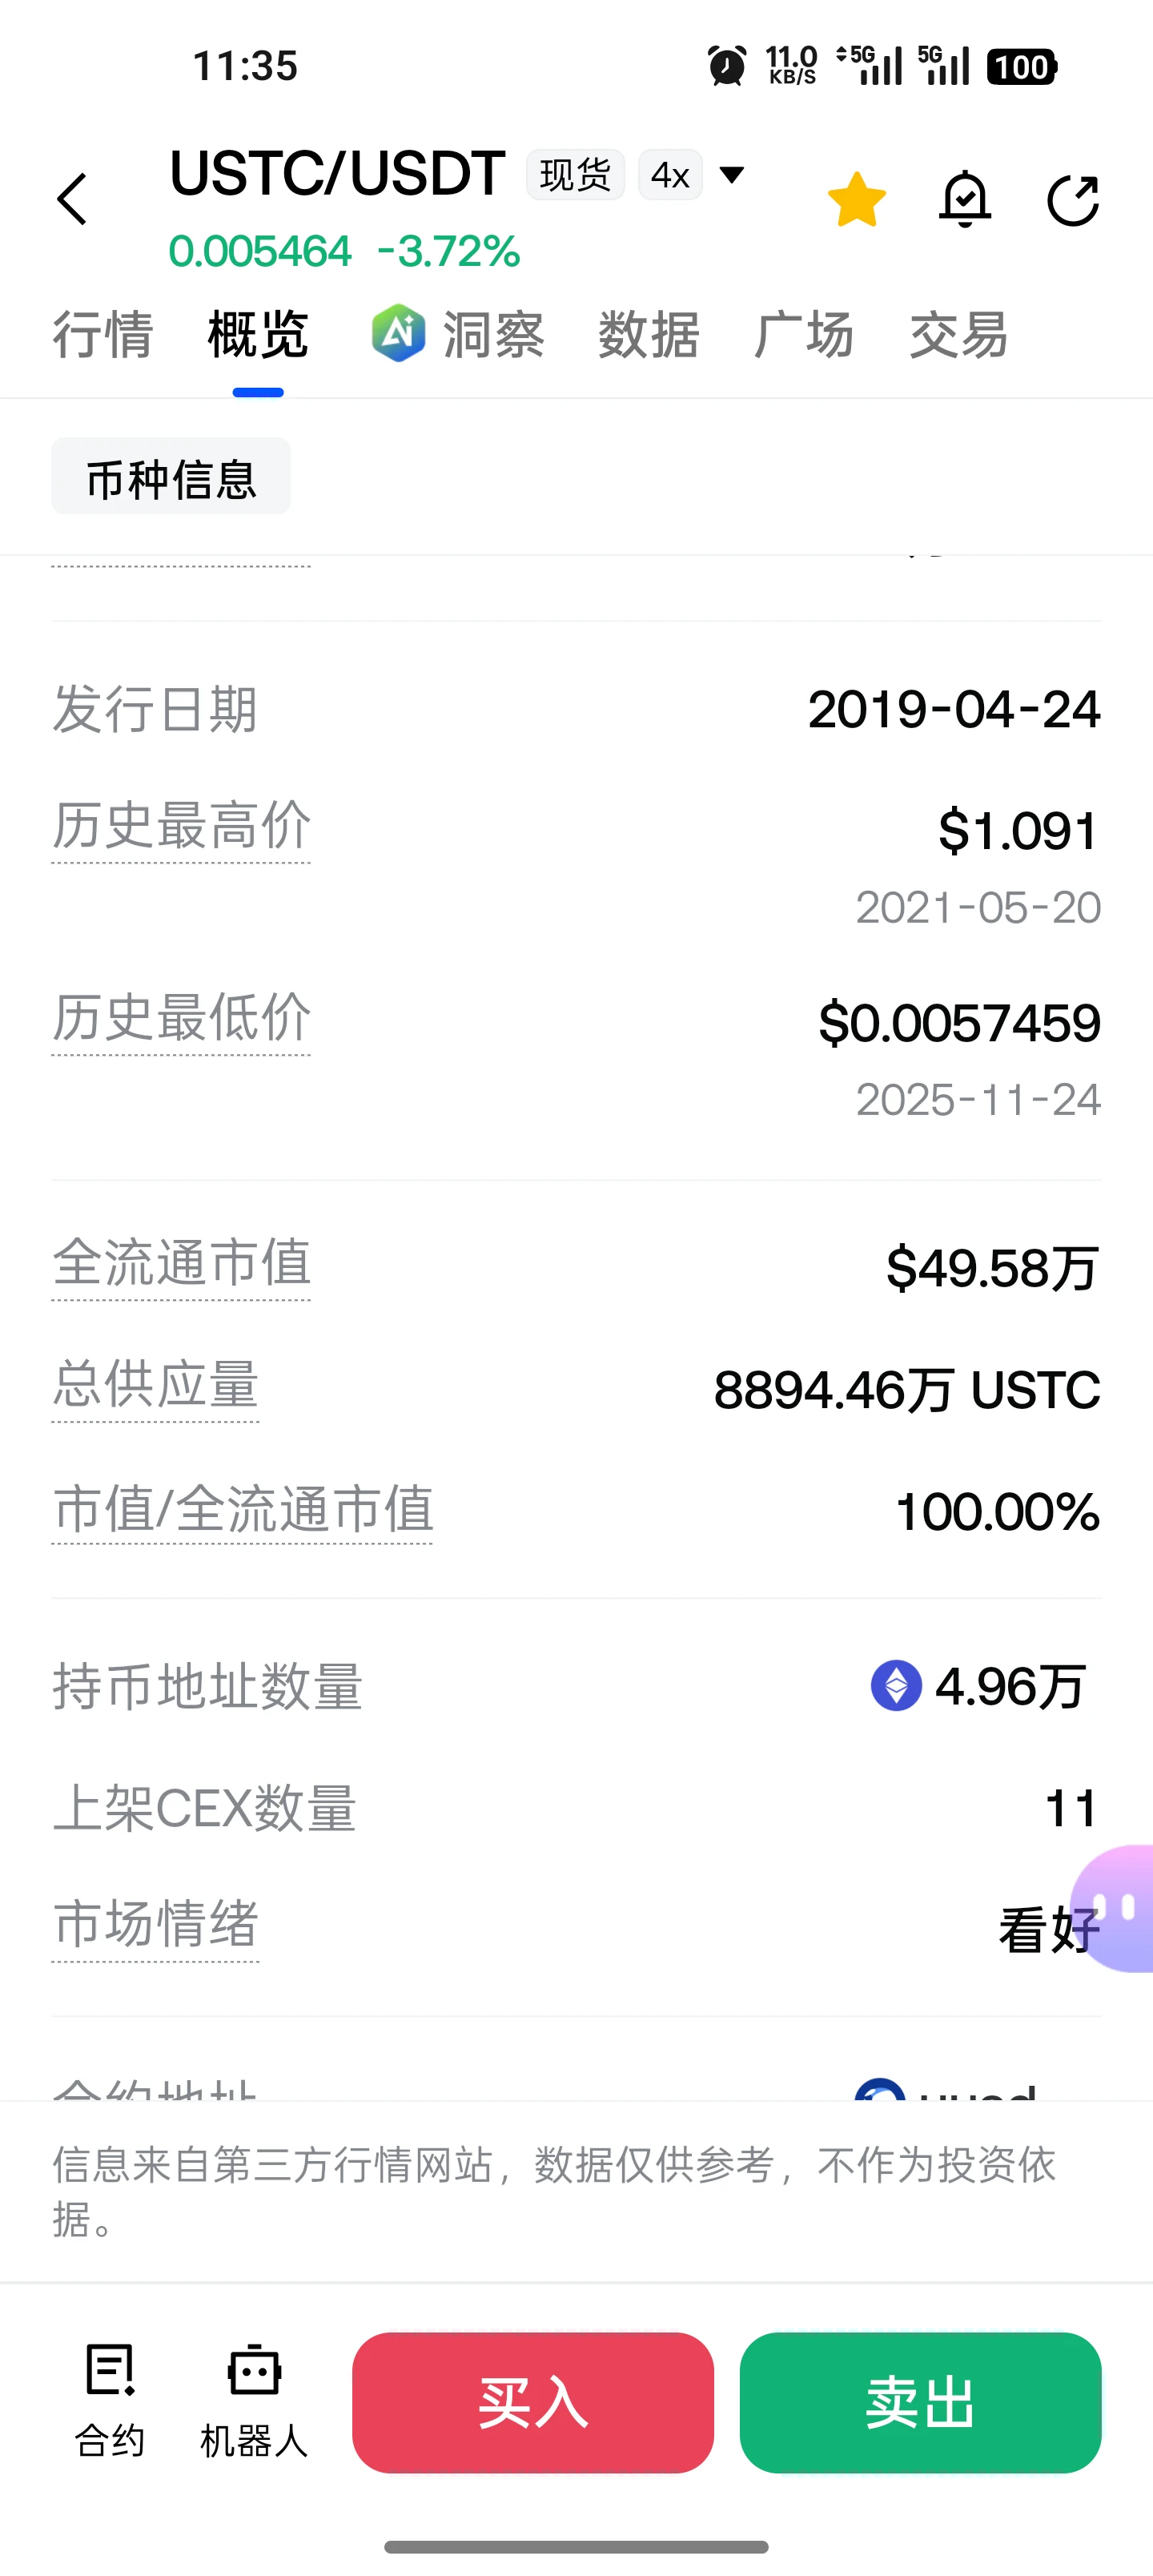
$USTC seems to have never been burned.
post-image
USTC-3.71%
9.20 Market Analysis
BTC strategy reference setup
Entry zone: around 80500–80800, long
Stop-loss: 80000
First target: 81900; second target: around 82700
BTC surged to 81900 before meeting resistance and pulling back. It retested 80800 in the early morning and quickly stabilized, with strong buying support below. This was a normal pullback after a strong rise, and a short-term double-bottom pattern has formed.
Short-period moving averages are turning upward, and the bullish structure is being repaired. Holding the 80800–81000 support zone could lead to another test of the previous high at 81900
ETH-1.51%
BTC-0.97%
$B2 Returning to momentum
B2 is attempting a strong reversal after rebounding from the $0.49–$0.50 region. As long as it firmly holds above $0.61, it could open the way for the next upward move. Entry: $0.59–$0.61TP: $0.63 – $0.65 – $0.68 – $0.70SL: $0.55Trade on $B2
post-image
B2+36.54%
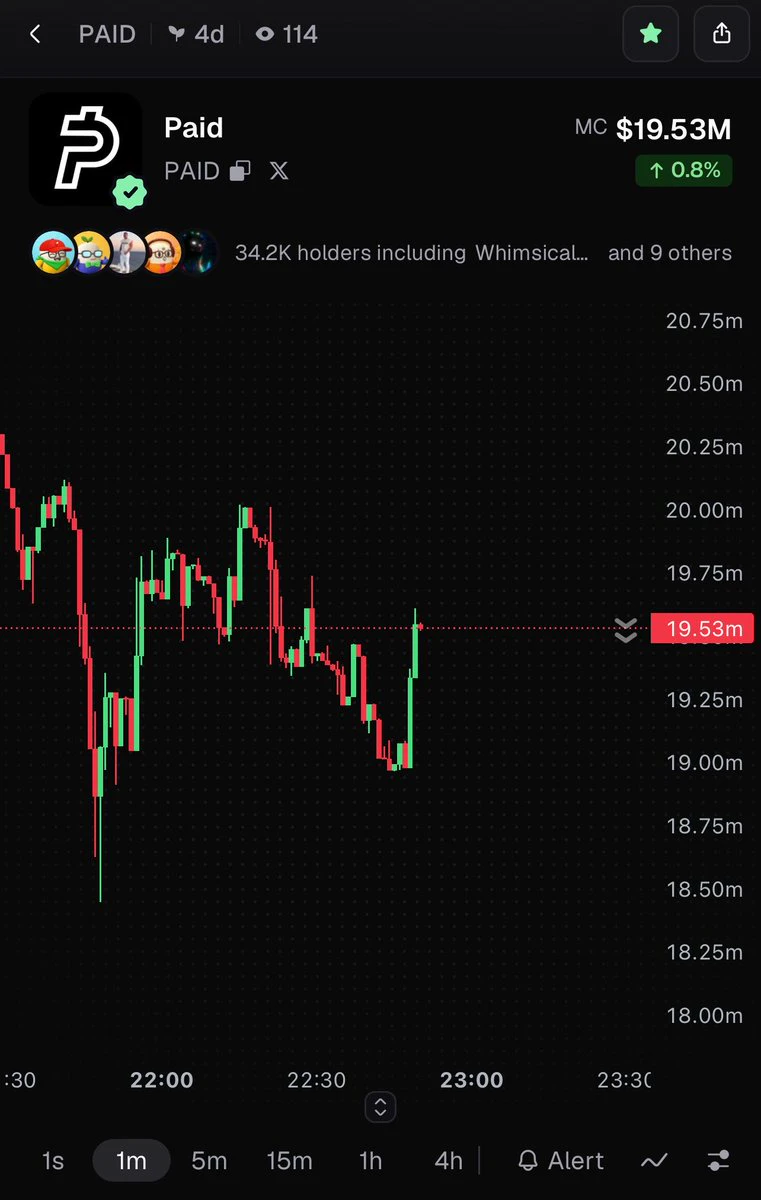
solana:98kfF7rmsg1QDUEoCqNE7g7M1FdrTt92TEp2CLzypump 👀
98kfF7rmsg1QDUEoCqNE7g7M1FdrTt92TEp2CLzypump
Big pump coming
post-image
SOL-4.24%
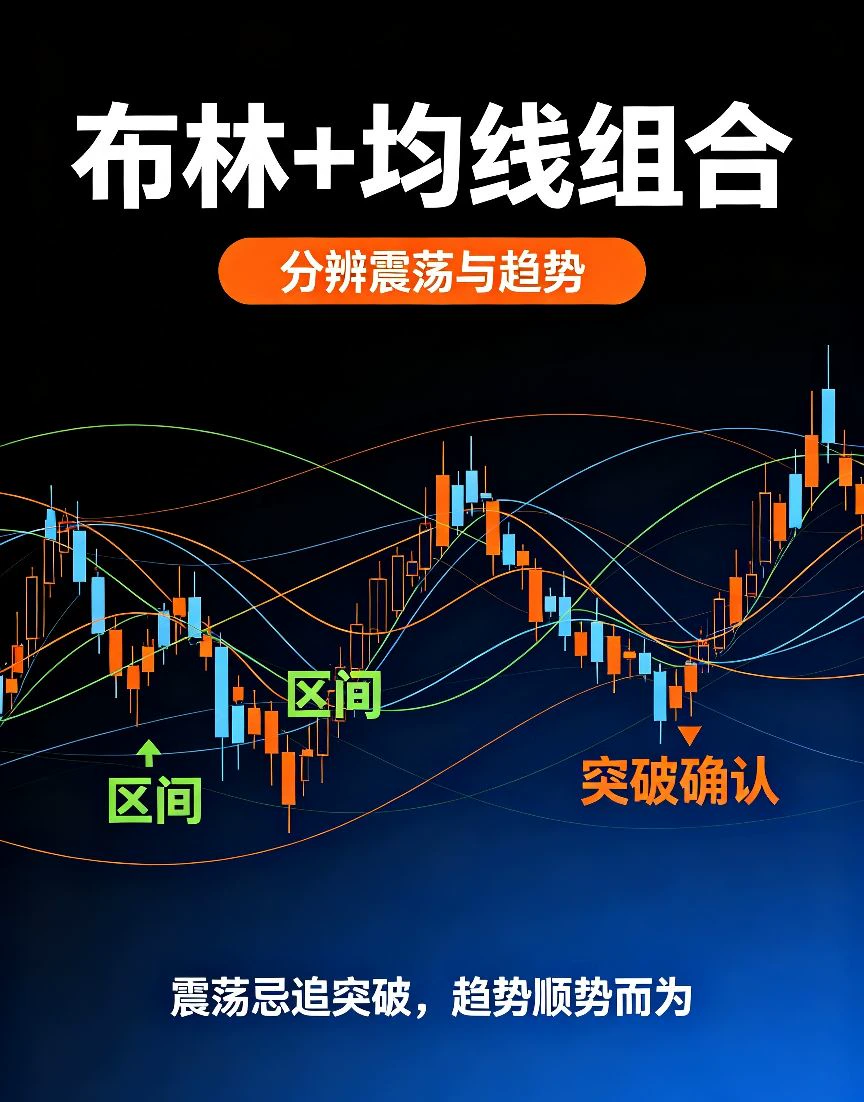
Episode 3 | Bollinger Bands + Moving Averages: Distinguish Range-Bound Markets from Breakouts and Reduce Losses from False Breakouts
In range-bound markets, prices repeatedly move between the upper and lower Bollinger Bands, and frequent breakouts are mostly false signals, making stop-losses easy to sweep repeatedly; in trending markets, prices move in one direction along the Bollinger Bands, while moving averages reinforce the direction.
Simple practical rules:
When prices move back and forth around the Bollinger middle band and the moving averages converge, prioritize identifying a range-bou
post-image
ETH-1.51%
9.20 Market Analysis

ETH Strategy Reference Setup
Rebound range: Go long near 2580--2610
Stop-loss: 2560
First target: 2650, second target: 2690

ETH 4-hour candlestick analysis

Current price: 2615.36
Bollinger Bands BOLL(20,2)

- Upper band UB: 2712.04 (strong resistance)

- Middle band: 2540.49 (bullish lifeline, bull-bear dividing line)

- Lower band LB: 2368.93 (deep support)

The 4-hour overall trend is bullish. After encountering resistance above, it has entered a pullback consolidation phase. If the middle band holds, there is still an opportunity to move higher; if it breaks b
ETH-1.51%
BTC-0.97%
Market Alert

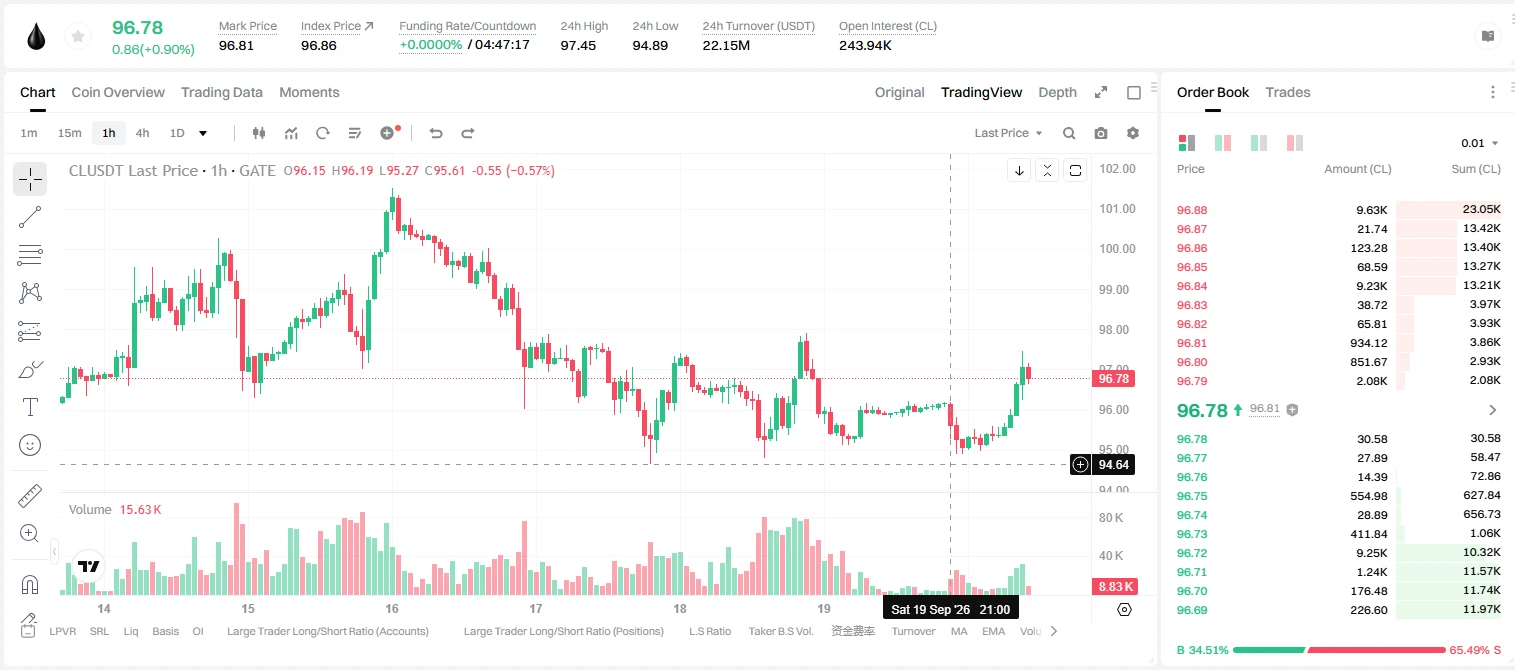
$CL /USDT - SHORT

Trade Plan:
Entry: 96.7 – 96.9
SL: 98.0
TP1: 95.9
TP2: 95.4
TP3: 94.5

Why this setup?
Technical setup found.

Debate:
Thoughts?

⚠️ Personal market analysis only. NFA — manage risk and DYOR.
Educational content, not investment advice or a recommendation to buy, sell, deposit, or withdraw any asset. No paid promotion or referral/affiliate links.
post-image
CL+1.08%
JUST IN: Major warning issued regarding crypto identity and AI security! ⚠️ 🔹 Stolen $BTC or tokens can be tracked or returned. 🔹 Leaked personal data can NEVER be undone. 🔹 Traditional honeypots are dangerous for billions of AI agents. 🔹 Privacy architecture must be built right now. Protecting user identity in the age of autonomous $ETH agents is becoming the ultimate Web3 priority. 🔒 #GateIdleEarnAutoYieldUpTo3% #GateLaunchesTrenchesWith0GasFee #ShareWeekly #WeekendMarketBullishOrBearish
post-image
BTC-0.97%
ETH-1.50%
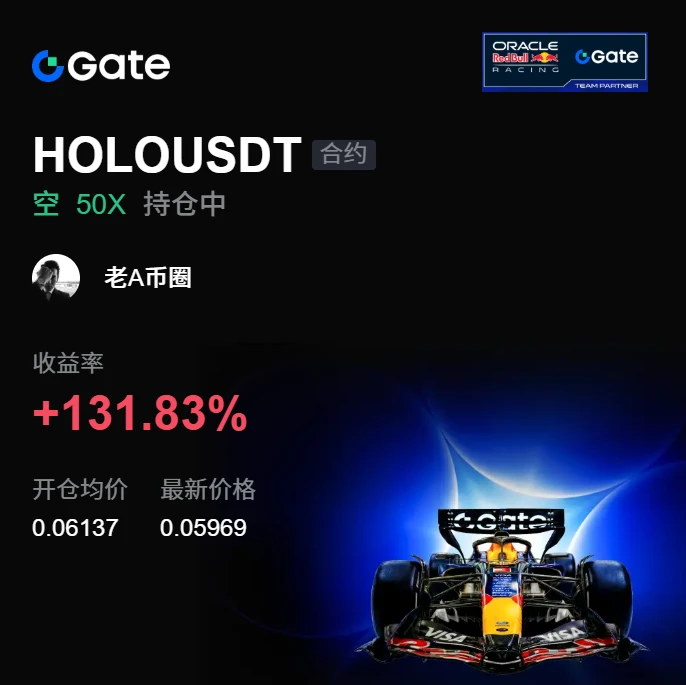
I had already finished complaining to my friends about this week’s market, but now I have to take it back. A bit awkward.
A few nights ago, I checked $HOLO before bed. Every push upward fell just short, the volume failed to follow through, and it strongly smelled like a bull trap. I said just one thing at the time: no one is there to take it higher, so keep holding the short.
Turns out staying up wasn’t for nothing. From 0.06137 to 0.05975, +131.83%—that was a satisfying bite of profit.
Don’t let profits inflate your ego, and don’t despair over pullbacks. I’d rather miss a limit-up than catch
post-image
HOLO-0.85%
ETH-1.51%
LAB+4.63%
3-to-1 split announcement lands, ZEC moves only -0.2%: this excitement has nothing to do with the token price
Who could have seen this coming? Less than two hours ago, after the 3-to-1 split announcement, $ZEC moved only from 1470.84 to 1467.89, down -0.2%. The plan is clear: I’ll buy the dip if 1454 holds, and cut losses if 1422 breaks.

Let’s make this clear first—the split applies to the equity token ZCSH, with September 28 as the record date and September 30 as the effective date; the total value remains unchanged. The accompanying ZEC spot fees are close to zero, merely reducing friction
ZEC-5.29%
over all market updates prediction
live-cover
LIVE634
9.20 Bitcoin analysis
Bitcoin has returned strongly, once again pulling back up to test the high. Unfortunately, it failed to achieve an effective breakout and instead retreated during the day. Do not assume the trend has reversed; this is merely a normal pullback after the price surged. A pullback is an opportunity to go long.
On the four-hour chart, a double top has formed above the rising price, testing resistance, so a short-term pullback is normal. The middle band is currently acting as support, so look to go long in batches on a pullback to the 79000-79300 region. The target is 82000; on
BTC-0.97%
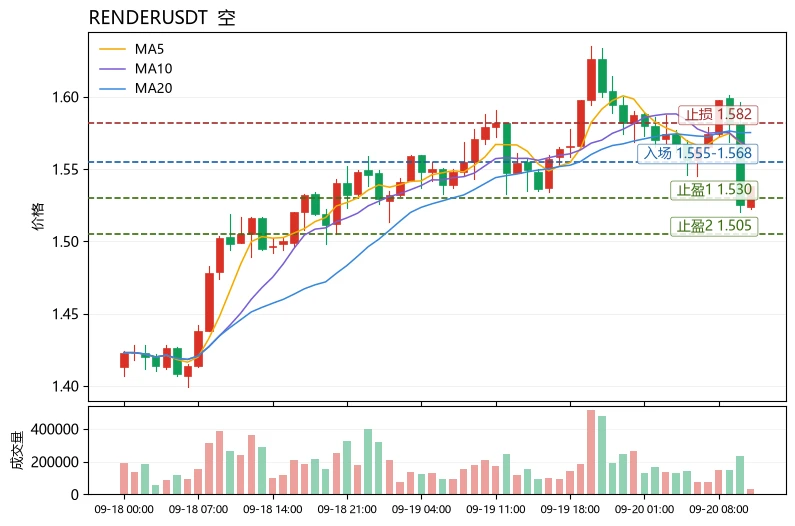
$RENDER Conclusion first: bearish in the short term; sell on rebounds, and do not chase the decline.
Reasoning: MA5=1.5632 has crossed below MA20=1.5752, and the moving averages are in a bearish alignment, indicating that the average cost over the past 5 candlesticks is below that of the past 20, meaning the trend structure has deteriorated. RSI=44.1 is below the midpoint but has not entered the oversold zone, indicating that there is still room for further downside; the MACD histogram=-0.007066 is negative and has not converged, so momentum has not recovered. The lower Bollinger Band at 1.530
post-image
RENDER-2.93%
ETH MARKET UPDATES
live-cover
LIVE1,558
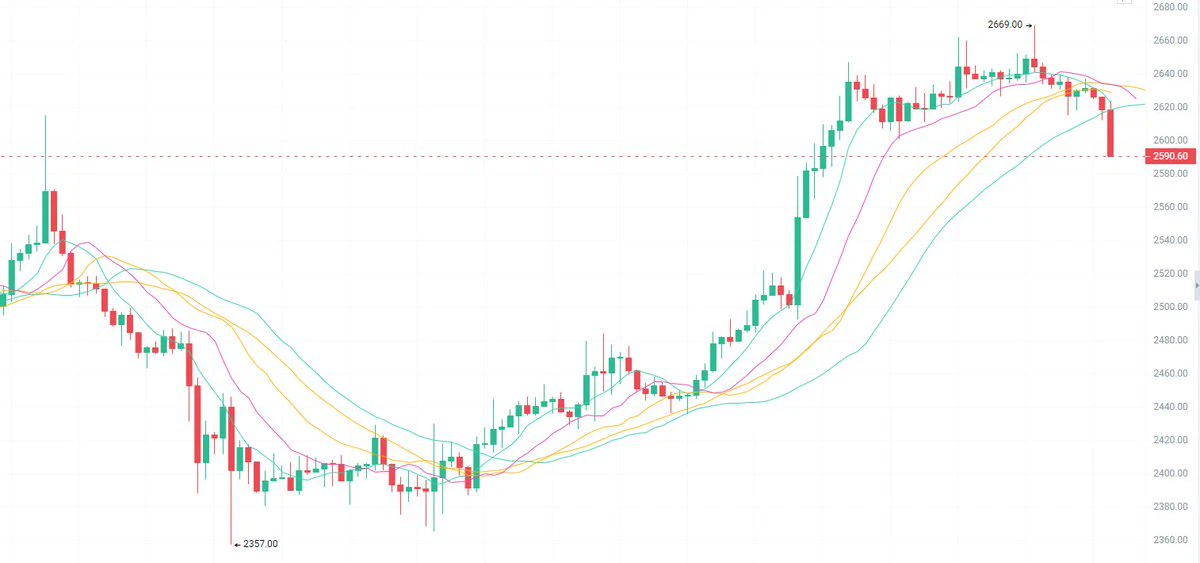
9.20 Ethereum long around 2580, defense at 2550, targets 2680/2750
Ethereum surged to 2669 on the 1H chart before consolidating at elevated levels. The current price is 2606, with short-term moving averages in a bullish alignment.
The 2600 level has shifted from resistance to support. Waiting for a pullback and confirmation before going long is more stable than chasing the price higher.
On the news front, Ethereum ETFs recorded net outflows of $140 million last week, ending four consecutive weeks of inflows. However, BlackRock’s ETHA saw a single-day net inflow of $114 million, clearly s
post-image
ETH-1.50%
Load More

Join 40 M users in our growing community

⚡️ Join 40 M users in the crypto craze discussion

💬 Engage with your favorite top creators

👍 See what interests you

Trending Topics

MSTRTopsNasdaq100

72.4k Views2.6k Discussing

Strategy (MSTR) has gained about 48% over the past month, making it the best-performing stock in the Nasdaq 100, while Bitcoin rose roughly 12% over the same period. The company holds 845,050 BTC with a cumulative cost basis of about $63.73B. MSTR is not a pure Bitcoin proxy — its price swings can be more extreme. Can this rally last?

BTCRetakes80K

56.14k Views59.79k Discussing

GarrettJinHolds320MInZEC

37.24k Views1.4k Discussing

View More