








Square
Following
Hot
News
Profile
Share your thoughts
placeholder
Article
10.29 BTC Positioning Strategy
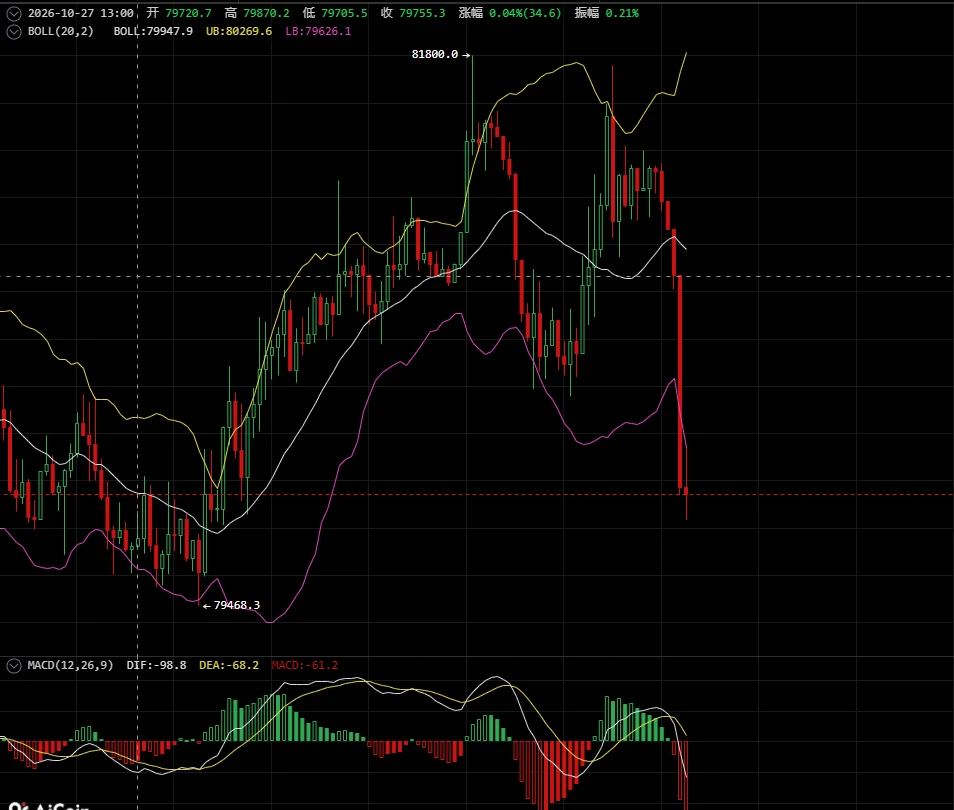
  BTC is currently experiencing a rapid, sharp drop on the minute-level chart, briefly falling below the lower Bollinger Band into oversold territory. The short-term price has diverged too far from the moving averages, creating a need for a technical rebound. The key support below is around the previous rally’s starting low of 79468. Consider opening a small short-term long position in the 79600-79800 support zone. Set a stop-loss below 79400 in case support breaks decisively. The initial rebound target is the 80300-80400 lower Bollinger Band recovery area. If th
post-image
BTC-0.65%
  • 1
What Is the Sharpe Ratio? Why Isn’t a Strategy With Higher Returns Necessarily the Better Choice?
In the cryptocurrency market, some trading strategies deliver high annual returns but come with sharp drawdowns, while others generate relatively steady returns and a more stable equity curve. Comparing only how much money a strategy ultimately made may not provide a complete picture of its quality. In such cases, you can look at the Sharpe Ratio.
First, what is the Sharpe Ratio?
The Sharpe Ratio measures the relationship between the excess returns an asset or strategy earns over the risk-free rat
post-image
  • 2
Trenches
TTWO
T
bade
b
TTWO
TTWo...FbKo
Market Cap
$.
Change
.
24h Vol
$.
Holders
.
BNCB
B
bade
b
BNCB
0x49...ec3f
Market Cap
$.
Change
.
24h Vol
$.
Holders
STONK
S
bade
b
STONK
6GmA...UNgx
Market Cap
$.
Change
.
24h Vol
$.
Holders
.
ZIG
Z
bade
b
ZIG
0x8c...1145
Market Cap
$.
Change
.
24h Vol
$.
Holders
.
Q
Q
bade
b
Q
0xc0...0589
Market Cap
$.
Change
.
24h Vol
$.
Holders
.
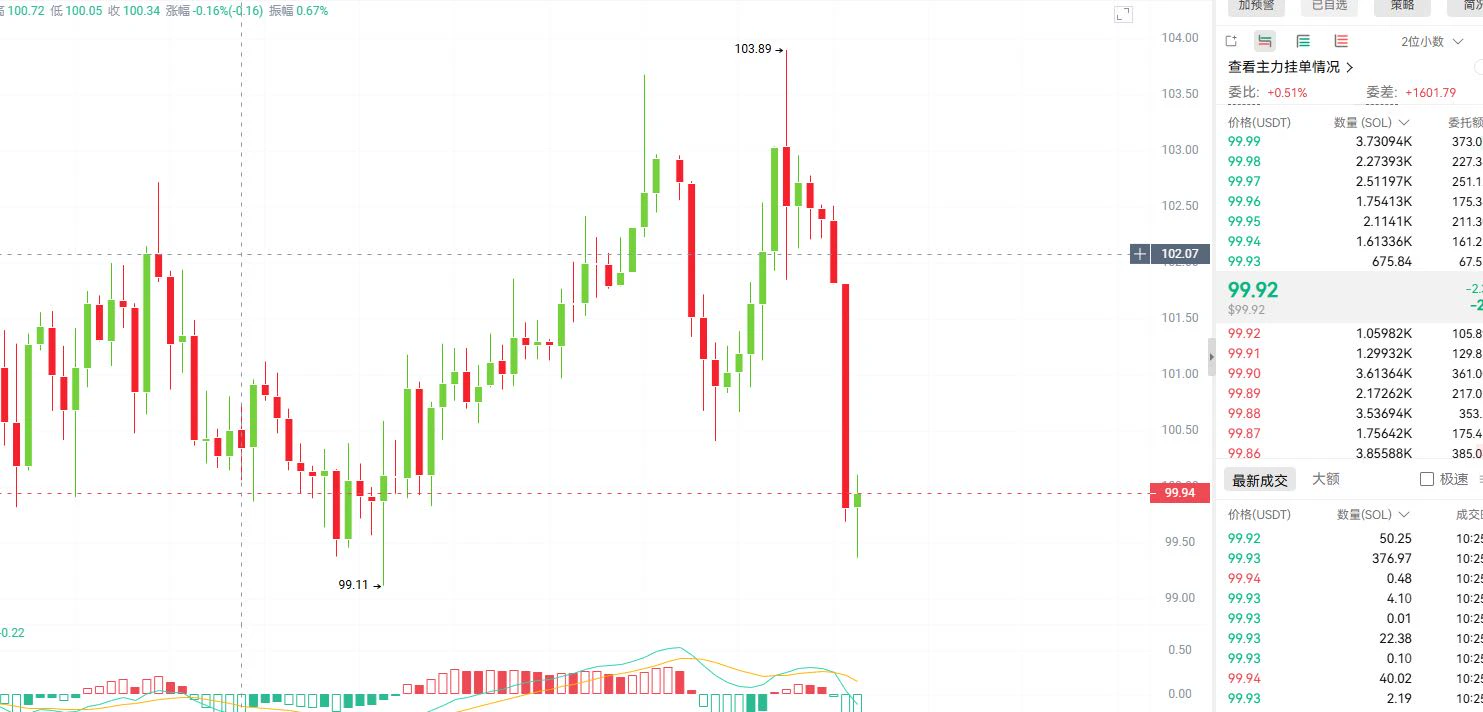
U Sis 10.29 Thursday $SOL Strategy
Entry: Short near a rebound to 101.2-101.8
Stop-loss: Above 102.5
Look for 99.5-98.8
If it retests 98.5 and stabilizes, go long; stop-loss below 97.8
Target: 100.5-101
Market analysis: After SOL surged to 103.89, it faced resistance and weakened. A large bearish candle quickly broke below short-term support, with selling pressure easing faster in high-beta coins and indicators turning downward in tandem. The 101.2-101.8 range was previous support and is now resistance, so favor shorts on a rebound to this area. Longs are a countertrend rebound attempt after
post-image
SOL-0.74%
10.29 Market Analysis
BTC strategy reference setup
Entry zone: Long around 79800—80000
Stop loss: 79100
First target: 81000, second target: 82000
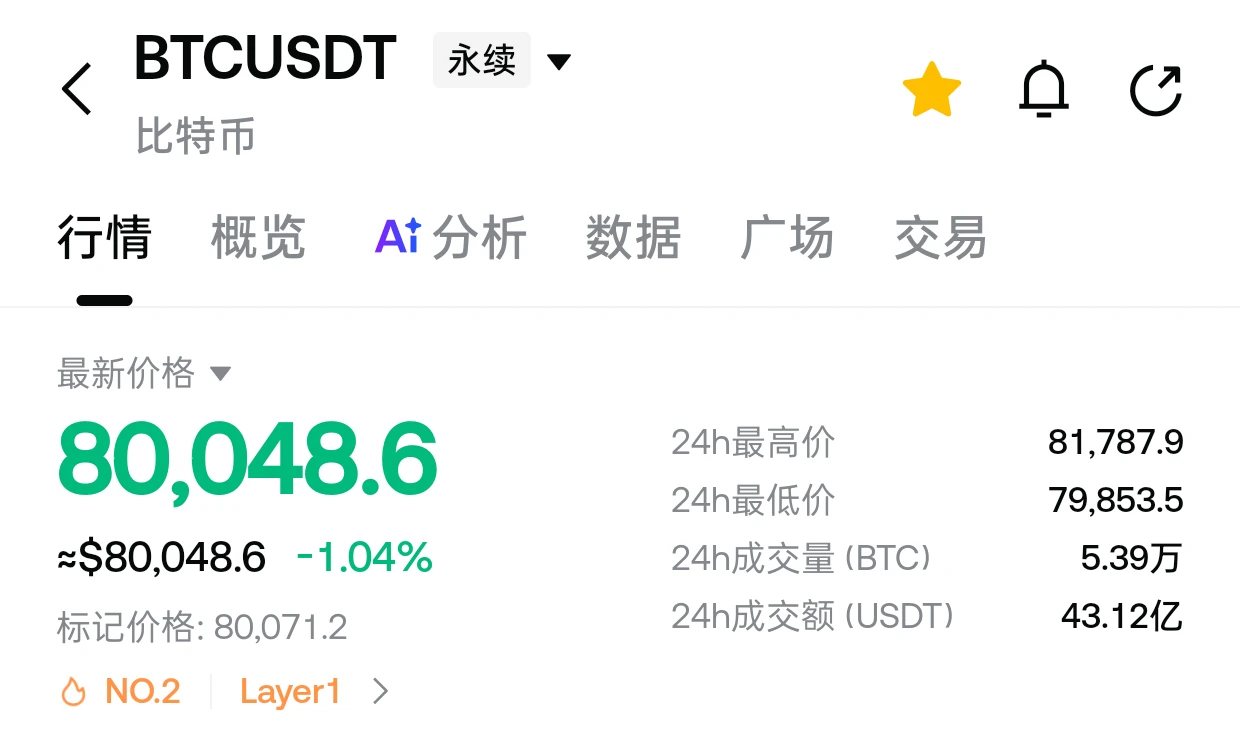
Overnight, BTC continued testing overhead resistance, rebounding to a high of 81759 in the early morning but failing to break the previous high; ETH spiked to 2391 before meeting resistance and pulling back.
Last night's strategy of going long on the retest played out, with the long position banking 1153 points and hitting take-profit smoothly.
Market focus steadily moving higher:
Daily: After a sharp bearish pullback, price stabilized and closed bul
post-image
BTC-0.65%
ETH-1.23%
Just send this; you don’t need to say anything.
post-image
If you've come across this, it's fate. Absolutely do not copy trade. I lost money during that period and still had to share the profits with the lead trader
Oct 29: The Fed stands pat, and gold continues to correct
Last night, the Federal Reserve announced that it would keep interest rates unchanged. Gold prices saw increased short-term volatility after the data was released, first quickly dipping to around 4024 before rapidly recovering above 4082. Overall, prices remain within a high-level range, indicating that buying support below remains relatively solid. However, a closer look at the chart shows that this rally was driven more by short covering and short-term buying after the announcement, rather than a decisive trend breakout.
Technically,
XAUUSD-0.61%
What Is Walk-Forward Backtesting? Why Might a Fixed Period of Historical Data Fail to Adapt to a Changing Crypto Market?
In the cryptocurrency market, a strategy may perform well during an uptrend over the past two years, yet incur frequent losses during the choppy market that follows.
This does not necessarily mean the strategy has no value at all; the market environment may have changed. If a trading strategy is developed and tested using only a fixed period of historical data, it may not fully reflect how well it can adapt to different stages.
One method worth learning about is Walk-Forward
post-image
Scumbag Watch: GOOGLE
A few days ago, while browsing X, I saw a chance to follow Buffett’s lead, so I took a look at Google’s candlestick chart. My impression at the time was that it looked like it hadn’t finished falling yet, so I placed a long order near the annual moving average.
When I got up this morning, I saw that the order had filled, and it’s currently showing a small profit.
Let’s take a look at Google’s Q3 earnings. In theory, its phenomenal Q2 results were unsustainable (spcx’s IPO brought in nearly 100 billion in investment gains). In Q3, its overall investment in spcx was actuall
GOOGL+1.58%
SPCX-2.26%
If you don't reduce your position and hold overnight, I'll hit you #美联储继续按兵不动 #ETH SNDK
Saw the price surge this morning and said in the group that SanDisk was near 1290; with no volume, I opened a small short!
ETH extreme levels to watch: 2282, 2220
SanDisk intraday levels to watch: 1301, extreme 1272
Precise levels for each category today were sent at noon; follow for ongoing updates
post-image
ETH-1.26%
SNDK+7.68%
Raveena invites you to watch Gate Live.
Live Topic: crypto market update
Live Time: 2026/10/28 19:48
Click the link below to join the live room directly:
What Is Monte Carlo Simulation? Why Can a Positive-Expectancy Strategy Still Suffer Consecutive Losses?
In cryptocurrency trading, even if a strategy has been backtested and has a positive expected return, that does not mean real-world trading will necessarily go smoothly. Consecutive losses and maximum drawdowns exceeding expectations may cause traders to abandon an otherwise effective strategy prematurely. Monte Carlo simulation is one method that can help us study these risks.
First, what is Monte Carlo simulation?
It repeatedly generates a large number of possible trading outcomes to exami
post-image
Halloween 🎃 Candy challenge carnival week
live-cover
LIVE1,952
Price rises and OI increases: Does this mean capital is entering or risks are building up?
In crypto derivatives trading, when prices rise and open interest (OI) also increases at the same time, many people assume that longs are continuing to enter the market and that prices may keep rising. But this judgment is not always correct, because OI reflects outstanding contract exposure, not the market’s net long capital.
First, what do rising prices and rising OI indicate?
This usually means that outstanding contract exposure is also increasing as prices rise, and market participants are opening or
post-image
  • 1
Chips carry computing power, and computing power gives rise to intelligence.
Powerful foundational computing power supports AI’s ability to perceive, create, analyze, and predict.
Build the foundation with chips, unlock new capabilities through computing, and activate digital productivity.
post-image
📈 Top traders let the data speak!
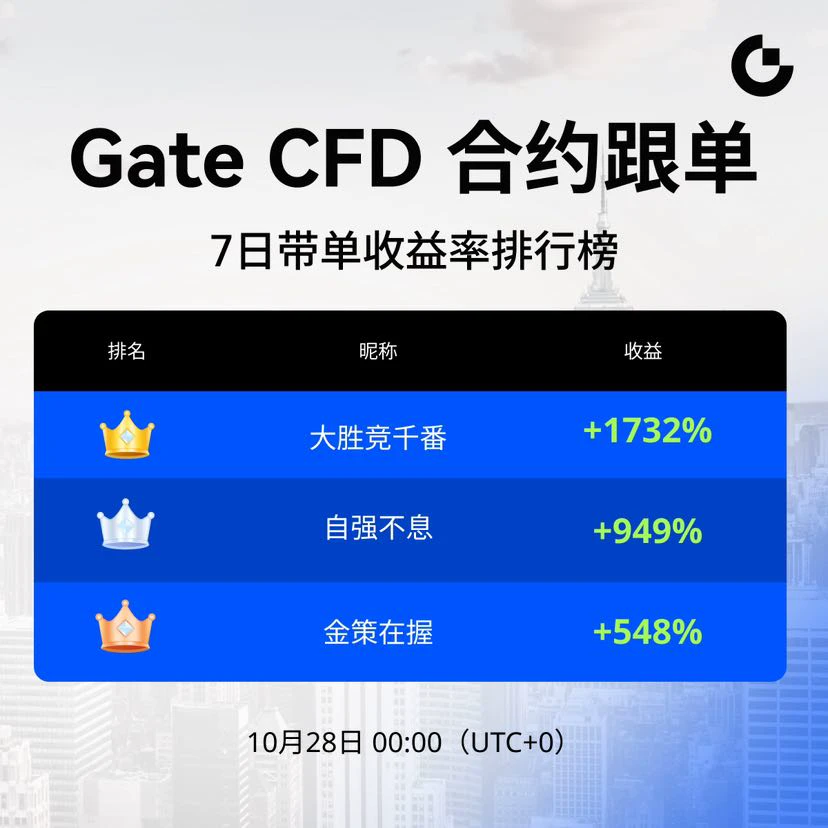
CFD contract lead trader 7-day returns leaderboard
🥇Winning big by a thousandfold: +1732%
🥈Constant self-improvement: +949%
🥉Golden strategies in hand: +548%
Their track records speak for themselves; choosing the right one is key.
Follow proven traditional CFD strategies and easily access major markets such as gold, forex, indices, and popular US stocks, helping your funds grow more efficiently.
👉 Follow now:
https://www.gate.com/zh/copytrading/tradfi
#CFD #传统金融 #跟单 #被动收益
CopyTrading
📈 Top traders let the data speak!
CFD contract lead trader 7-day returns leaderboard
🥇Winning big by a thousandfold: +1732%
🥈Constant self-improvement: +949%
🥉Golden strategies in hand: +548%
Their track records speak for themselves; choosing the right one is key.
Follow proven traditional CFD strategies and easily access major markets such as gold, forex, indices, and popular US stocks, helping your funds grow more efficiently.
👉 Follow now:
https://www.gate.com/zh/copytrading/tradfi
#CFD#传统金融 #跟单 #被动收益
repost-content-media
XAU+0.38%
German asset management giant DekaBank has disclosed for the first time that it bought shares of Strategy (MSTR), holding 104,921 shares valued at approximately $15.2 million.
Strategy is a globally renowned Bitcoin treasury company, and its share price is closely tied to BTC's performance. The investment reflects continued interest in Bitcoin-related assets among traditional financial institutions.
But buying MSTR is not the same as buying BTC directly. The stock premium, the company's financing, and Bitcoin price volatility can all affect investment returns.
What’s worth watching next is whe
post-image
MSTR+2.73%
BTC-0.67%
The more spectacular the AI results, the harder the stock falls? Google gave investors a reality check
Cloud business growth of 103% still isn’t enough? Google’s stock briefly fell nearly 10% as the AI frenzy enters the time-to-do-the-math phase!
If investing in the stock market is like dating, AI is the charming partner with a bright future, while free cash flow is their paycheck.
A handsome face and promising prospects are certainly alluring; but if you keep investing in the future and draining your wallet every month, even the sweetest relationship is bound to make you uneasy.
Google Cloud’
GOOGL+1.58%
Load More

Join 40 M users in our growing community

⚡️ Join 40 M users in the crypto craze discussion

💬 Engage with your favorite top creators

👍 See what interests you

Trending Topics

FedKeepsRatesSteady

37.44k Views1.75k Discussing

The Fed will announce its rate decision on October 28 at 18:00 (UTC), followed by a press conference at 18:30 (UTC). Markets widely expect rates to remain unchanged, with attention turning to future policy signals. Could this decision break crypto out of its trading range? What signals are you watching?

GateFirstToLaunchGoldCFD7X23Trading

68.27k Views6.45k Discussing

GoogleCloudSurges103%ButStockFalls

71.82k Views533 Discussing

View More