Square
Following
Hot
News
Notifications
Profile
Share your thoughts
placeholder
Article
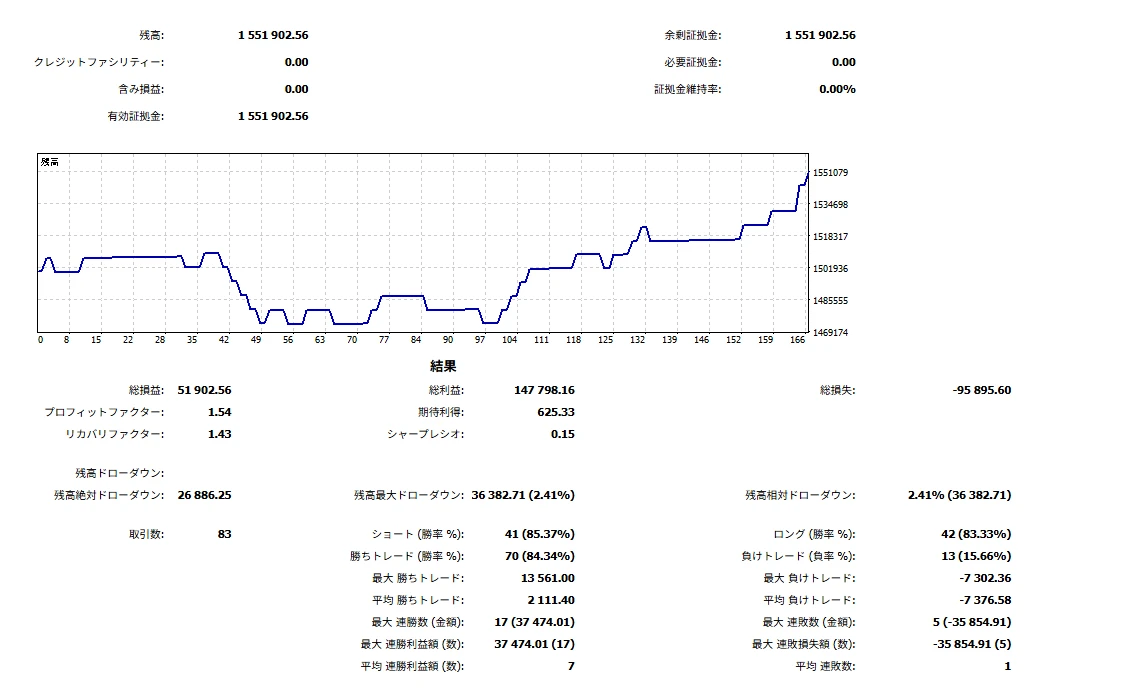
Our EA.
Maybe because it specializes in options, it can't ride the big waves—that's the problem.
post-image
Some people say they’re very accurate, and I have no idea what they’re talking about
Thanks, Herman Jin. Now I understand
I’ll launch X Subscribers in the future, $5 a month
I’ll make all investment-related posts Subscriber Only
post-image
Trenches
ZIG
Z
bade
b
ZIG
0x8c...1145
Market Cap
$.
Change
.
24h Vol
$.
Holders
.
BTC
B
bade
b
BTC
C5xp...pump
Market Cap
$.
Change
.
24h Vol
$.
Holders
.
HIGH
H
bade
b
HIGH
7ymF...high
Market Cap
$.
Change
.
24h Vol
$.
Holders
.
CORLA
C
bade
b
CORLA
0xba...7777
Market Cap
$.
Change
.
24h Vol
$.
Holders
.
STONK
S
bade
b
STONK
6GmA...UNgx
Market Cap
$.
Change
.
24h Vol
$.
Holders
.
Crypto Market update
live-cover
LIVE558
📡 Signal Card | Relay Mode
Source: Bit_Guru
Asset: $RARE
Short entry: 0.01212
Targets: 0.01195 / 0.01184 / 0.01168
Stop-loss: 0.01223
Speaking of which, earlier today (11-06), sis relayed this person’s $ELSA trade, and here they are again. That’s a pretty high attendance rate 👀
As usual, sis is just the messenger, passing along the 5 elements unchanged. Whether to follow and how much to position are up to you. The market owns the price action; the decision is yours 🫠
Shared as a personal record, not investment advice. #US AI stocks diverge: cloud service providers rise while data center s
ELSA+5.80%
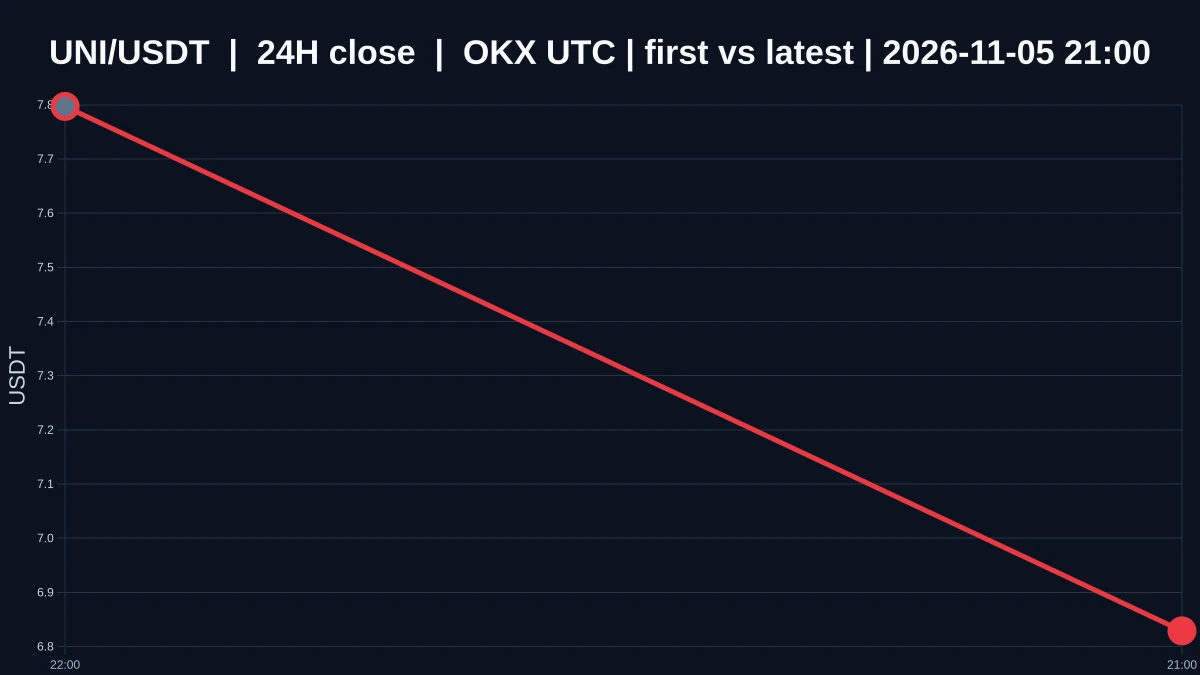
$UNI Has Entered Oversold Territory, So Why Can’t We Say It Has Bottomed?
$UNI is currently priced at 6.827, down 10.253713684764032% over 24 hours, with an intraday range of 6.616 to 7.82. The 1-hour and 4-hour trends are both weak, and the 1-hour volume ratio is 0.010346356381599834. With the price down to this level, short-term oversold conditions are building, but the structure has not stopped weakening. I would not equate oversold with having bottomed.
Oversold describes a price that has fallen enough in a short period of time. A bottom describes a point where selling pressure has truly r
post-image
UNI+3.05%
ARIA | Long 🟢 | Bullish | 24h: +22.79% | Volume: 84.5M USDT. Long rationale: Price is above EMA200; EMA20/50/200 are in bullish alignment; RSI14 is 57.6; MACD histogram is positive; ADX14 is 26.3; volume is 0.39 times the 20-candle average; trend pullback/continuation. Entry: 0.15505 Stop-loss: 0.143045 Take-profit 1: 0.170056 | Take-profit 2: 0.17906 | Take-profit 3: 0.191065 Entry price is for reference only; do not chase the price. This strategy is invalidated if the stop-loss level is hit. Technical analysis only; not financial advice. $ARIA
post-image
ARIA+22.03%
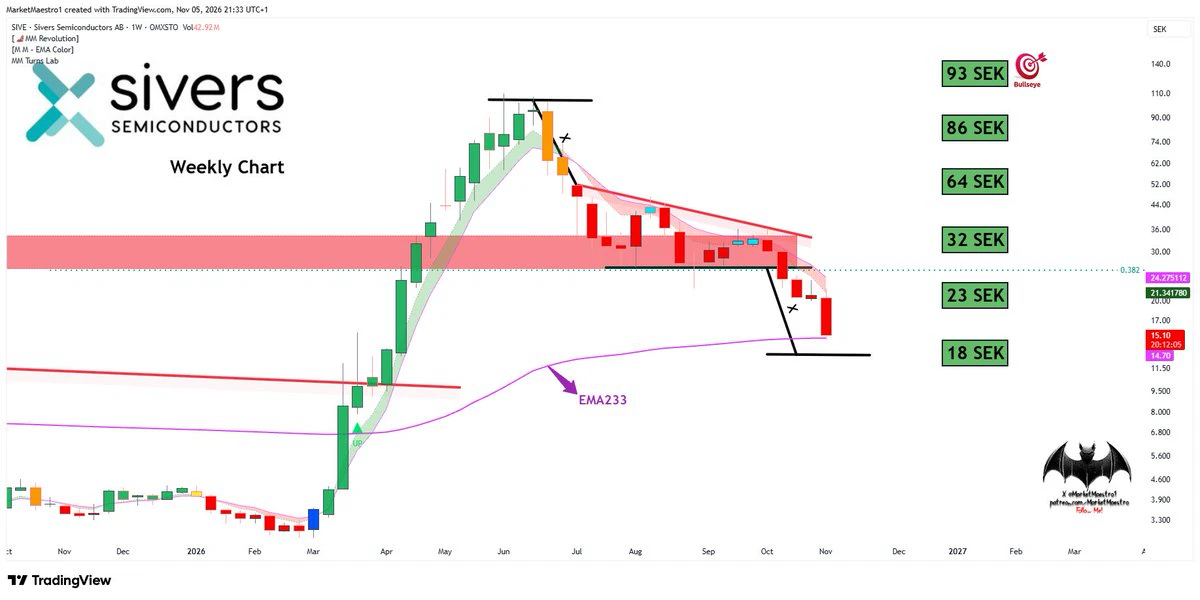
$SIVE 🇸🇪
It managed to hold at 14.7 SEK. I think it's close to the
bottom 🤞
post-image
🚨🇷🇺🇮🇷 Breaking: Putin and Iran plan to build a major energy pipeline!🛢️🔥Russia and Iran are discussing a new natural gas pipeline that could reshape regional energy markets!⚠️ Rising geopolitical tensions could trigger volatility in oil, gold, and cryptocurrency markets.👀 Will this cooperation shake up global markets? Russia Iran Putin Oil Bitcoin$BTC $CL $BZ
post-image
CL-1.83%
BZ-1.18%
The suspense just got bigger!
Artist announcements are coming later this weekend
And it’s not just one show or one artist. It’s a combination of talents, energy, and unforgettable experiences.
Something bigger is coming. #FutureFest26
$CAP ‌ is building a strong bullish structure, and buyers are clearly back in control.

Price has climbed to $0.1071 after reclaiming the $0.09 area. The daily Supertrend remains bullish at $0.06086, while momentum is now bringing the previous high into focus.

Key levels to watch:

Support: $0.091–$0.089

Near-term resistance: $0.1129

Major resistance: $0.1219

Trend support: $0.0608

A clean break above $0.1129 could set up a retest of $0.1219. If buyers fail to hold $0.089, a deeper pullback becomes possible.

CAP is showing impressive relative strength. The next challenge is turning thi
CAP+8.34%
TSLA-10.84%
  • 2
  • 2
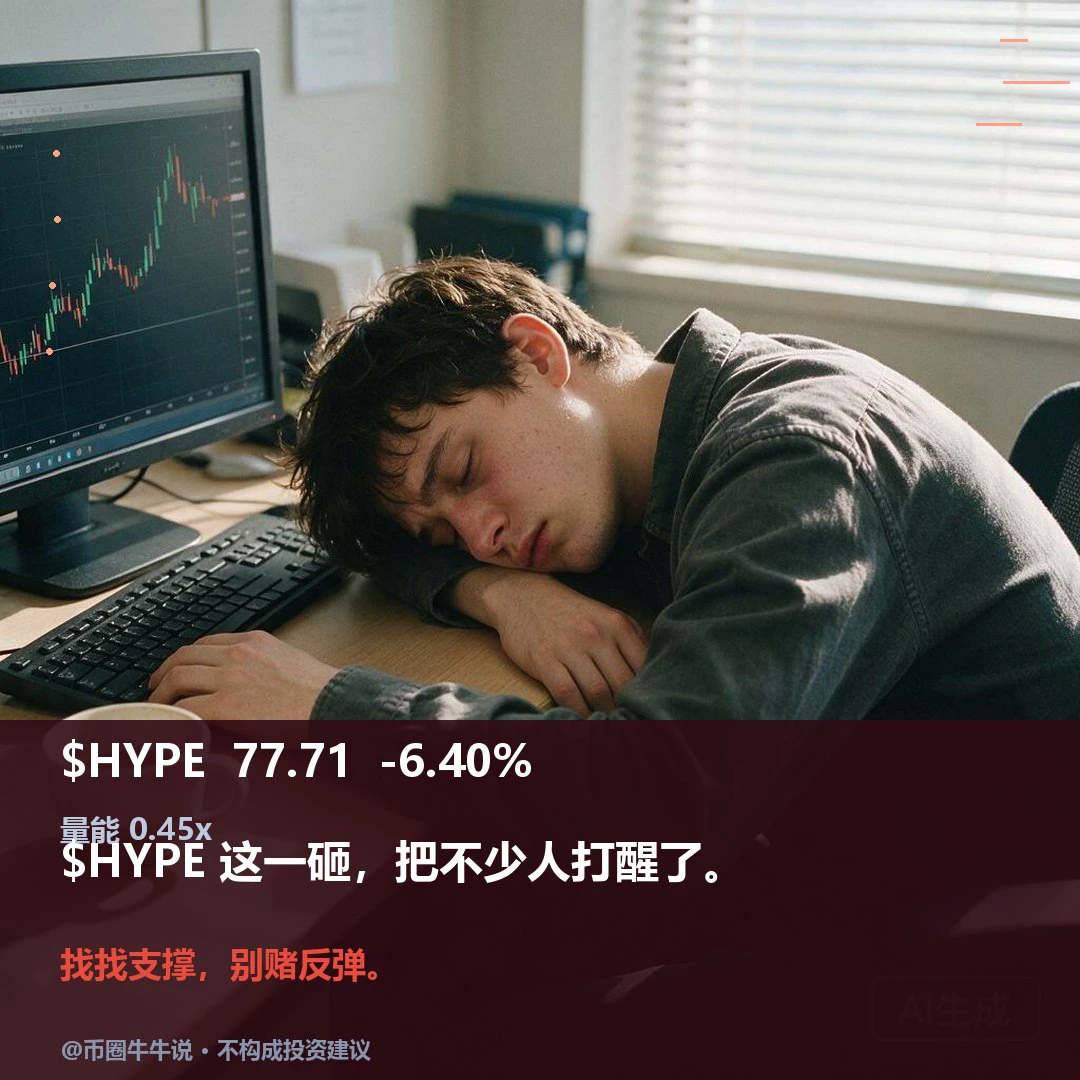
$HYPE Currently at 77.706, down 6.40% over 24H (77.444–84.895). 1H is weak: RSI 19.91, and the current price is below the EMA20 at 80.65; 4H is weak: RSI 22.76, and the current price is below the EMA20 at 83.02. The 1H volume ratio is 0.45. If the price holds above the 84.895 resistance, watch for continuation; if it breaks below the 77.444 support, the short-term outlook weakens. Going forward, review whether the price can hold above 84.895 and whether it can recover after losing 77.444. An oversold RSI only indicates rebound demand; it does not mean the price has bottomed. With volume at 0.4
post-image
HYPE+0.24%
ETH Technical Outlook: Ethereum Tests Critical Support as Bearish Pressure Remains

Ethereum is trading around $2,265–$2,267, testing the 0.236 Fibonacci level near $2,265.68 after pulling back from its recent recovery high around $2,358–$2,385.

The latest daily chart shows ETH trading below all four major EMAs. Although RSI has started to recover, the broader structure remains under pressure. Holding the $2,241–$2,265 support area is important for preventing another move lower.

EMA Structure

ETH is currently trading below all four major moving averages:

- 20 EMA: $2,349.35
- 50 EMA: $2,40
ETH-1.26%
  • 1
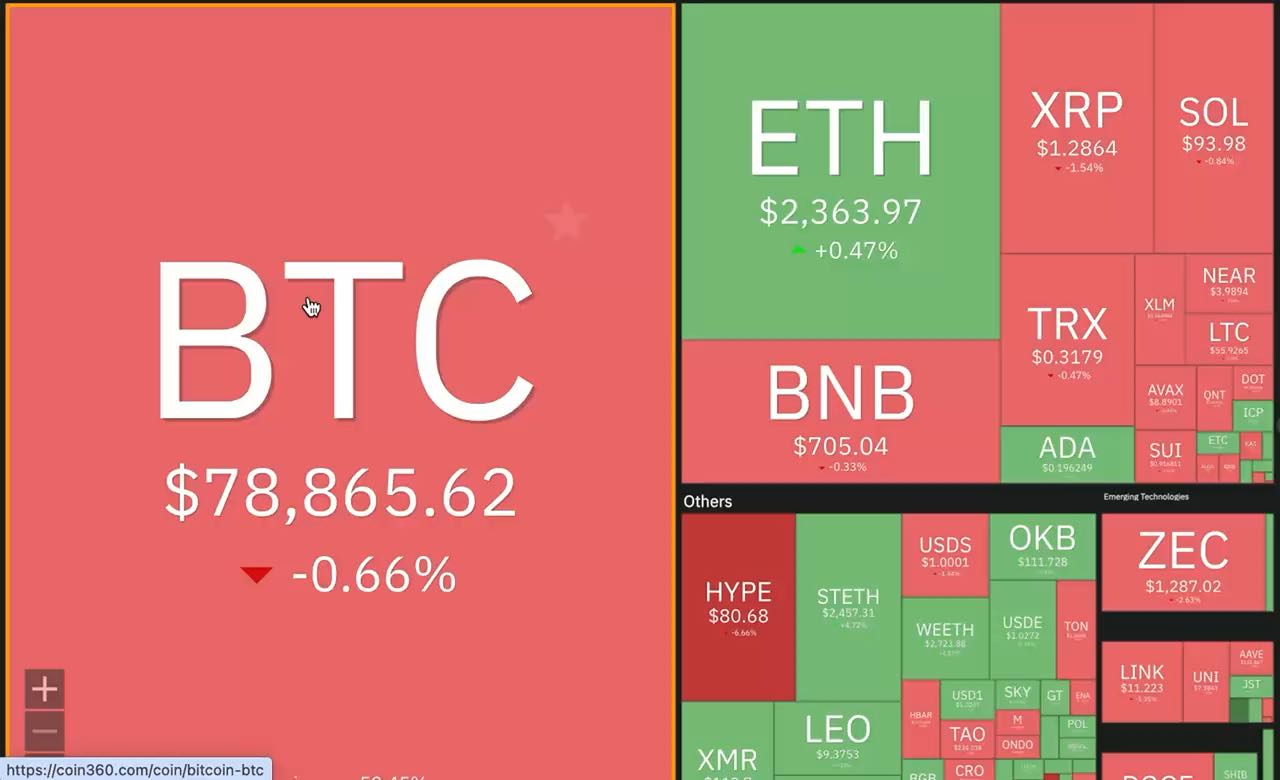
$BTC at $78.8K, $ETH holding green while $SOL , $XRP and $BNB are struggling

What’s your move here fams?

Buying the dip, waiting for confirmation or staying in cash?
BTC-0.67%
ETH-1.26%
SOL-0.77%
XRP-1.15%
BNB-0.76%
$US has completely stopped falling; loading up on spot at the bottom
US-7.23%
Bearish signals at full blast: Nvidia plunges nearly 9% in a single day, Nasdaq officially enters correction territory
Tokenized Nvidia XNVDA is currently quoted at $183.06, down 8.85% in 24 hours, with trading volume of approximately 6.2 million USDT.
During the U.S. session, Nvidia closed down about 9%, making it one of the largest-weighted stocks dragging down the Dow, while the Philadelphia Semiconductor Index plunged more than 11% at one point intraday (reported by NBC/ABC).
The chain of events is clear: Qualcomm and Arm earnings released after Wednesday’s close were deemed below expecta
post-image
XNVDA
XNVDASPACEXNVDA
Pump.Fun
MC:$2.79KHolders:1
0%
NVDA-9.33%
NVDAG-0.24%
NVDAON-0.34%
NVDAX-0.33%
NAS100-0.07%
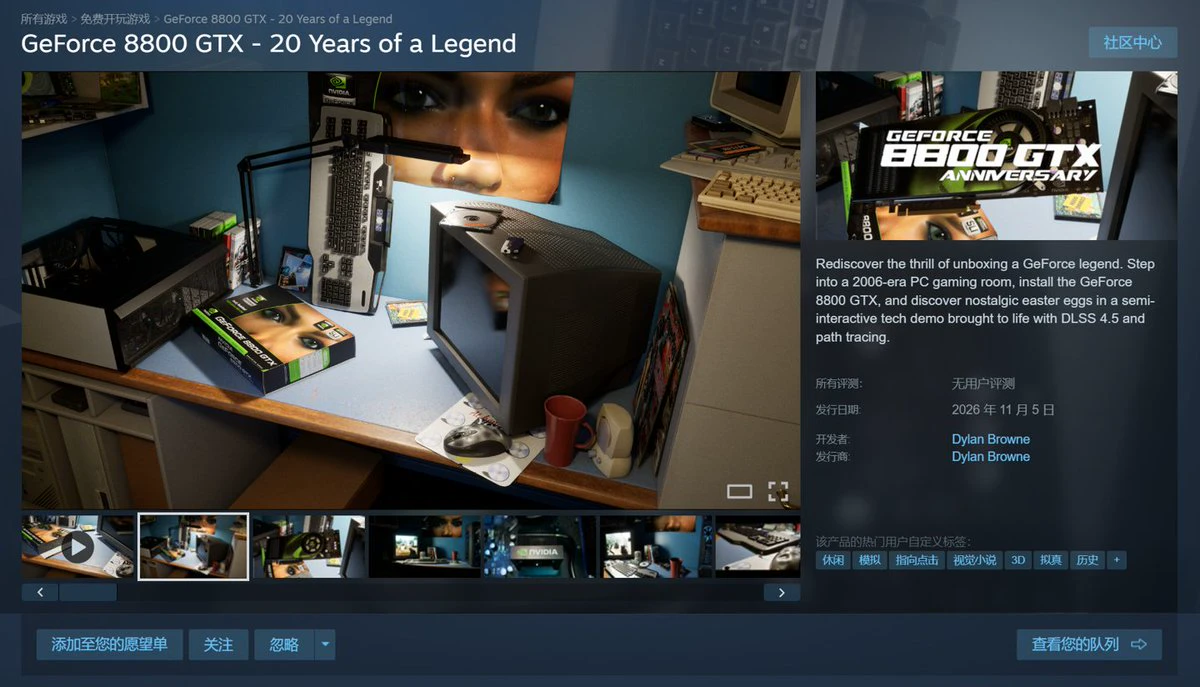
NVIDIA has released a Steam demo game created by Unreal Engine artist Dylan Browne, taking players back to a 2006 gaming room to unbox and install a GeForce 8800 GTX, which launched on November 8, 2006.

The contrast is striking: the flagship card of the time had just 768MB of GDDR3, 155W of power consumption, and PCIe 1.0, while the commemorative demo supports modern technologies such as path tracing and DLSS 4.5 Ray Reconstruction—wrapping nostalgia for the old card in a layer of modern ray tracing.
$BTC
post-image
NVDA-9.33%
BTC-0.67%
ZEC short positions were opened in the 1330 resistance zone the previous day. Price surged to 1334, met resistance, and failed to break higher before turning lower, dipping to a low of 1212 and locking in a 120-point profit.

From the current chart, after a daily surge and pullback, price has moved back below the Bollinger middle band. The upper band is clearly acting as resistance, bearish MACD signals are gradually emerging, and the overall center of gravity is shifting lower. The broader market remains range-bound with a bearish bias, and overhead selling pressure should not be underestimat
post-image
ZEC+1.29%
Future fest is not here to play this time around🔥 momentum is already building and I can See party announcements happening already . I’m so ready #FutureFest26
Load More

Join 40 M users in our growing community

⚡️ Join 40 M users in the crypto craze discussion

💬 Engage with your favorite top creators

👍 See what interests you

Trending Topics

GateLaunchesPoSECProofOfSecurity

8.29k Views546 Discussing

Beyond Proof of Reserves, Gate has introduced PoSEC, a new Proof of Security framework focused on how user assets are stored and protected. By disclosing the distribution of assets across cold storage and hot wallets, users can directly understand Gate’s storage structure and risk coverage under extreme scenarios. Gate’s latest cold storage coverage ratio stands at 104.58%, meaning cold-storage assets alone are sufficient to cover all user assets. PoR verifies whether reserves are sufficient, while PoSEC shows how assets are stored and how risks are covered — together forming a more complete asset security framework. Share your results and experience! [👉 Learn more](https://gate.com/proof-of-security)

BTCBackAbove80K

132.11k Views41.58k Discussing

DemocratsWinBothChambers

29.06k Views535 Discussing

View More