Share your thoughts
placeholder
Article
$M Over 24 hours, it ran from 1.27 to 1.71 before crashing back to 1.54. I was there for the entire 18% swing, so let me first explain my trades.
At 2:17 a.m., $M was still hovering around 1.29 when trading volume suddenly surged. I judged that major players were accumulating, so I entered with a 1.30 limit order, keeping the position at 15% of my total capital. At 6:40 a.m., it surged to 1.68. Watching the order book, I saw the bids beginning to thin out, so I placed a take-profit order for half the position at 1.65. I wanted to bet that the remaining half would break through the previous hig
IN+0.15%
[ New Streamer ] Today Market Talk
live-cover
LIVE1,681
Insiders are calling $BR /USDT the next quiet breakout nobody is watching.

$BR /USDT - LONG

Trade Plan:
Entry: 1.08056 – 1.12178
SL: 0.90329
TP1: 1.24958
TP2: 1.34852
TP3: 1.49693

Why this setup?
Why now? The daily trend is bullish with 95% confidence, and the 1h price is sitting near the entry zone at 1.10117. The 15m RSI at 49.32 shows just enough room for a push before overbought territory, while the 1h ATR of 0.082449 tells us the next wave of volatility is already priced into the range between 1.08056 and 1.12178. If long bias holds, TP1 at 1.24958 becomes the first real test, with
BR+29.31%
Market Alert

$PEPE /USDT - SHORT

Trade Plan:
Entry: 0 – 0
SL: 0
TP1: 0
TP2: 0
TP3: 0

Why this setup?
Technical setup found.

Debate:
Thoughts?

⚠️ Personal market analysis only. NFA — manage risk and DYOR.
Educational content, not investment advice or a recommendation to buy, sell, deposit, or withdraw any asset. No paid promotion or referral/affiliate links.
PEPE+5.71%
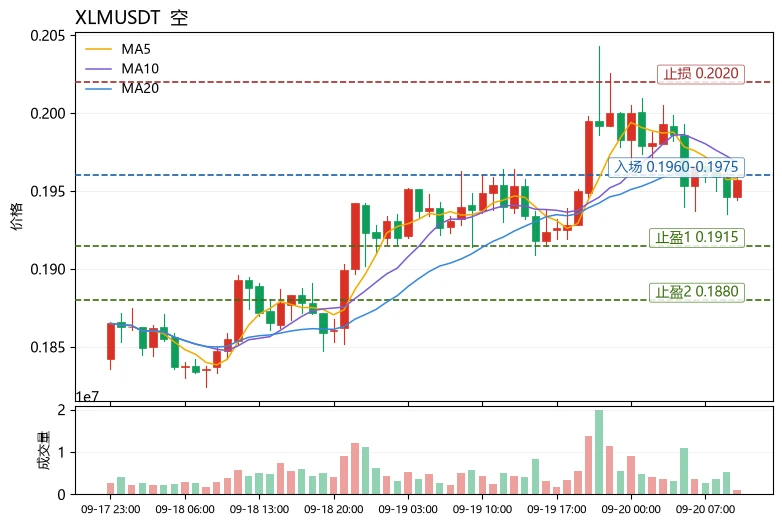
$XLM Conclusion first: bearish in the short term; reduce positions on rebounds and do not chase longs. Current volatility is in the mid-to-low range, but the structure is weakening, making the risk-reward ratio unfavorable for longs.
Rationale: MA5=0.1958 has fallen below MA20=0.19649, with the moving averages in a bearish alignment; the MACD histogram=-0.0005962 remains negative, indicating that momentum has not recovered; RSI=50.6 is neutral to weak, lacking momentum support for an upside breakout. The Bollinger Bands [0.191256, 0.201724] have limited width, and the price is trading near but
post-image
XLM-2.17%
Market Alert

$TRUMP /USDT - SHORT

Trade Plan:
Entry: 2.013 – 2.037
SL: 2.137
TP1: 1.941
TP2: 1.885
TP3: 1.802

Why this setup?
Technical setup found.

Debate:
Thoughts?

⚠️ Personal market analysis only. NFA — manage risk and DYOR.
Educational content, not investment advice or a recommendation to buy, sell, deposit, or withdraw any asset. No paid promotion or referral/affiliate links.
TRUMP-1.08%
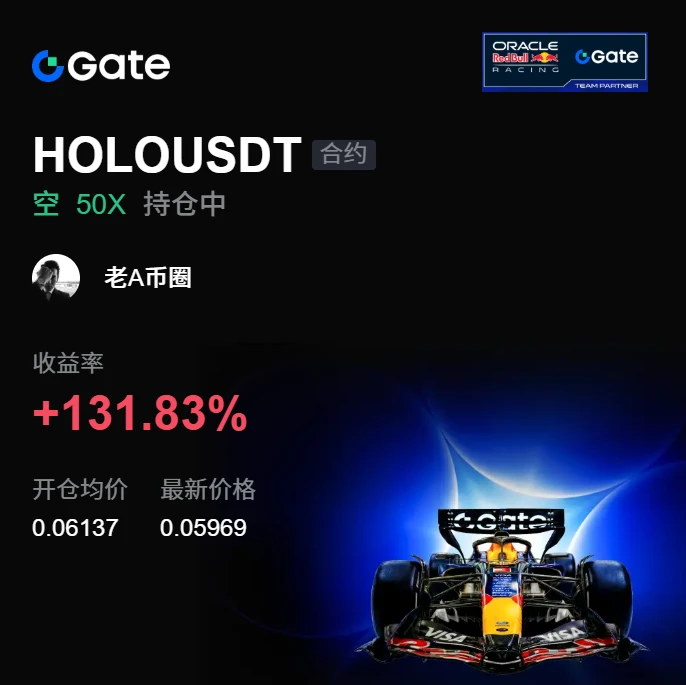
I had already finished complaining to my friends about this week’s market, but now I have to take it back. A bit awkward.
A few nights ago, I checked $HOLO before bed. Every push upward fell just short, the volume failed to follow through, and it strongly smelled like a bull trap. I said just one thing at the time: no one is there to take it higher, so keep holding the short.
Turns out staying up wasn’t for nothing. From 0.06137 to 0.05975, +131.83%—that was a satisfying bite of profit.
Don’t let profits inflate your ego, and don’t despair over pullbacks. I’d rather miss a limit-up than catch
post-image
HOLO-0.85%
ETH-1.51%
LAB+4.63%
A lawsuit has put four AI companies in the same dock, accusing them of working together to slow the pace of AI and reduce the value of the subscriptions users hold.
The defendants are Anthropic, OpenAI, SpaceXAI, and Google. The plaintiffs say they do not oppose these companies lobbying Congress, the White House, or regulatory agencies to call for rules governing AI. The problem, they say, is that these actions were coordinated and ultimately affected the value of paid subscriptions.
The focus of this case is not whether lobbying itself is legal; lobbying is an open business in the United Stat
post-image
GOOGL+0.47%
A whale holding a ZEC short position for nearly half a month was forced to close it, suffering a los
live-cover
LIVE3,100
3-to-1 split announcement lands, ZEC moves only -0.2%: this excitement has nothing to do with the token price
Who could have seen this coming? Less than two hours ago, after the 3-to-1 split announcement, $ZEC moved only from 1470.84 to 1467.89, down -0.2%. The plan is clear: I’ll buy the dip if 1454 holds, and cut losses if 1422 breaks.

Let’s make this clear first—the split applies to the equity token ZCSH, with September 28 as the record date and September 30 as the effective date; the total value remains unchanged. The accompanying ZEC spot fees are close to zero, merely reducing friction
ZEC-5.29%
ETH | Bearish bias 🔴 | 15-minute trend pullback/continuation · Confidence: 90/100 Watch: 2583.67 Invalidation: 2628.62 (1.74%) Targets: 2527.49 / 2493.78 / 2448.83 RSI14: 28.7 · ADX14: 37.4 · Volume: 1.48x If the 15-minute candle closes below the invalidation level, it is invalidated. For educational purposes only. Not financial advice. Leverage carries high risk.$ET
post-image
ETH-1.50%
🛑 Everyone, $ONE looks very weak right now, and the sellers seem to be in complete control. Selling pressure is intensifying, so I’m preparing for a major sell-off that could occur from here.
I will short $ONE with 30x leverage, targeting a drop below $0.0020. The key level to watch is $0.0020. If sellers continue to dominate and support breaks, we could see another strong downward move. I’m closely monitoring the price action and managing risk carefully, as 30x leverage can be extremely dangerous. Will you short $ONE with me, or choose to stay on the sidelines? Click below to trade with m
post-image
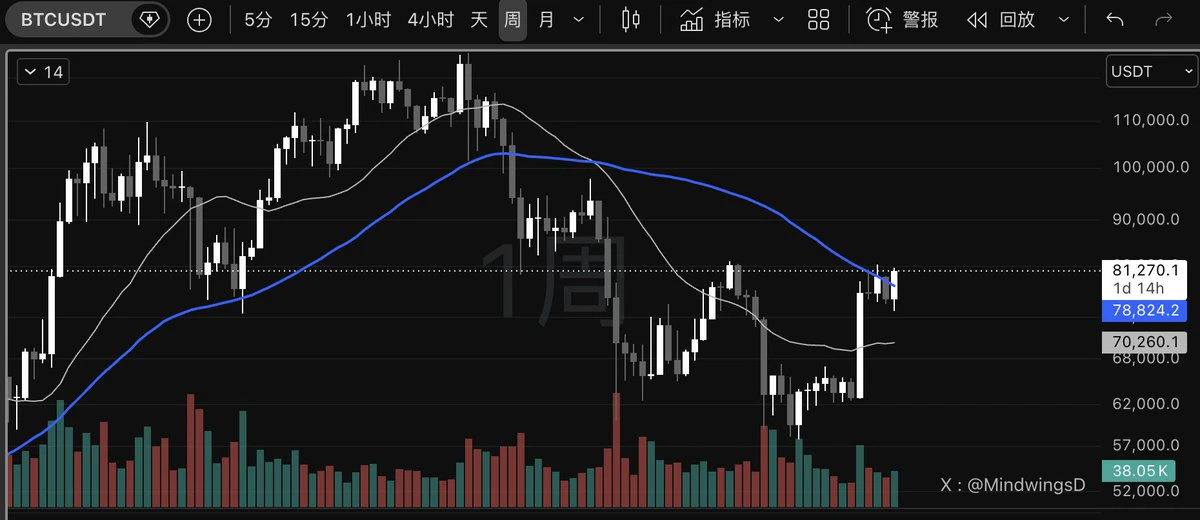
#BTC weekly chart has broken above the MA50, which is a trigger signal for many CTAs. The monthly chart is also about to break above the high of the past 7 months (82.6K), with the next peak target at 97K–100K.
post-image
BTC-0.97%
Tong-ge's 9.20 BTC strategy
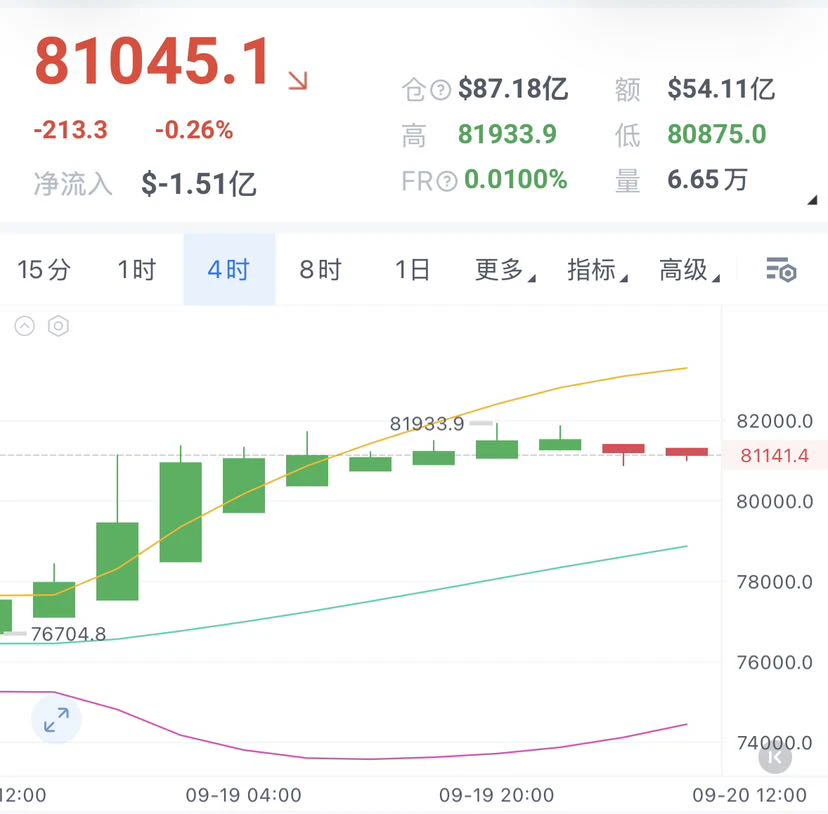
$BTC 818-825: light-position short, stop loss 830, first target 805, second target 790.
On a pullback to around 805, watch for buying support and take a light-position long, stop loss 800, target 815-820.
Current price: 81045. Yesterday's move looked very much like a breakout, with the price pushing higher all the way and reaching 81933 at the high, just one final push away from the previous high at 822-828.
But it still failed to break through. This kind of move most easily gets people carried away: seeing the price keep pushing higher makes it feel like a breakout
post-image
BTC-0.97%
#晒出我的合约收益 $ETH $ETH ‌What a pity about my short position. Next, I’ll look to short from higher levels toward 2,100.
post-image
ETH-1.51%
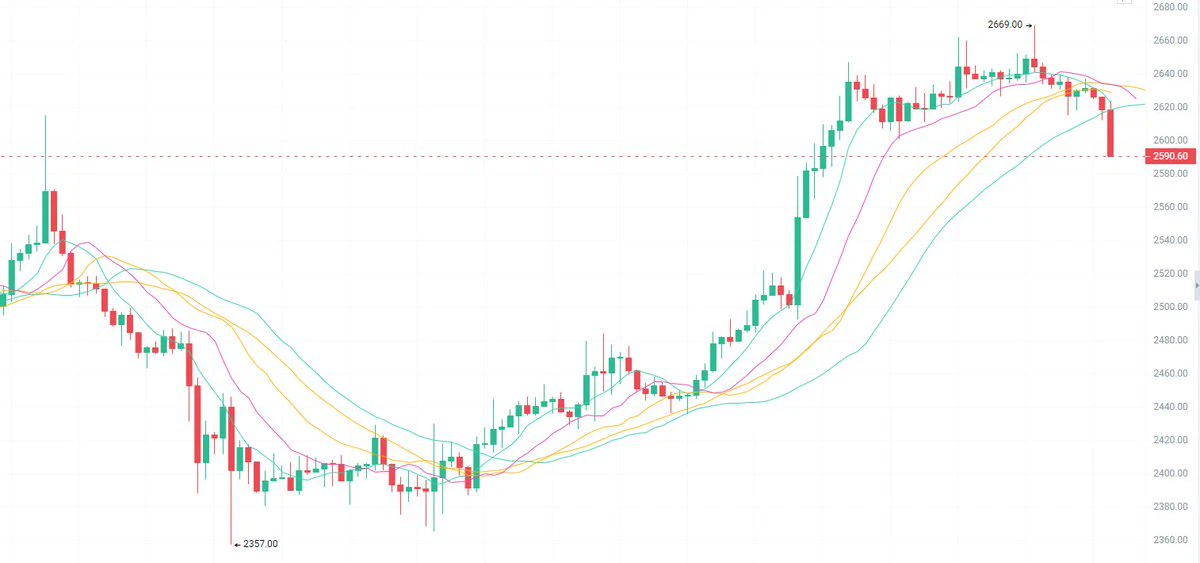
9.20 Ethereum long around 2580, defense at 2550, targets 2680/2750
Ethereum surged to 2669 on the 1H chart before consolidating at elevated levels. The current price is 2606, with short-term moving averages in a bullish alignment.
The 2600 level has shifted from resistance to support. Waiting for a pullback and confirmation before going long is more stable than chasing the price higher.
On the news front, Ethereum ETFs recorded net outflows of $140 million last week, ending four consecutive weeks of inflows. However, BlackRock’s ETHA saw a single-day net inflow of $114 million, clearly s
post-image
ETH-1.50%
Gate Gold Special: CFD Gold
Gold Cash Machine: Sharing a Stable Short-Term Profitable Trading Method
For sharing personal live-trading records only; this does not constitute any investment advice~
Many beginners encounter the same problem when trading gold short-term: they dare not enter when the market has just started moving, then chase the price after it has risen for a while, only to get stopped out by a pullback right after entering. The problem is not the market, but the timing of entry. In short-term trading, there is only one of the most common and stable approaches: follow the trend,
PAXG-0.20%
XAU-0.22%
  • 3
#EthereumSpotETFsSee144MNetInflow Spot ETFs See $144M Net Inflow, What Does This Mean for ETH and the Crypto Market?
Ethereum continues to attract attention as institutional investors show growing interest in the second largest cryptocurrency. Recent data indicates that Ethereum spot ETFs recorded a net inflow of $144 million, highlighting renewed demand from investors seeking exposure to ETH through regulated financial products.
ETF inflows are an important indicator of market sentiment. When investors move significant capital into spot Ethereum ETFs, it can reflect increasing confidence in E
ETH+7.79%
BTC-0.97%
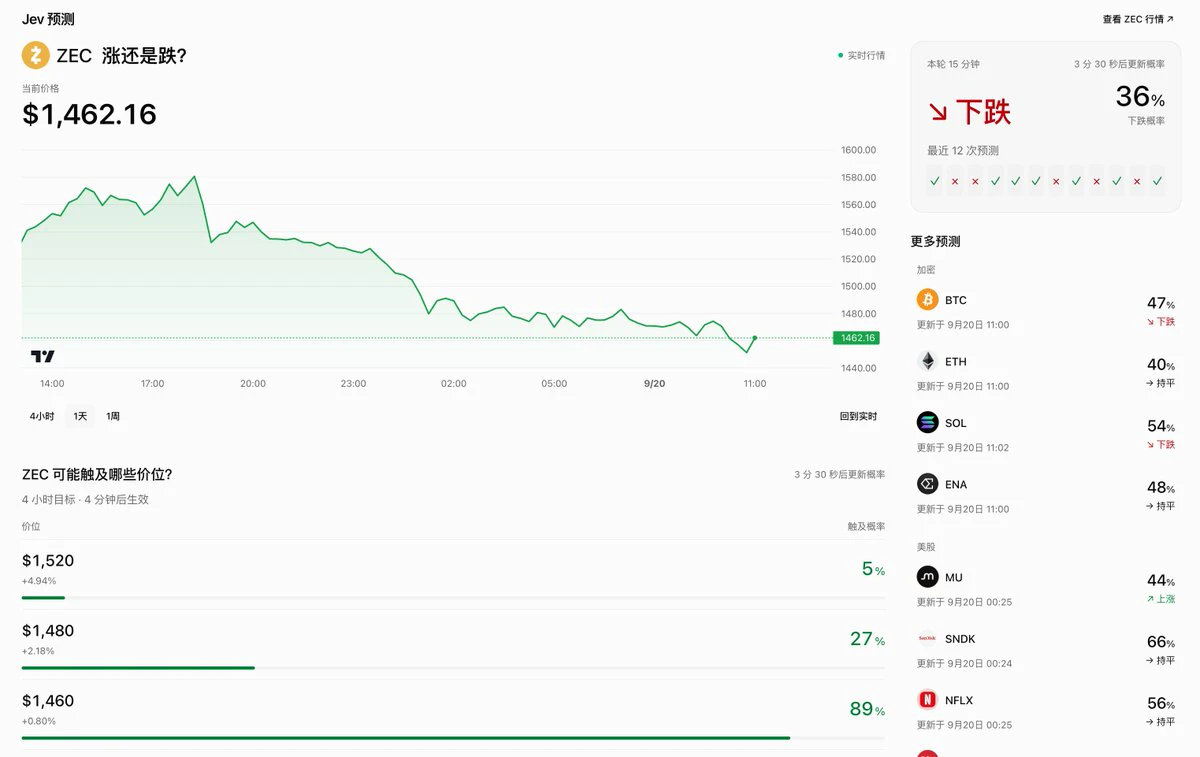
Jev’s short-term market predictions are quite accurate.
post-image
Load More

Join 40 M users in our growing community

⚡️ Join 40 M users in the crypto craze discussion

💬 Engage with your favorite top creators

👍 See what interests you

Trending Topics

MSTRTopsNasdaq100

72.4k Views2.6k Discussing

Strategy (MSTR) has gained about 48% over the past month, making it the best-performing stock in the Nasdaq 100, while Bitcoin rose roughly 12% over the same period. The company holds 845,050 BTC with a cumulative cost basis of about $63.73B. MSTR is not a pure Bitcoin proxy — its price swings can be more extreme. Can this rally last?

BTCRetakes80K

56.14k Views59.79k Discussing

GarrettJinHolds320MInZEC

37.24k Views1.4k Discussing

View More